MCAT General Chemistry Review - Steven A. Leduc 2015
Phases
7.1 PHYSICAL CHANGES
Matter can undergo physical changes as well as chemical changes. Melting, freezing, and boiling are all examples of physical changes. A key property of a physical change is that no intramolecular bonds are made or broken; a physical change affects only the intermolecular forces between molecules or atoms. For example, ice melting to become liquid water does not change the molecules of H2O into something else. Melting reflects the disruption of the attractive interactions between the molecules.
Every type of matter experiences intermolecular forces such as dispersion forces, dipole interactions, and hydrogen bonding. All molecules have some degree of attraction towards each other (dispersion forces at least), and it’s the intermolecular interactions that hold matter together as solids or liquids. The strength and the type of intermolecular forces depend on the identity of the atoms and molecules of a substance and vary greatly. For example, NaCl(s), H2O(l) and N2(g) all have different kinds and strengths of intermolecular forces, and these differences give rise to their widely varying melting and boiling points.
Phase Transitions
Physical changes are closely related to temperature. What does temperature tell us about matter? Temperature is a measure of the amount of internal kinetic energy (the energy of motion) that molecules have. The average kinetic energy of the molecules of a substance directly affects its state or phase: whether it’s a solid, liquid, or gas. Kinetic energy is also related to the degree of disorder, or entropy. In general, the higher the average kinetic energy of the molecules of a substance, the greater its entropy.
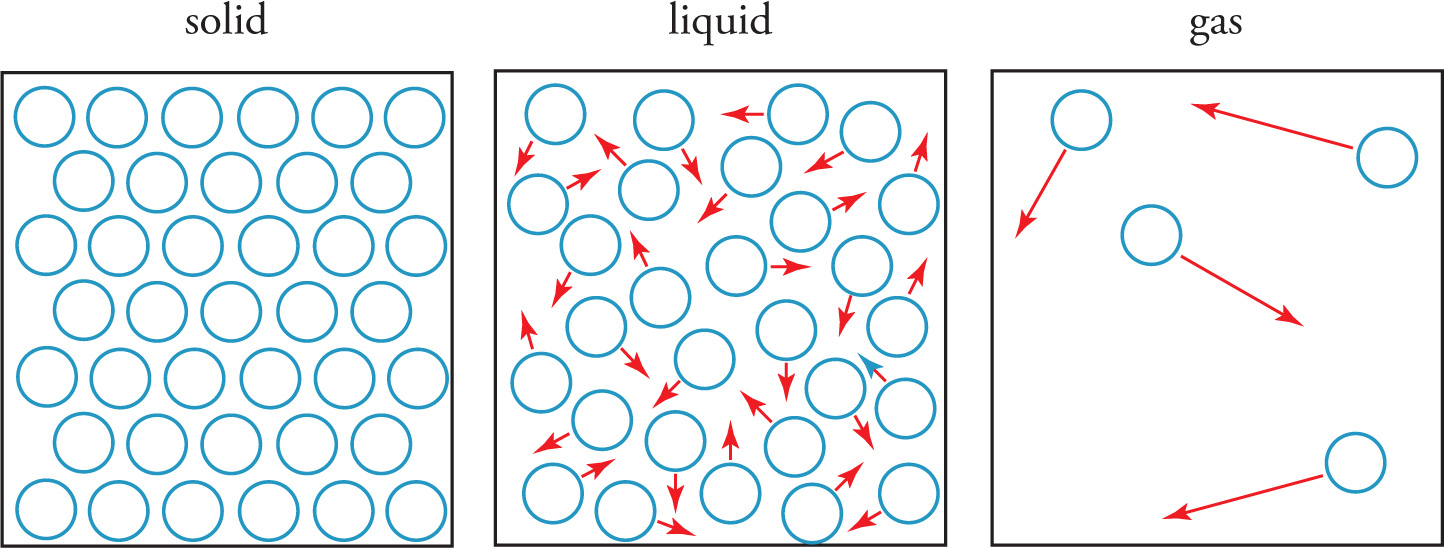
If we increase the temperature at a given pressure, a solid typically transforms into liquid and then into gas. What causes the phase transitions as the temperature increases? Phase changes are simply the result of breaking (or forming) intermolecular interactions. At low temperatures, matter tends to exist as a solid and is held together by intermolecular interactions. The molecules in a solid may jiggle a bit, but they’re restricted to relatively fixed positions and form an orderly array, because the molecules don’t have enough kinetic energy to overcome the intermolecular forces. Solids are the most ordered and least energetic of the phases. As a solid absorbs heat its temperature increases, meaning the average kinetic energy of the molecules increases. This causes the molecules to move around more, loosening the intermolecular interactions and increasing the entropy. When enough energy is absorbed for the molecules to move freely around one another, the solid melts and becomes liquid. At the molecular level, the molecules in a liquid are still in contact and interact with each other, but they have enough kinetic energy to escape fixed positions. Liquids have more internal kinetic energy and greater entropy than solids. If enough heat is absorbed by the liquid, the kinetic energy increases until the molecules have enough speed to escape intermolecular forces and vaporize into the gas phase. Molecules in the gas phase move freely of one another and experience very little, if any, intermolecular forces. Gases are the most energetic and least ordered of the phases.
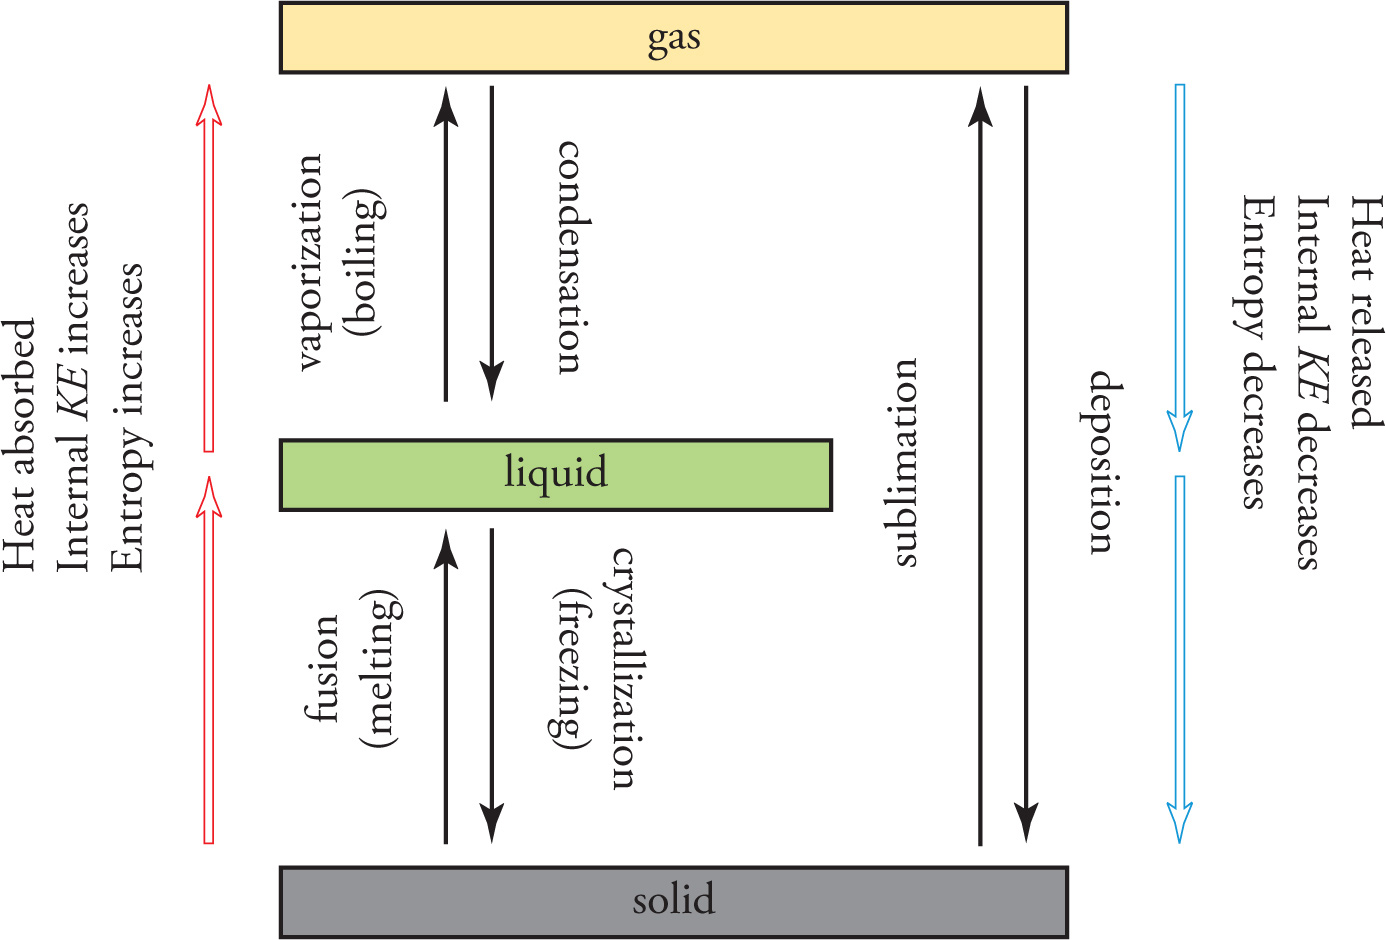
To illustrate these phase transitions, let’s follow ice through the transitions from solid to liquid to gas. Ice is composed of highly organized H2O molecules held rigidly by hydrogen bonds. The molecules have limited motion. If we increase the temperature of the ice, the molecules will eventually absorb enough heat to move around, and the organized structure of the molecules will break down as fixed hydrogen bonds are replaced with hydrogen bonds in which the molecules are not in fixed positions. We observe the transition as ice melting into liquid water. If we continue to increase the temperature, the kinetic energy of the molecules eventually becomes great enough for the individual molecules to overcome all hydrogen bonding and move freely. This appears to us as vaporization, or boiling of the liquid into gas. At this point the H2O molecules zip around randomly, forming a high-entropy, chaotic swarm. All the phase transitions are summarized here.
Example 7-1: Which of these phase changes releases heat energy?
A) Melting
B) Fusion
C) Condensation
D) Sublimation
Solution: Phase changes that bring molecules together (condensation, freezing, deposition) release heat, while phase changes that spread molecules out (melting/fusion, vaporization, sublimation) absorb heat. Choice C is the correct answer. (Note also that choices A and B are identical, so you know they have to be wrong no matter what.)
7.2 HEATS OF PHASE CHANGES
When matter undergoes a phase transition, energy is either absorbed or released. The amount of energy required to complete a transition is called the heat of transition, symbolized ∆H. For example, the amount of heat that must be absorbed to change a solid into liquid is called the heat of fusion, and the energy absorbed when a liquid changes to gas is the heat of vaporization. Each substance has a specific heat of transition for each phase change, and the magnitude is directly related to the strength and number of the intermolecular forces that substance experiences.
The amount of heat required to cause a change of phase depends on two things: the type of substance and the amount of substance. For example, the heat of fusion for H2O is 6.0 kJ/mol. So, if we wanted to melt a 2 mol sample of ice (at 0°C), 12 kJ of heat would need to be supplied. The heat of vaporization for H2O is about 41 kJ/mol, so vaporizing a 2 mol sample of liquid water (at 100°C) would require 82 kJ of heat. If that 2 mol sample of steam (at 100°C) condensed back to liquid, 82 kJ of heat would be released. In general, the amount of heat, q, accompanying a phase transition is given by
q = n × ∆Hphase change
where n is the number of moles of the substance. If ∆H and q are positive, heat is absorbed; if ∆H and q are negative, heat is released.
Example 7-2: The melting point of iron is 1530°C, and its heat of fusion is 64 cal/g. How much heat would be required to completely melt a 50 g chunk of iron at 1530°C?
Solution: Since the heat of transition is given in units of cal/g, we can simply multiply it by the given mass
q = m × ∆Hfusion = 50 g × 64 cal/g = 3200 cal
By the way, a calorie is, by definition, the amount of heat required to raise the temperature of 1 gram of water by 1°C. The SI unit of heat (and of all forms of energy) is the joule. Here’s the conversion between joules and calories: 1 cal ≈ 4.2 J. (The popular term calorie—the one most of us are concerned with day to day when we eat—is actually a kilocalorie [103 cal] and is sometimes written as Calorie [with a capital C]).
Example 7-3: What happens when a container of liquid water (holding 100 moles of H2O) at 0°C completely freezes? (Note: ∆Hfusion = 6 kJ/mol, and ∆Hvap = 41 kJ/mol.)
A) 600 kJ of heat is absorbed.
B) 600 kJ of heat is released.
C) 4100 kJ of heat is absorbed.
D) 4100 kJ of heat is released.
Solution: In order for ice to melt, it must absorb heat; therefore, the reverse process—water freezing into ice—must release heat. This eliminates choices A and C. The heat of transition from liquid to solid is —∆Hfusion, so in this case the heat of transition is q = (100 mol)(—6 kJ/mol) = —600 kJ, so choice B is the answer.
7.3 CALORIMETRY
In between phase changes, matter can absorb or release energy without undergoing transition. We observe this as an increase or a decrease in the temperature of a substance. When a sample is undergoing a phase change, it absorbs or releases heat without a change in temperature, so when we talk about a temperature change, we are considering only cases where the phase doesn’t change. One of the most important facts about physical changes of matter is this (and it will bear repeating):
When a substance absorbs or releases heat, one of two things can happen: either its temperature changes or it will undergo a phase change but not both at the same time.
The amount of heat absorbed or released by a sample is proportional to its change in temperature. The constant of proportionality is called the substance’s heat capacity, C, which is the product of its specific heat, c, and its mass, m; that is, C = mc. We can write the equation q = C∆T in this more explicit form:
q = mc∆T
where
q = heat added to (or released by) a sample
m = mass of the sample
c = specific heat of the substance
∆T = temperature change
A substance’s specific heat is an intrinsic property of that substance and tells us how resistant it is to changing its temperature. For example, the specific heat of liquid water is 1 calorie per gram-°C. (This is actually the definition of a calorie: the amount of heat required to raise the temperature of 1 gram of water by 1°C.) The specific heat of copper, however, is much less: 0.09 cal/g-°C. So, if we had a 1 g sample of water and a 1 g sample of copper and each absorbed 10 calories of heat, the resulting changes in the temperatures would be
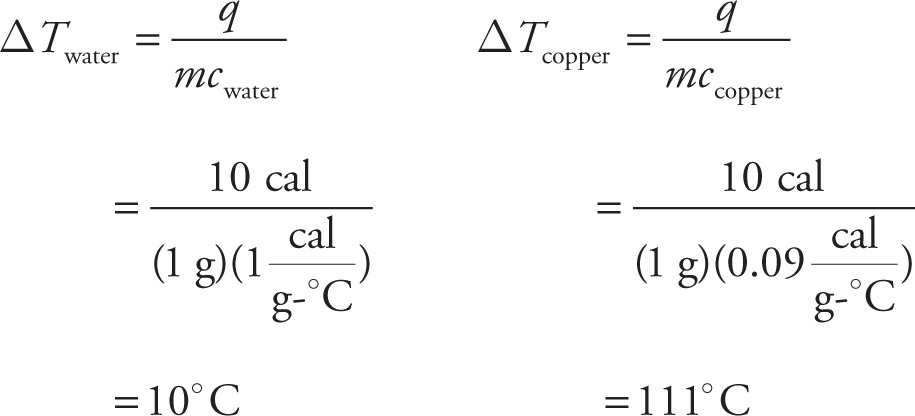
That’s a big difference! So, while it’s true that the temperature change is proportional to the heat absorbed, it’s inversely proportional to the substance’s heat capacity. A substance like water, with a relatively high specific heat, will undergo a smaller change in temperature than a substance (like copper) with a lower specific heat.
A few notes:
1) The specific heat of a substance also depends upon phase. For example, the specific heat of ice is different from that of liquid water.
2) The SI unit for energy is the joule, not the calorie. You may see specific heats (and heat capacities) given in terms of joules rather than calories. Remember, the conversion between joules and calories is: 1 cal ≈ 4.2 J.
3) Specific heats may also be given in terms of kelvins rather than degrees Celsius; that is, you may see the specific heat of water, say, given as 4.2 J/g K rather than 4.2 J/g°C. However, since the size of a Celsius degree is the same as a Kelvin (that is, if two temperatures differ by 1°C, they also differ by 1K), the numerical value of the specific heat won’t be any different if kelvins are used.
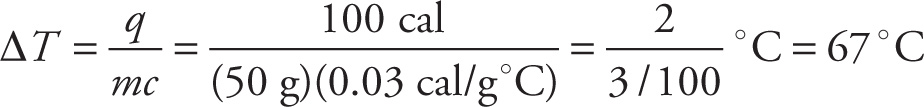
Example 7-4: The specific heat of tungsten is 0.03 cal/g-°C. If a 50-gram sample of tungsten absorbs 100 calories of heat, what will be the change in temperature of the sample?
Solution: From the equation q = mc∆T, we find that
Example 7-5: Equal amounts of heat are absorbed by 10 g solid samples of four different metals, aluminum, lead, tin, and iron. Of the four, which will exhibit the smallest change in temperature?
A) Aluminum (specific heat = 0.9 J/g-K)
B) Lead (specific heat = 0.13 J/g-K)
C) Tin (specific heat = 0.23 J/g-K)
D) Iron (specific heat = 0.45 J/g-K)
Solution: Since q and m are constant, ∆T is inversely proportional to c. So, the substance with the greatest specific heat will undergo the smallest change in temperature. Of the metals listed, aluminum (choice A) has the greatest specific heat.
Example 7-6: A researcher attempts to determine the specific heat of a substance by gradually heating a sample of it over time and measuring the temperature change. His first trial fails because it produces no significant change in temperature. Which changes to his experimental procedure would be most effective in producing a larger temperature change in his second trial?
A) Increasing the mass of the sample and increasing the heat input
B) Increasing the mass of the sample and decreasing the heat input
C) Decreasing the mass of the sample and increasing the heat input
D) Decreasing the mass of the sample and decreasing the heat input
Solution: Since ∆T = q/mc, to increase ∆T, the researcher should increase q and decrease m. (Intuitively, adding more heat to a smaller sample should result in a greater temperature increase.) Therefore, the answer is C.
Example 7-7: Molecules that experience strong intermolecular forces tend to have high specific heats. Of the following molecules, which one is likely to have the highest specific heat?
A) CH4
B) (CH3)4Si
C) CO
D) CH3OH
Solution: We’re looking for the molecule with the strongest intermolecular forces. Choices A and B are eliminated because these are nonpolar molecules that only experience weak London dispersion forces. Methanol (choice D) is a better choice than carbon monoxide (choice C), because methanol will experience hydrogen bonding while carbon monoxide experiences only weak dipole forces. Therefore, choice D is the answer.
7.4 PHASE TRANSITION DIAGRAM
Let’s consider the complete range of phase changes from solid to liquid to gas. The process in this direction requires the input of heat. As heat is added to the solid, its temperature increases until it reaches its melting point. At that point, absorbed heat is used to change the phase to liquid, not to increase the temperature. Once the sample has been completely melted, additional heat again causes its temperature to rise, until the boiling point is reached. At that point, absorbed heat is used to change the phase to gas, not to increase the temperature. Once the sample has been completely vaporized, additional heat again causes its temperature to rise. We can summarize all this with a phase transition diagram, which plots the temperature of the sample versus the amount of heat absorbed. The figure below is a typical phase transition diagram.
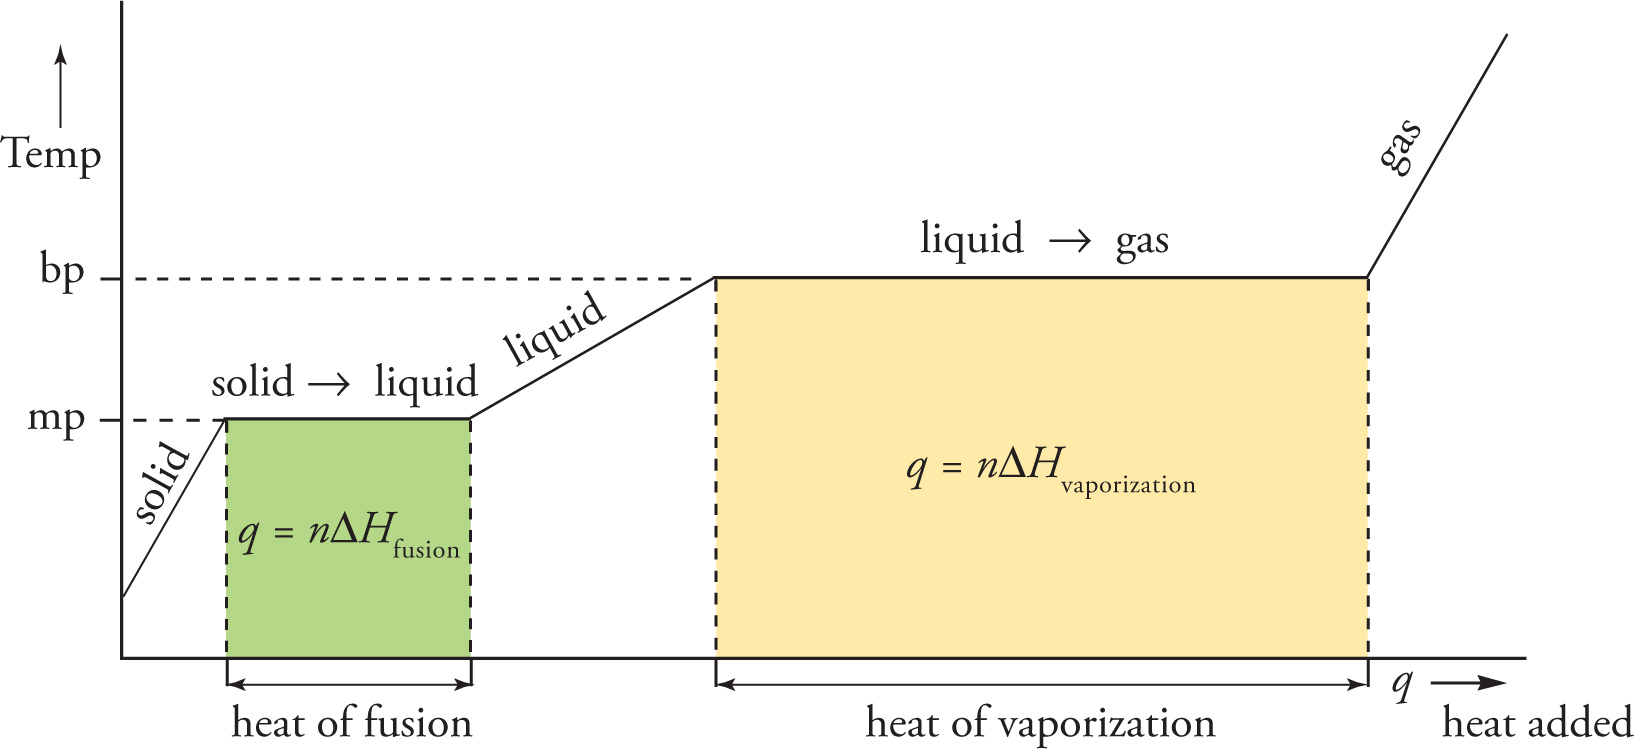
The horizontal axis represents the amount of heat added, and the vertical axis is the corresponding temperature of the substance. Notice the flat lines when the substance reaches its melting point (mp) and boiling point (bp). During a phase transition, the temperature of the substance does not change. Also, the greater the value for the heat of transition, the longer the flat line. A substance’s heat of vaporization is always greater than its heat of fusion. The sloped lines show how the temperature changes (within a phase) as heat is added. Since ∆T = q/C, the slopes of the non-flat lines are equal to 1/C, the reciprocal of the substance’s heat capacity in that phase.
Example 7-8: How much heat (in calories) is necessary to raise the temperature of 2 g of solid H2O from 0°C to 85°C? (Note: Heat of fusion for water = 80 cal/g and the specific heat of water is 1 cal/g-°C.)
A) 85 cal
B) 165 cal
C) 170 cal
D) 330 cal
Solution: There are two steps here: (1) melt the ice at 0°C to liquid water at 0°C, and (2) heat the water from 0°C to 85°C.
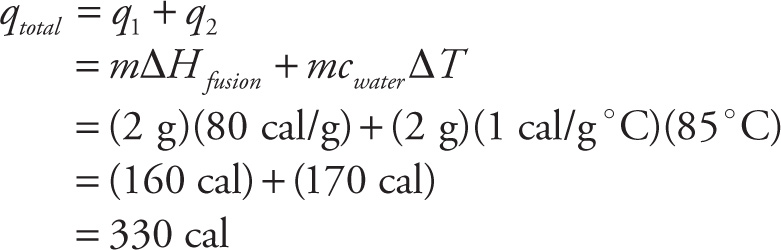
The correct answer is D.
Example 7-9: Given that each of the following solutions is at equilibrium with its environment, which solution should have the lowest temperature at 1 atm?
A) A solution that is 1% ice and 99% liquid water
B) A solution that is 50% ice and 50% liquid water
C) A solution that is 99% ice and 1% liquid water
D) All these solutions will have the same temperature
Solution: As long as there is any amount of ice and liquid water coexisting at equilibrium, the temperature must be 0°C at 1 atm. Therefore, D is the answer.
Phase Diagrams
The phase of a substance doesn’t depend just on the temperature, it also depends on the pressure. For example, even at high temperatures, a substance can be squeezed into the liquid phase if the pressure is high enough, and at low temperature, a substance can enter the gas phase if that pressure is low enough. A substance’s phase diagram shows how its phases are determined by temperature and pressure. The figure below is a generic example of a phase diagram.
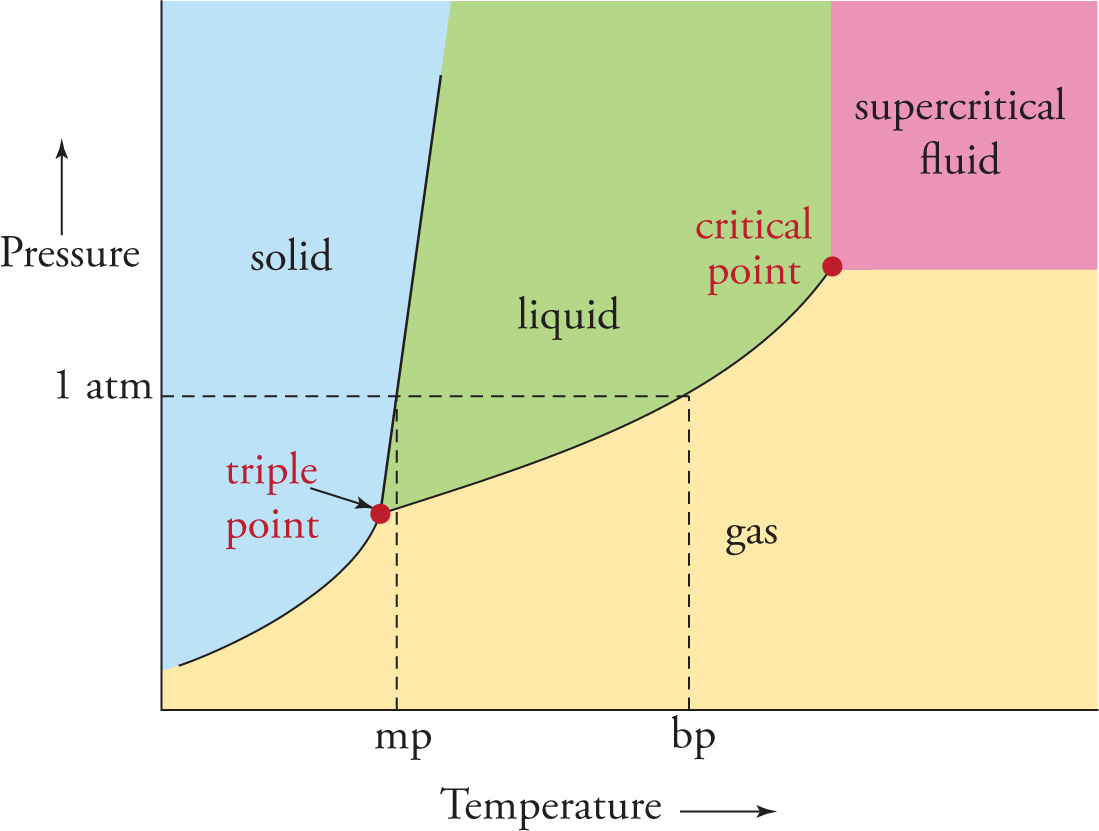
The boundary lines between phases represent points at which the two phases are in equilibrium. For example, a glass of liquid water at 0°C containing ice cubes is a two-phase system, and if its temperature and pressure were plotted in a phase diagram, it would be on the solid-liquid boundary line. Crossing a boundary line implies a phase transition. Notice that the solid phase is favored at low temperatures and high pressures, while the gas phase is favored at high temperatures and low pressures.
If we draw a horizontal line at the “1 atm” pressure level, the temperature at the point where this line crosses the solid-liquid boundary is the substance’s normal melting point, and the temperature at the point where the line crosses the liquid-gas boundary is the normal boiling point.
The triple point is the temperature and pressure at which all three phases exist simultaneously in equilibrium.
The critical point marks the end of the liquid-gas boundary. Beyond this point, the substance displays properties of both a liquid (such as high density) and a gas (such as low viscosity). If a substance is in this state—where the liquid and gas phases are no longer distinct—it’s called a supercritical fluid, and no amount of increased pressure can force the substance back into its liquid phase.
The Phase Diagram for Water
Water is the most common of a handful of substances that are denser in the liquid phase than in the solid phase. As a result, the solid-liquid boundary line in the phase diagram for water has a slightly negative slope, as opposed to the usual positive slope for most other substances. Compare these diagrams:
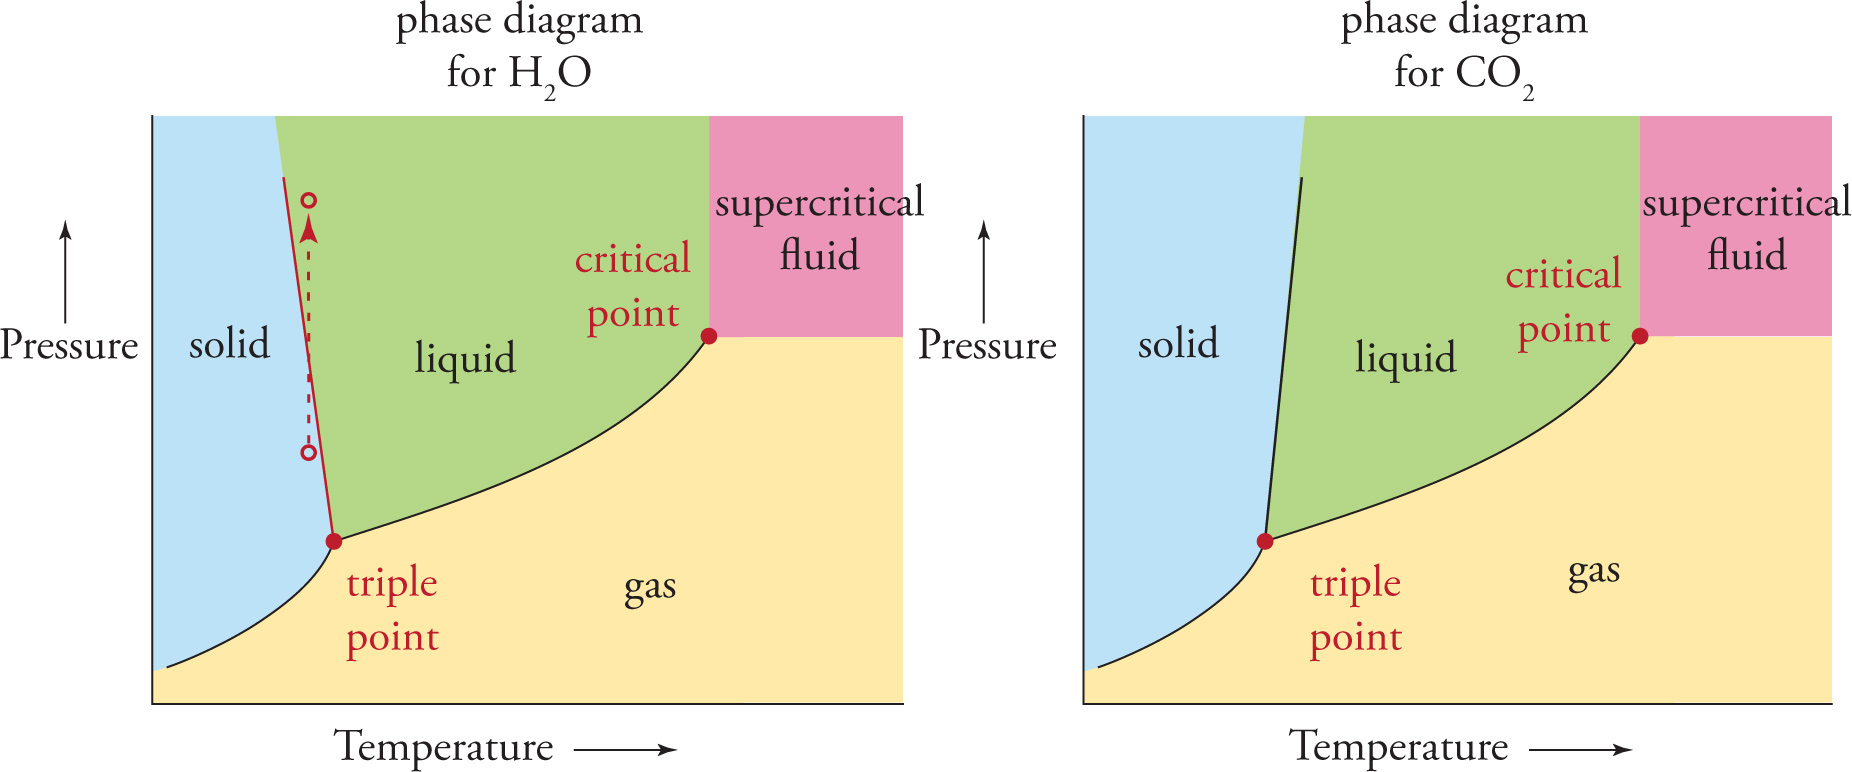
For H2O, an increase in pressure at constant temperature can favor the liquid phase, not the solid phase as would be the case for most other substances (like CO2, for example). You are probably already familiar with the following phenomenon: as the blade of an ice skate bearing all of the weight of the skater contacts the ice, the pressure increases, melting the ice under the blade and allowing the skate to glide over the liquid water. (The dashed arrow in the phase diagram for water above depicts this effect.) As the skater moves across the ice, each blade continually generates a thin layer of liquid water that refreezes as the blade passes. (This is also the reason why glaciers move.) The properties of CO2 don’t allow for skating because solid CO2 will never turn to liquid when the pressure is increased. (And now you know why solid CO2 is called dry ice!)
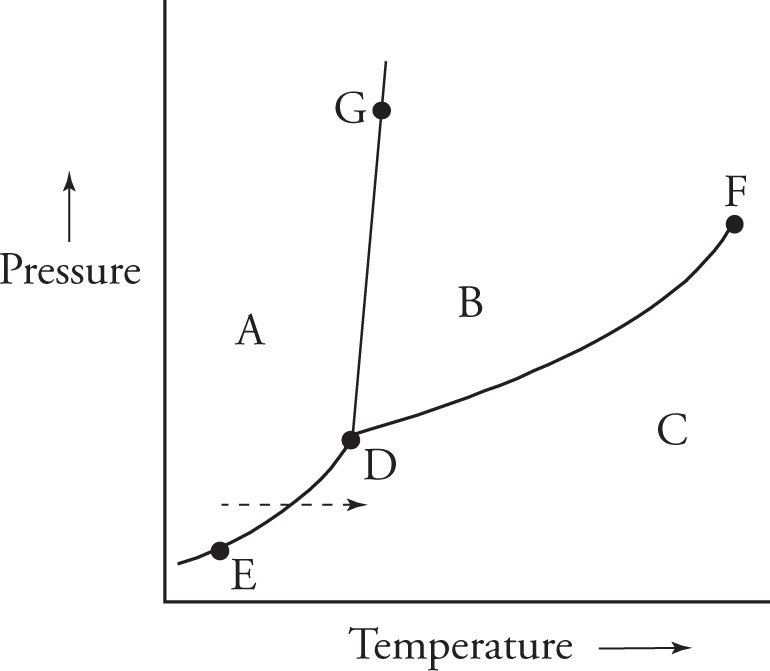
Example 7-10: In which region of the diagram above is the substance in the gas phase?
A) A
B) B
C) C
D) G
Solution: The gas phase is favored at high temperatures and low pressure, so we know that region C represents the gas phase.
Example 7-11: In which part of the diagram is gas in equilibrium with liquid?
A) Along line ED
B) Along line DG
C) Along line DF
D) In region B
Solution: The liquid phase is represented by region B and the gas phase by region C. Therefore, an equilibrium between liquid and gas phases is represented by a point on the boundary between regions B and C. This boundary is the “line” DF, choice C.
Example 7-12: The dashed arrow in the diagram indicates what type of phase transition?
A) Evaporation
B) Crystallization
C) Deposition
D) Sublimation
Solution: The arrow shows a substance in the solid phase (region A) moving directly to the gaseous phase (region C) without melting first. The phase transition from solid to gas is called sublimation, choice D.
Chapter 7 Summary
• Changes in pressure and/or temperature of a substance can induce changes in phase.
• The three important phases are (in order of low-to-high entropy and low-to-high internal energy) solid, liquid, and gas.
• Specific heat (c) is an intrinsic property that defines how resistant a substance is to temperature change.
• The change in temperature associated with the input or extraction of heat when phase is uncharged is given by q = mc∆T, where c is the specific heat of a substance and m is the amount (either mass or moles, depending on c).
• Heat capacity (C) is given by C = mc, where m is the mass of the sample. Heat capacity is a proportionality constant that defines how much heat is required to change the temperature of a sample by 1°C.
• A substance cannot simultaneously undergo a phase change and a temperature change.
• The heat associated with a phase change is given by q = n∆Hphase change, where n is the number of moles of substance (or mass if ∆H is given in energy/mass).
• Lines on a phase diagram correspond to equilibria between phases and phase transitions. The intersection of all three lines on a phase diagram is known as the triple point, and represents equilibrium between all three phases.
• The phase diagram of water is unique in that its solid/liquid equilibrium line has a negative slope. This accounts for the fact that ice melts under increased pressure, and why the density of ice is less than that of liquid water.
CHAPTER 7 FREESTANDING PRACTICE QUESTIONS
1. Which of the following correctly describe(s) the physical properties of water?
I. The hydrogen bonds in water result in a lower boiling point than H2S.
II. Water has a high specific heat due to the hydrogen bonding between molecules.
III. As pressure increases liquid water is favored over solid water.
A) II only
B) III only
C) II and III only
D) I, II and III
2. As a substance goes from the gas phase to the solid phase, heat is:
A) absorbed, internal energy decreases, and entropy decreases.
B) released, internal energy increases, and entropy decreases.
C) released, internal energy decreases, and entropy decreases.
D) released, internal energy decreases, and entropy increases.
3. In the following phase transition diagram, Substance X is in the solid phase during Segment A and in the gas phase during Segment C. What process is occurring during Segment B?
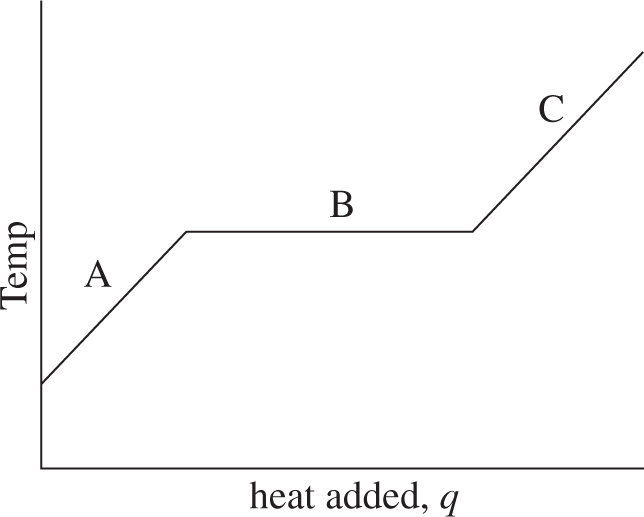
A) The substance is warming.
B) The substance is cooling.
C) Sublimation
D) Condensation
4. Denver is at a higher altitude than Los Angeles and therefore the atmospheric pressure is lower in Denver than in Los Angeles. Compared to Los Angeles, the melting point of water in Denver will be:
A) higher.
B) lower.
C) the same.
D) undetermined from the information given.
5. At 1 atm, deionized water can remain a liquid at temperatures down to —42°C. If a foreign body is added to the supercooled liquid, it will immediately turn into ice. Which of the following is true about this process?
A) The reaction is exothermic.
B) Tap water could also be supercooled to —42°C.
C) The transformation of a supercooled fluid to a solid is nonspontaneous.
D) Water’s unique phase diagram allows it to be supercooled.
6. A pot containing 0.5 L of water at sea level is brought to 100°C. It is insulated around its sides to minimize heat loss to the environment, and heat is applied at the bottom of the container at a rate of 6 kJ/min over 3 minutes. What is the resulting temperature of the water? (∆Hvap = 40.7 kJ/kg; c(g) = 1.9 kJ/kg • °C; c(l) = 4.2 kJ/kg • °C)
A) 115°C
B) 108°C
C) 104°C
D) 100°C
CHAPTER 7 PRACTICE PASSAGE
Lyophilization, or freeze drying, is a technique used to remove water from samples. Lyophilization uses sublimation to convert frozen, solid water directly to water vapor. This technique offers advantages over liquid-solvent removal techniques in that it can be performed at low temperatures, resulting in minimal damage to heat-sensitive samples.
A chamber containing the sample solution is attached to the lyophilizer, which freezes the sample at a temperature less than 0°C and then applies a vacuum, generally holding a pressure less than 0.006 atm. Under these conditions the frozen water sublimes and water vapor is pulled from the sample chamber into a condenser held at −50°C, where it is refrozen and held immobile.
The phase diagram for water is shown below, with its unique negatively sloped equilibrium line between the solid and liquid phase. At low pressures the solid phase of water is favored as long as any solute in the water is reasonably dilute. However, the freezing point of water decreases as the concentration of solute is increased. If concentrated enough, the sample can melt instead of sublime when pressure is decreased. In addition, volatile solvents often cannot be removed from the chamber by the condenser as their freezing point at low pressures is below −50°C. Volatile solvents remaining in the gaseous environment can compound the impurity of the remaining water, favoring the liquid phase even more.
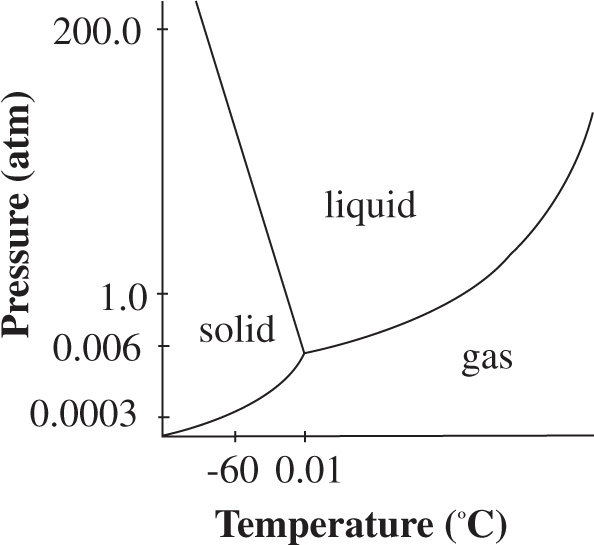
Figure 1 Phase diagram of water
1. The addition of which of the following substances is most likely to result in the melting of a sample during lyophilization?
A) (CH3)2CHOH
B) CH3CH2COOH
C) CH3CH2OCH2CH3
D) CH3(CH2)4OH
2. If the temperature inside the chamber is −60°C, what pressure must the chamber be at in order for the sublimation reaction to be at equilibrium?
A) 3 × 10⁻⁴ atm
B) 3 × 10⁻³ atm
C) 1 atm
D) 125 atm
3. Lyophilization would most likely be employed industrially in which of the following separations?
A) Salicylic acid dissolved in methanol
B) An enzyme in aqueous solution
C) NaCl in water
D) A small molecular drug dissolved in dichloromethane
4. Sublimation of water inside the sample chamber causes the temperature of the chamber to:
A) increase.
B) decrease.
C) stay the same.
D) change in a manner dependent on the identity of the solvent.
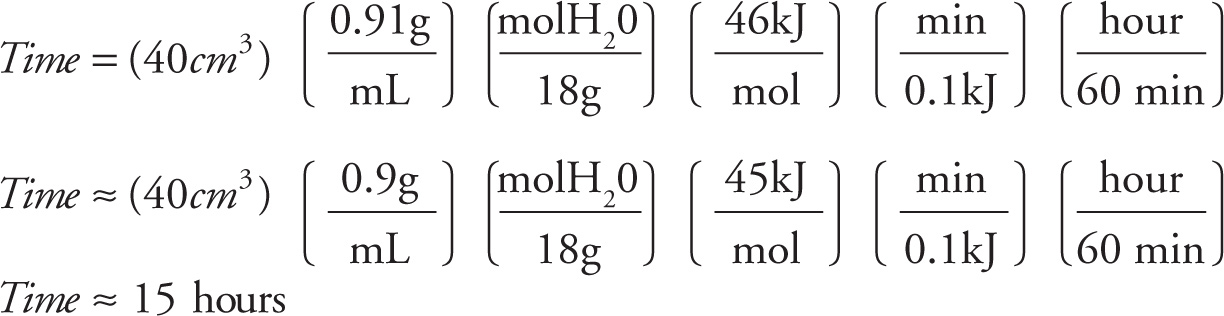
5. The heat of sublimation of water is 46 kJ/mol. If heat is transferred to the sample by the environment at a rate of 0.1 kJ/min, approximately how long will it take to lyophilize 40 cm3 of frozen water (density = 0.91 g/mL) ?
A) 7.7 hours
B) 15.3 hours
C) 77.0 hours
D) 153.0 hours
SOLUTIONS TO CHAPTER 7 FREESTANDING PRACTICE QUESTIONS
1. C Since water experiences hydrogen bonding, more energy is required to boil water compared with SH2, which leads to a higher boiling point, making Item I false and eliminating choice D. Since temperature is a measure of molecular motion, and hydrogen bonds bind molecules together, making this motion more difficult, hydrogen-bonded materials will require more energy to increase T and thus have high specific heats. Item II is true and choice B can be eliminated. The negative slope of the line between the solid and liquid phase on the phase diagram of water indicates that at higher pressures, liquid water is favored over solid, making Item III correct and C the best answer choice.
2. C As a substance undergoes deposition, it becomes a much more ordered substance, decreasing entropy (eliminate choice D). In addition, heat will be released (eliminate choice A) because the potential energy of the substance decreases (eliminate choice B).
3. C Substance X is changing from a solid to a gas during Segment B. This is an example of sublimation. Note that choices A and B cannot be correct answer choices because the temperature of Substance X remains constant during Segment B. Condensation occurs when a gas becomes a liquid, so choice D is eliminated.
4. A On a P vs. T phase diagram of water, the solid-liquid equilibrium line has a negative slope for water. Water’s melting point increases with decreasing external pressure. Therefore, in Denver the melting point of water is higher than in Los Angeles.
5. A Upon nucleation with a foreign body, supercooled water will transition from liquid to solid phase. This phase transition (crystallization) requires heat to be released since intermolecular interactions are formed. Choice B is eliminated because tap water contains many dissolved particles that can serve as sites of nucleation. Choice C is incorrect because the supercooled fluids are only kinetically stabilized against freezing, and their transformation to a solid form is thermodynamically spontaneous. Since pressure remains constant, the negative sloped solid-liquid equilibrium line in water’s phase diagram does not play a role in supercooling, eliminating Choice D.
6. D The addition of 6 kJ/min for three minutes imparts 18 kJ of heat to the sample. However, since the ∆Hvap of water is 40.7 kJ/mol, and 0.5 L is roughly 22 mol (1 L of H2O ≈ 55 mol), there is nowhere near enough heat provided to vaporize the entire sample. As such all the heat given to the sample is going toward vaporization and not toward increasing temperature. The temperature will remain constant at 100°C.
SOLUTIONS TO CHAPTER 7 PRACTICE PASSAGE
1. C The passage states that volatile chemicals cannot be used in samples subjected to lyophilization because they will hinder sublimation and favor the liquid phase through melting. This is because these compounds have a high vapor pressure and cannot be removed from the system by the condenser. Choices A, B, and D are all hydrogen donors and acceptors. Choice C, diethyl ether, can only act as a hydrogen bond acceptor. Therefore, it has the weakest intermolecular forces and is the most volatile.
2. A On a P vs. T diagram, sublimation equilibrium is indicated by the line separating the solid and vapor phases. On the graph in Figure 1, it is shown that at −60°C, the solid/gas line is at P = 0.0003 or 3 × 10⁻⁴ atm.
3. B Both dichloromethane and methanol are removed as liquids at reasonably low temperatures and have freezing points far lower than water. This eliminates choices A and D. The passage states that one of the major advantages to lyophilization is that it can be performed at low temperatures, and therefore preserve the activity of heat-sensitive samples. NaCl is a salt that is stable at high temperatures, whereas enzymes are proteins that denature at high temperatures. Therefore, lyophilization is best suited as a means to remove water from aqueous protein solutions.
4. B Sublimation is an endothermic reaction, requiring heat input. As this reaction removes heat from the surroundings, it lowers the temperature of the surroundings, in this case, the reaction chamber. This is very similar to sweat cooling the body as it evaporates off of the skin (also an endothermic process).
5. B 40 cm3 of ice is 36 g or 2 moles of water. The heat required to sublimate this sample is 46 kJ/mol(2 mol) = 92 kJ. If heat is transferred at 0.1 kJ/min, then 920 minutes are required. Dividing 920 min by 60 min/hour gives just over 15 hours. Overall: