MCAT General Chemistry Review - Alexander Stone Macnow, MD 2019-2020
Acids and Bases
Titration and Buffers
LEARNING GOALS
After Chapter 10.4, you will be able to:
· Select an appropriate indicator for a given acid—base reaction
· Explain the purpose of a buffer solution
· Identify the pH range of the equivalence point for different combinations of acids and bases, for example, weak acid + weak base
· Calculate the pH or pOH of a known solution
· Identify the buffering region, half-equivalence point, equivalence point, and endpoint of a titration reaction:
Titration is a procedure used to determine the concentration of a known reactant in a solution. There are different types of titrations, including acid—base, oxidation—reduction, and complexometric (metal ion). The MCAT frequently tests the first two types. Complexometric (metal ion) titrations are outside the scope of the MCAT but focus on formation of complex ions, as described in Chapter 9 of MCAT General Chemistry Review.
GENERAL PRINCIPLES
Titrations are performed by adding small volumes of a solution of known concentration (the titrant) to a known volume of a solution of unknown concentration (the titrand) until completion of the reaction is achieved at the equivalence point.
Acid—Base Equivalence Points
In acid—base titrations, the equivalence point is reached when the number of acid equivalents present in the original solution equals the number of base equivalents added, or vice-versa. It is important to emphasize that, while a strong acid/strong base titration will have its equivalence point at a pH of 7, the equivalence point does not always occur at pH 7. When titrating polyprotic acids or bases (discussed later in this chapter), there are multiple equivalence points, as each acidic or basic conjugate species is titrated separately. This is shown in the speciation plot in Figure 10.8.
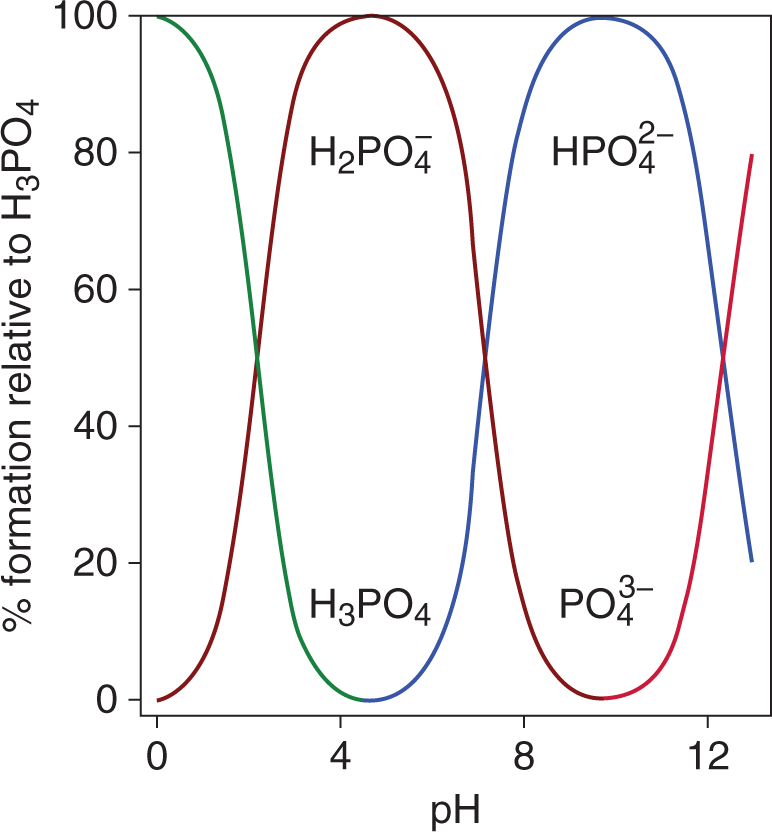 Figure 10.8. Speciation Plot of Phosphoric AcidAt any given pH, only two forms of the acid exist in solution; thus, each conjugate is titrated separately.
At the equivalence point, the number of equivalents of acid and base are equal. This fact allows us to calculate the unknown concentration of the titrand through the equation:
NaVa = NbVb
Equation 10.8
where Na and Nb are the acid and base normalities, respectively, and Va and Vb are the volumes of acid and base solutions, respectively. Note that, as long as both volumes use the same units, the units used do not have to be liters.
The equivalence point in an acid—base titration is determined in two common ways: evaluated by using a graphical method, plotting the pH of the unknown solution as a function of added titrant by using a pH meter, or estimated by watching for a color change of an added indicator.
Indicators
Indicators are weak organic acids or bases that have different colors in their protonated and deprotonated states. This small structural change—the binding or release of a proton—leads to a change in the absorption spectrum of the molecule, which we perceive as a color change. Indicators are generally vibrant and can be used in low concentrations without significantly altering the equivalence point. The indicator must always be a weaker acid or base than the acid or base being titrated; otherwise, the indicator would be titrated first! The point at which the indicator changes to its final color is not the equivalence point but rather the endpoint. If the indicator is chosen correctly and the titration is performed well, the volume difference between the endpoint and the equivalence point is negligible and may be corrected for or simply ignored.
Key Concept
Indicators change color as they shift between their conjugate acid and base forms:
![]()
Because this is an equilibrium process, we can apply Le Châtelier’s principle. Adding H+ shifts the equilibrium to the left. Adding OH− removes H+ and therefore shifts the equilibrium to the right.
Acid—base titrations can be performed for different combinations of strong and weak acids and bases. The most useful combinations involve at least one strong species. Weak acid/weak base titrations can be done but are not very accurate and therefore are rarely performed. The pH curve for the titration of a weak acid and weak base lacks the sharp change that normally indicates the equivalence point. Furthermore, indicators are less useful because the pH change is far more gradual.
MCAT Expertise
Any question involving the selection of an ideal indicator will require you to know what the pH of the reaction at the equivalence point will be, whether graphically or mathematically. Once you have determined where the equivalence point is, select the indicator that has the closest pKa value to it.
STRONG ACID AND STRONG BASE
Let’s consider the titration of 10 mL of a 0.1 N solution of HCl with a 0.1 N solution of NaOH. Plotting the pH of the solution vs. the quantity of NaOH added gives the curve shown in Figure 10.9.
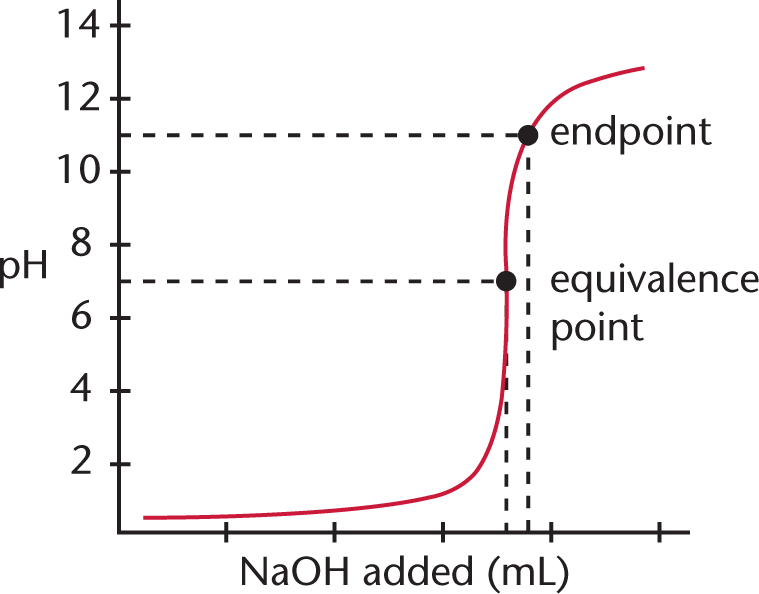 Figure 10.9. Monoprotic Strong Acid and Strong Base Titration CurveA strong base, NaOH, is titrated into a solution of strong acid, HCl, to yield an equivalence point of pH = 7.
Key Concept
Compare the relative strength of the two solutions in a titration to determine if the pH of the equivalence point is less than, equal to, or greater than 7:
· Strong acid + weak base: equivalence point pH < 7
· Strong acid + strong base: equivalence point pH = 7
· Weak acid + strong base: equivalence point pH > 7
Because HCl is a strong acid and NaOH is a strong base, the equivalence point of the titration will be at pH 7, and the solution will be neutral. Note that the endpoint shown is close to, but not exactly equal to, the equivalence point; selection of a better indicator, one that changes colors at, say, pH 8, would have given a better approximation. Still, the amount of error introduced by the use of an indicator that changes color around pH 11 rather than pH 8 is not especially significant; it represents a mere fraction of a milliliter of excess NaOH solution.
In the early part of the curve when little base has been added, the acidic species predominates, so the addition of small amounts of base will not appreciably change either the [OH−] or the pH. Similarly, in the last part of the titration curve when an excess of base has been added, the addition of small amounts of base will not change the [OH−] significantly, and the pH will remain relatively constant. The addition of base will alter the concentrations of H+ and OH− near the equivalence point, and will elicit the most substantial changes in pH in that region. Remember: the equivalence point for strong acid/strong base titrations is always at pH 7 (for monovalent species).
If one uses a pH meter to chart the change in pH as a function of volume of titrant added, a good approximation can be made of the equivalence point by locating the midpoint of the region of the curve with the steepest slope.
WEAK ACID AND STRONG BASE
Titration of a weak acid, such as CH3COOH, with a strong base, such as NaOH, produces the titration curve shown in Figure 10.10.
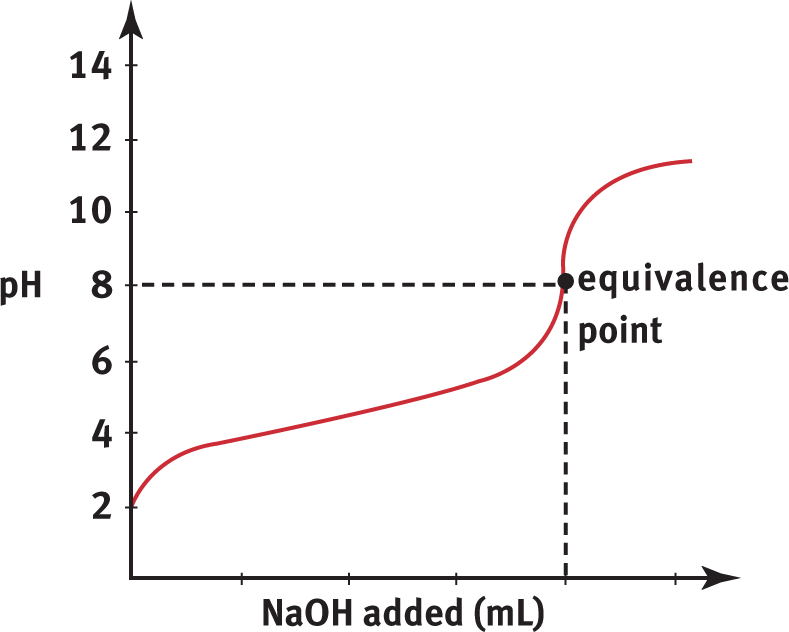 Figure 10.10. Weak Acid and Strong Base Titration CurveA strong base, NaOH, is titrated into a solution of weak acid, CH3COOH, to yield an equivalence point of pH > 7.
Compare Figure 10.10 with the curve in Figure 10.9. The first difference is that the initial pH of the weak acid solution is greater than the initial pH of the strong acid solution. Weak acids do not dissociate to the same degree that strong acids do; therefore, the concentration of H3O+ will generally be lower (and pH will be higher) in an equimolar solution of weak acid. The second difference is the shapes of the curves. The pH curve for the strong acid/strong base titration shows a steeper, more sudden rise in pH at the equivalence point. In the weak acid/strong base titration, the pH changes gradually early on in the titration and has a less sudden rise at the equivalence point. The third difference is the position of the equivalence point. While the equivalence point for a strong acid/strong base titration is pH 7, the equivalence point for a weak acid/strong base titration is above 7. This is because the reaction between the weak acid (HA) and strong base (OH−) produces a weak conjugate base (A−) and even weaker conjugate acid (H2O). This produces a greater concentration of hydroxide ions than hydrogen ions at equilibrium (due to the common ion effect on the autoionization of water). Therefore, the equivalence point for weak acid/strong base titration is always in the basic range of the pH scale.
STRONG ACID AND WEAK BASE
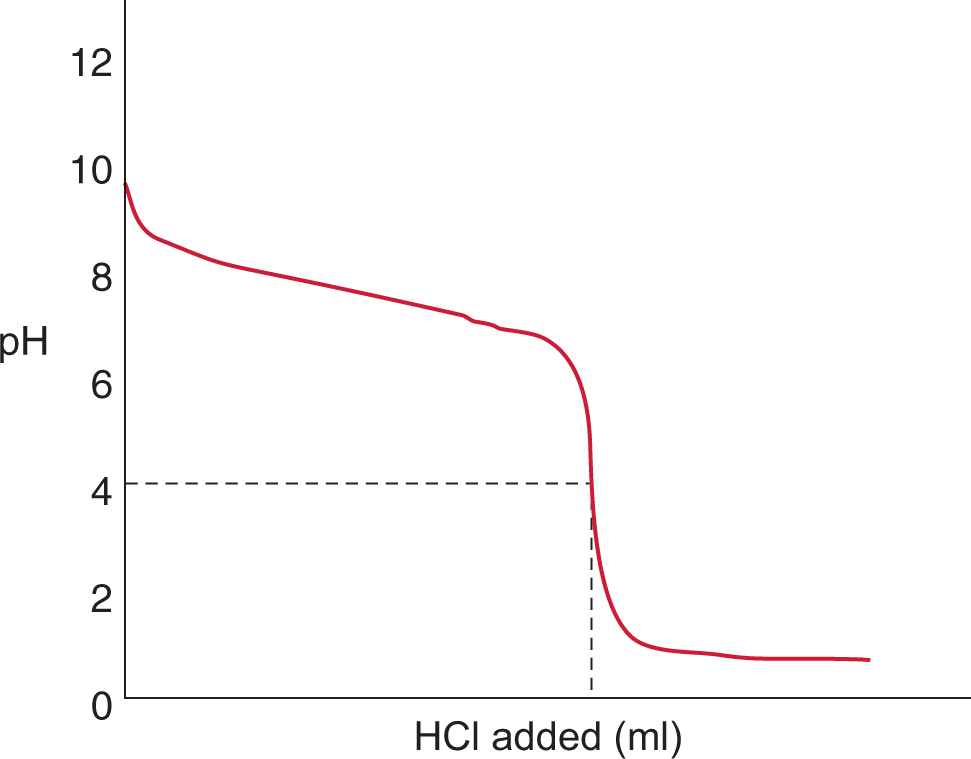
The appearance of the titration curve for a weak base titrand and strong acid titrant will look like an inversion of the curve for a weak acid titrand and strong base titrant. The initial pH will be in the basic range (typical range: pH 10—12) and will demonstrate a gradual drop in pH with the addition of strong acid. The equivalence point will be in the acidic pH range because the reaction between the weak base and strong acid will produce a weak conjugate acid and even weaker conjugate base, as shown in Figure 10.11. The stronger conjugate acid will result in an equilibrium state with a concentration of hydrogen ions greater than that of the hydroxide ions. Therefore, the equivalence point for a weak base/strong acid titration is always in the acidic range of the pH scale.
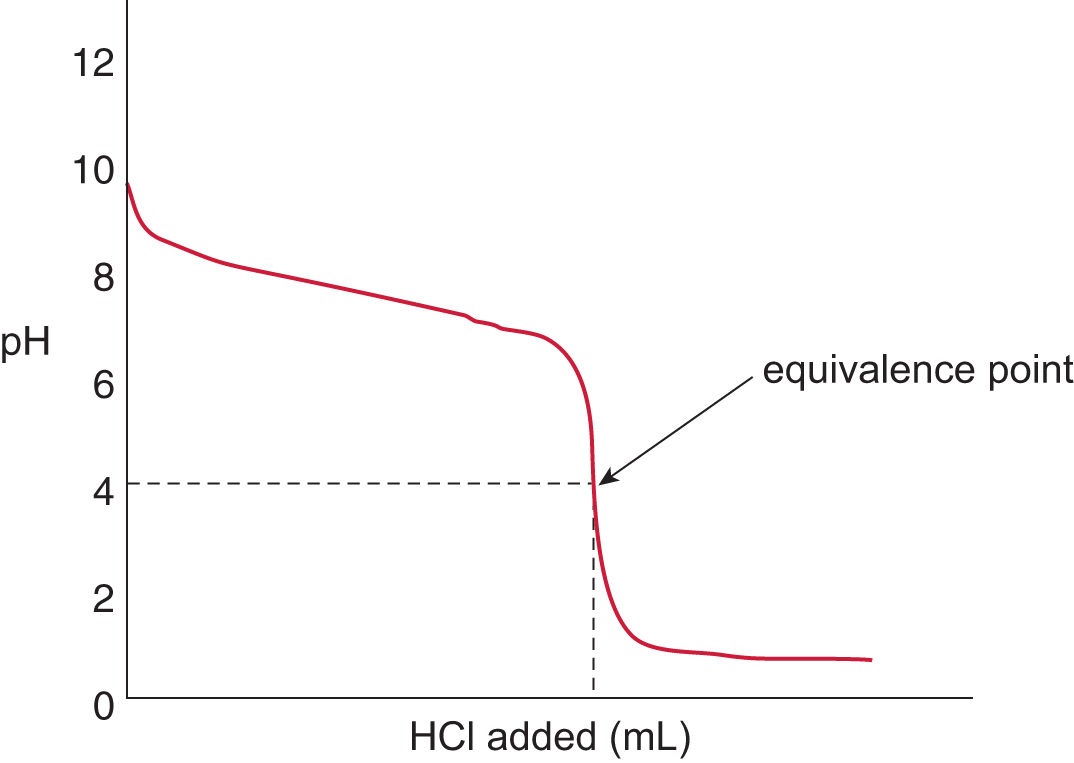 Figure 10.11. Strong Acid and Weak Base Titration CurveA strong acid, HCl, is titrated into a solution of weak base, NH3, to yield an equivalence point of pH < 7.
WEAK ACID AND WEAK BASE
The appearance of the titration curve for a weak base titrand and weak acid titrant will look like an intermediate of the previous types discussed. Because both the titrant and the titrand are weak, the initial pH is generally in the 3—11 range and will demonstrate a very shallow drop at the equivalence point. The equivalence point will be near neutral pH because the reaction is partially dissociative for both species.
MCAT Expertise
To identify which type of titration is being shown in a graph, identify the starting position in the graph (pH ≫ 7 = titrand is a strong base, > 7 (slightly) = weak base, < 7 (slightly) = weak acid, and ≪ 7 pH = strong acid), and determine where the equivalence point is. Think of titrations like tug-of-war: the stronger the acid or base, the more it pulls the equivalence point into its pH territory.
POLYVALENT ACIDS AND BASES
The titration curve for a polyvalent acid or base looks different from that for a monovalent acid or base. Figure 10.12 shows the titration of Na2CO3 with HCl, in which the divalent (diprotic) acid H2CO3 is the ultimate product.
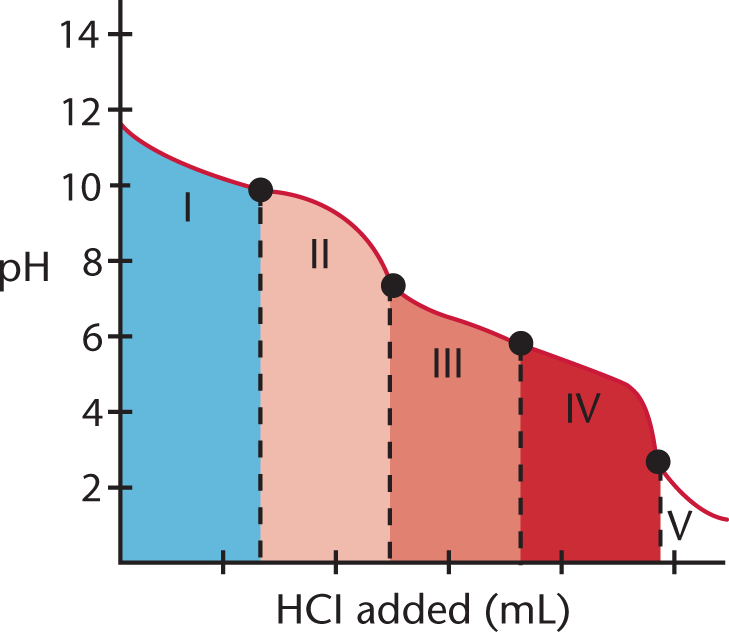 Figure 10.12. Polyvalent TitrationThe multiple equivalence points indicate that this is a polyvalent titration.
In region I, little acid has been added, and the predominant species is CO32−. In region II, more acid has been added, and the predominant species are CO32− and HCO3−, in relatively equal concentrations. The flat part of the curve is the first buffer region (discussed in the next section), corresponding to the pKa of HCO3− (Ka = 5.6 × 10⁻¹¹; pKa = 10.25). The center of the buffer region (the point between regions I and II) is sometimes termed the half-equivalence point because it occurs when half of a given species has been protonated (or deprotonated).
Region III begins with the equivalence point, at which all of the CO32− is finally titrated to HCO3−. As the curve illustrates, a rapid change in pH occurs at the equivalence point (the point between regions II and III). In the latter part of region III, the predominant species is HCO3−, although some H2CO3 has formed as well.
At the beginning of region IV, the acid has neutralized approximately half of the HCO3−, and now H2CO3 and HCO3− are in roughly equal concentrations. This flat region is the second buffer region (and second half-equivalence point, between regions III and IV) of the titration curve, corresponding to the pKa of H2CO3 (Ka = 4.3 × 10⁻⁷; pKa = 6.37). Region V starts with the second equivalence point, as all of the HCO3− is finally converted to H2CO3. Again, a rapid change in pH is observed near the equivalence point (the point between regions IV and V) as acid is added.
The titrations of the acidic and basic amino acids (which have acidic or basic side chains, respectively) will show curves similar to the one shown in Figure 10.12. But rather than two equivalence points, there will in fact be three: one corresponding to the titration of the carboxyl group and a second corresponding to the titration of the amino group, both of which are attached to the central carbon, as well as a third corresponding to either the acidic or basic side chain.
BUFFERS
A buffer solution consists of a mixture of a weak acid and its salt (which is composed of its conjugate base and a cation) or a mixture of a weak base and its salt (which is composed of its conjugate acid and an anion). Two examples of buffers that are common in the laboratory—and commonly tested on the MCAT—are a solution of acetic acid (CH3COOH) and its salt, sodium acetate (CH3COO−Na+), and a solution of ammonia (NH3) and its salt, ammonium chloride (NH4+Cl−). The acetic acid/sodium acetate solution is considered an acid buffer, and the ammonium chloride/ammonia solution is a base buffer. Buffer solutions have the useful property of resisting changes in pH when small amounts of acid or base are added. Consider a buffer solution of acetic acid and sodium acetate: (Note: The sodium ion has not been included because it is not involved in the acid—base reaction.)
CH3COOH (aq) + H2O (l) ⇌ H3O+ (aq) + CH3COO− (aq)
When a small amount of strong base, such as NaOH, is added to the buffer, the OH− ions from the NaOH react with the H3O+ ions present in the solution; subsequently, more acetic acid dissociates (the system shifts to the right), restoring the [H3O+]. The weak acid component of the buffer thereby serves to neutralize the strong base that has been added. The resulting increase in the concentration of the acetate ion (the conjugate base) does not create nearly as large an increase in hydroxide ions as the unbuffered NaOH would. Thus, the addition of the strong base does not result in a significant increase in [OH−] and does not appreciably change the pH.
Likewise, when a small amount of HCl is added to the buffer, H+ ions from the HCl react with the acetate ions to form acetic acid. Acetic acid is weaker than the added hydrochloric acid (which has been neutralized by the acetate ions), so the increased concentration of acetic acid does not significantly contribute to the hydrogen ion concentration in the solution. Because the buffer maintains [H+] at approximately constant values, the pH of the solution is relatively unchanged.
The Bicarbonate Buffer System
In the human body, one of the most important buffers is the H2CO3/HCO3− conjugate pair in the plasma component of the blood, called the bicarbonate buffer system. Specifically, carbonic acid (H2CO3) and its conjugate base, bicarbonate (HCO3−), form a weak acid buffer for maintaining the pH of the blood within a fairly narrow physiological range. CO2 (g), one of the waste products of cellular respiration, also has low solubility in aqueous solutions. The majority of the CO2 transported from peripheral tissues to the lungs (where it will be exhaled out) is dissolved in the plasma in a “disguised” form through the bicarbonate buffer system. CO2 (g) and water react in the following manner:
CO2 (g) + H2O (l) ⇌ H2CO3 (aq) ⇌ H+ (aq) + HCO3− (aq)
Real World
A number of conditions can affect the delicate pH balance of tissues in the body, including chronic obstructive pulmonary disease (COPD), renal tubular acidosis (RTA), diabetic ketoacidosis (DKA), lactic acidosis, metabolic diseases, poisonings and ingestions, and hyperventilation. The buffer system must be well maintained to mitigate these changes.
The bicarbonate buffer system is tied to the respiratory system. In conditions of metabolic acidosis (production of excess plasma H+ not caused by the respiratory system itself), the breathing rate will increase to compensate and blow off a greater amount of carbon dioxide gas; this causes the system to shift to the left, thereby reducing [H+] and buffering against dramatic and dangerous changes to the blood pH. It is interesting to note that the bicarbonate buffer system (pKa = 6.37) maintains a pH around 7.4, which is actually slightly outside the optimal buffering capacity of the system. Buffers have a narrow range of optimal activity (pKa ± 1). This actually makes sense—it is far more common for acidemia (too much acid in the blood) to occur than alkalemia (too much base in the blood). As acidemia becomes more severe, the buffer system actually becomes more effective and more resistant to further lowering of the pH.
The Henderson—Hasselbalch Equation
The Henderson—Hasselbalch equation is used to estimate the pH or pOH of a buffer solution. For a weak acid buffer solution:

Equation 10.9
where [A−] is the concentration of the conjugate base and [HA] is the concentration of the weak acid. Note that when [conjugate base] = [weak acid], the pH = pKa because log (1) = 0. This occurs at the half-equivalence points in a titration, and buffering capacity is optimal at this pH.
Likewise, for a weak base buffer solution:

Equation 10.10
where [B+] is the concentration of conjugate acid and [BOH] is the concentration of the weak base. Similar to acid buffers, pOH = pKb when [conjugate acid] = [weak base]. Buffering capacity is optimal at this pOH.
The Henderson—Hasselbalch equation is, in reality, just a rearrangement of the acid (or base) dissociation constant:
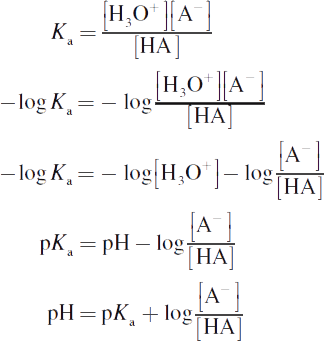
One subtlety of buffer systems and Henderson—Hasselbalch calculations that usually goes unnoticed or is misunderstood by students is the effect of changing the concentrations of the conjugate pair but not changing the ratio of their concentrations. Clearly, changing the ratio of the conjugate base to the acid will lead to a change in the pH of the buffer solution. But what about changing the concentrations while maintaining a constant ratio? What would happen if the concentrations of both the acid and its conjugate base were doubled? While the pH would not change, the buffering capacity—the ability to which the system can resist changes in pH—has doubled. In other words, addition of a small amount of acid or base to this system will now cause even less deviation in the pH. As mentioned earlier, the buffering capacity is generally maintained within 1 pH unit of the pKa value.
Example:
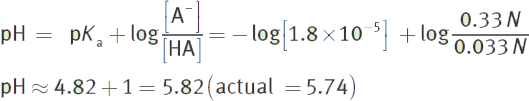
What is the pH of a solution made from 1 L of 0.05 M acetic acid (CH3COOH, Ka = 1.8 × 10⁻⁵) mixed with 500 mL of 1 M acetate (CH3COO−)?
Solution:
First, determine the concentrations of acetic acid and acetate in the final solution. Because two solutions were mixed, there will be some dilution of both the acetic acid and acetate.
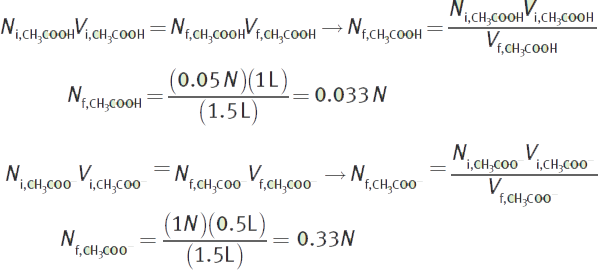
Then, use the Henderson—Hasselbalch equation.
MCAT Concept Check 10.4:
Before you move on, assess your understanding of the material with these questions.
1. Describe each of the following parts of a titration curve:
o Buffering region:
o Half-equivalence point:
o Equivalence point:
o Endpoint:
2. For a reaction involving a strong base and a weak acid, which of the following indicators would be best to indicate the endpoint of the titration? (Circle the correct answer.)
o Phenolphthalein (pKa = 9.7)
o Bromothymol blue (pKa = 7.1)
o Bromocresol green (pKa = 4.7)
o Methyl yellow (pKa = 3.3)
3. In which part of the pH range (acidic, basic, or neutral) will the equivalence points fall for each of the following titrations?
o Strong acid + weak base:
o Strong base + weak acid:
o Strong acid + strong base:
o Weak acid + weak base:
4. What is the purpose of a buffer solution?
5. What are the pH and pOH of a solution containing 5 mL of 5 M benzoic acid (Ka = 6.3 × 10⁻⁵) and 100 mL of 0.005 M benzoate solution?