Organic Chemistry I For Dummies, 2nd Edition (2014)
Part IV. Spectroscopy and Structure Determination
Chapter 18. Seeing Good Vibrations: IR Spectroscopy
IN THIS CHAPTER
Understanding how IR spectroscopy works
Seeing the IR spectrum
Identifying functional groups from IR spectra
Today, expert infrared (IR) spectroscopists are a lot like cowboys. It’s not that these chemists are cool like cowboys, or that they can hold their liquor like cowboys, or that they can beat up a buncha roughnecks in a saloon like cowboys, or even that they can attract the opposite sex like cowboys. Come to think of it, in most ways expert IR spectroscopists are the complete opposites of cowboys. But, like cowboys, expert IR spectroscopists are something of a dyin’ breed (insert soulful Country/Western dirge).
Over the past 40 years, the art of gleaning structural information from an IR spectrum has been slowly going the way of record players and LPs — which is to say that this art is reminisced about over snifters of brandy by old-timers when thinking about the way life was before such terrible modern contrivances as indoor plumbing, the polio vaccine, and NMR spectroscopy. Because before NMR spectroscopy became widespread, organic chemists were usually experienced enough in the art of IR spectroscopy to squeeze detailed structural features of an unknown compound from the pulp of an IR spectrum.
Today, though, most organic chemists just extract the juicy bits from an IR spectrum, and (when no one’s looking) chuck the pulpy remains in a dustbin. Nowadays, organic chemists look at an IR spectrum primarily to see what functional groups are present in a particular molecule, and then use NMR spectroscopy (see Chapters 19 and 20) to determine the structural details of the molecule. (For a review of the main functional groups, turn to Chapter 5.)
But although IR spectroscopy is somewhat less powerful than NMR spectroscopy, IR spectroscopy is still very useful as a structure-analyzing tool, and is widely used by modern organic chemists. Because the IR spectrum of a molecule tells you what functional groups are present in that molecule, and because taking an IR spectrum is a cinch (spectra can often be obtained in less than a minute), IR spectroscopy gives you a lot of bang for your buck (timewise, I mean; IR spectrometers are still somewhat expensive).
In this chapter, I discuss how IR spectroscopy works. I show you how an IR spectrum is taken, and I discuss how you can analyze an IR spectrum to determine which of the major functional groups are present in a compound.
Bond Calisthenics: Infrared Absorption
It’s easy to be fooled by fixed chemical structures and tables of precise bond lengths into thinking that bonds in molecules are fixed. But bonds are dynamic things. Bonds are not of fixed lengths, but instead are constantly stretching, bending, flexing, rotating, and rocking (and if a bond is a rockin’, don’t come a knockin’). So when you refer to a bond length as being x angstroms long, you’re talking about an average length, not a fixed distance. In fact, bonds behave kind of like springs that are in constant motion (see Figure 18-1). If you stretch a bond too far, it will apply a restoring force, snapping back in the opposite direction just like a spring.
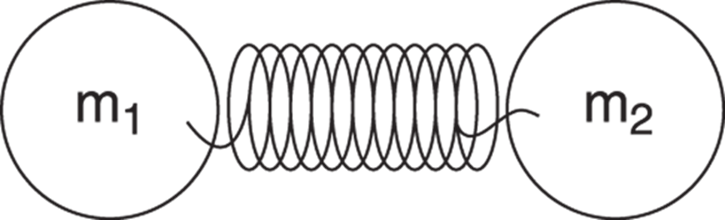
FIGURE 18-1: Bonds behave like springs.
Applying Hooke’s law to molecules
Because bonds behave like springs, you can apply Hooke’s law to determine the frequency of the vibrations of a bond. (Hooke’s law is used by physicists to describe the frequency of vibrations in springs.) This frequency is described by the following equations, where ν is the frequency of the vibration, c is the speed of light, and k is a constant that indicates the stiffness of the spring. The term μ is called the reduced mass and is a function of the masses of the two atoms involved in the bond (indicated by m1 and m2).
|
|
|

The gist of these equations is that two main components determine the frequency of a bond stretching vibration. These components are:
· The masses of the atoms in the bond (which determine μ in the equations)
· The bond strength (or the spring constant, k)
Looking closely at this equation, you can discover that a spring attached to two light objects will vibrate with higher frequency (higher ν) than a spring attached to two heavier objects. Thus, a bond attached to a smaller atom (like hydrogen, say) will vibrate with higher frequency than a bond attached to a heavier atom (like carbon). Take an example to prove this to yourself. Imagine atom 1 (m1) is a hydrogen atom and it’s attached by a bond to another hydrogen atom (m2). The reduced mass, μ, will be ![]() because each of the atomic weights of hydrogen is 1. If you change one hydrogen to a deuterium (deuterium is a hydrogen atom with an extra neutron, so it has a weight of 2), the reduced mass becomes
because each of the atomic weights of hydrogen is 1. If you change one hydrogen to a deuterium (deuterium is a hydrogen atom with an extra neutron, so it has a weight of 2), the reduced mass becomes ![]() . Because the frequency of bond vibration relates to
. Because the frequency of bond vibration relates to ![]() , this larger value for the reduced mass means that the frequency of vibration of the bond between H and D will be less than the frequency of the bond vibration between H and H.
, this larger value for the reduced mass means that the frequency of vibration of the bond between H and D will be less than the frequency of the bond vibration between H and H.
Additionally, stronger springs (those with higher values of k) vibrate faster (that is, at higher frequencies) than weaker springs do, just as the stronger spring in a car suspension vibrates faster than a slinky when stretched and released. This is because the frequency is proportional to the square root of the spring strength, k, so increasing k increases the frequency of vibration. Translating this feature to molecules, triple bonds vibrate at higher frequencies than double bonds because triple bonds are stronger than double bonds. For the same reason, double bonds vibrate at higher frequencies than single bonds, because double bonds are stronger than single bonds.
Seeing bond vibration and IR light absorption
Many different motions are present in molecules — stretching motions, bending motions, twisting motions, and rocking motions. The most important motion for IR spectroscopy is stretching motion, as shown in Figure 18-2.
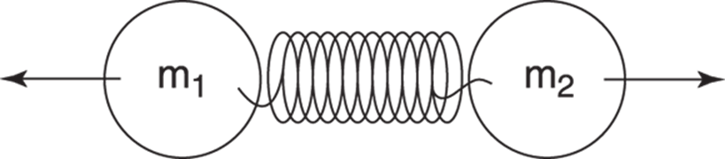
FIGURE 18-2: Stretching motion.
When a bond vibrates at a particular frequency (recall that this frequency is dictated by the mass of the two atoms and the strength of the bond), and light of that same frequency hits that bond, the light is absorbed by the molecule. This light absorption by the molecule can be detected. How? If you run light of a particular frequency through the sample and more light goes into the sample than comes out, that frequency of light is being absorbed by the molecules, and thus one of the bonds in the molecule must vibrate at that frequency.
In practice, this measurement is performed by running one beam of light through a blank reference cell (typically, the reference cell is an empty sample holder if the sample is a solid or liquid, or a sample container with solvent if the sample is dissolved) and one beam through the sample, and then comparing the difference in the intensity of the light beam coming out of the sample cell with that coming out of the blank, as shown in Figure 18-3. A monochrometer is a device used in an IR spectrometer that can filter out all but the desired wavelength. To generate an IR spectrum, you scan the monochrometer through all the IR frequencies (which goes on the x-axis) while simultaneously plotting the light transmittance on the y-axis. Note that even though, by convention, light transmittance (rather than light absorption) is plotted on the y-axis, peaks are usually referred to as absorptions, not transmittances!

FIGURE 18-3: How an IR spectrometer works.
The frequencies of light required to excite the vibrations of bonds falls in — surprise! — the infrared region of the electromagnetic spectrum (slightly lower frequency than visible light). Hence the name “infrared spectroscopy.”
Seeing absorption intensity
You now know that a bond will absorb light when it’s hit with light that has the same frequency as the frequency of the bond vibration. But what about the intensity of the absorption? The intensity of the absorption of light depends on the change in the dipole moment (see Chapter 2) of a particular vibration (this absorption intensity relates to the way that electromagnetic radiation — that is, light — interacts with molecules). Bonds that have large changes in dipole moment for a particular vibration have intense light absorptions.
For example, consider the stretching vibrations for C-H, N-H, and O-H bonds. Stretching an O-H bond produces a large change in dipole moment because oxygen is much more electronegative than hydrogen (refer to Chapter 2 for an explanation of electronegativity). Nitrogen is a less electronegative atom than oxygen, and so N-H bonds have a smaller change in dipole moment when stretched than do O-H bonds. A C-H stretch has an even smaller change in dipole moment because carbon is not very electronegative at all. Thus, O-H stretches have intense light absorptions, N-H bonds have weaker absorptions, and C-H stretches are weaker still, as summarized in Figure 18-4.

FIGURE 18-4: Absorption intensity of bonds.
IR forbidden stretches
If a bond motion produces no change in the bond’s dipole moment, the vibration will not absorb light at all. The vibrations that produce no change in dipole moment are called IR inactive vibrations, because they will not show up in an IR spectrum. Typically, these IR inactive vibrations occur in symmetrical molecules, because stretching these molecules does not change the dipole moment of the bond. For example, stretching the Cl-Cl bond in chlorine, or stretching the carbon-carbon triple bond in dimethyl acetylene (shown in Figure 18-5), does not change the dipole moment. These stretch modes are thus IR inactive, and do not show up in the IR spectrum.
![]()
FIGURE 18-5: IR inactive bonds.
Dissecting an IR Spectrum
The IR spectrum is set up in a somewhat weird way as a result of historical conventions. Instead of plotting absorbance, by convention the IR spectrum plots light transmittance. A zero value for transmittance indicates that none of the light passes through the sample at that wavelength (and thus all of the light is absorbed), and 100 percent transmittance indicates that all of the light passes through the sample at that wavelength. To generate the IR spectrum, different frequencies of infrared light are passed through the sample, and the transmittance of light at each frequency is measured. The transmittance is then plotted versus the frequency of the light (which is presented in the somewhat unusual units of cm–1).
What makes IR spectroscopy useful is that similar kinds of bonds show up in the same places in the IR spectrum, as Figure 18-6 shows. For example, the stretches associated with an alcohol (a molecule containing an OH functional group) show up generally in the same region of the spectrum more or less independently of what the rest of the molecule looks like.
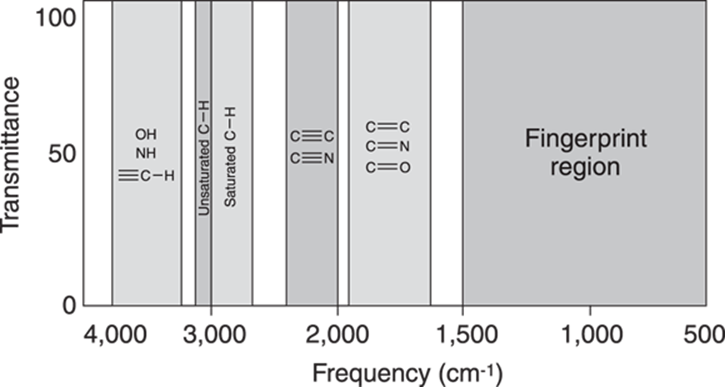
FIGURE 18-6: Typical bond absorption locations.
Note how Figure 18-6 makes sense in terms of the two factors that contribute to the vibration frequency — the size of the atom and the bond strength. Absorptions at high frequency (like those produced by OH, NH, and CH) appear at higher frequency than the absorptions produced by C-C bonds (including single, double, and triple carbon-carbon bonds) because hydrogen is a smaller atom than carbon. Also, triple bonds absorb at higher frequency than double bonds because triple bonds are stronger than double bonds.
The region of the spectrum between 500 cm–1 and 1,500 cm–1 is called the fingerprint region (refer to Figure 18-6). Every molecule has a unique set of absorptions in the fingerprint region of the spectrum. Unfortunately, this region of the spectrum is usually a complicated mess and is difficult to interpret. For this reason, beginners in the art of interpreting IR spectra typically ignore this region of the spectrum. However, the fingerprint region can still be useful for identifying unknown compounds, because two molecules that have identical fingerprint regions in the IR spectrum are almost certainly identical molecules. Thus, finding that the fingerprint region of your unknown compound’s IR spectrum and that of a known reference are identical is good evidence that the structure of the unknown is the same as the reference.
Identifying the Functional Groups
Table 18-1 lists the locations and intensities of absorptions produced by typical functional groups. Recognizing where the absorptions generated by the common functional groups occur will help you to interpret IR spectra.
TABLE 18-1 IR Absorptions of Common Functional Groups
|
Functional Group |
Absorption Location (cm–1) |
Absorption Intensity |
|
Alkane (C–H) |
2,850–2,975 |
Medium to strong |
|
Alcohol (O–H) |
3,400–3,700 |
Strong, broad |
|
Alkene (C=C) (C=C–H) |
1,640–1,680 3,020–3,100 |
Weak to medium Medium |
|
Alkyne (C≡C) (C≡C–H) |
2,100–2,250 3,300 |
Medium Strong |
|
Nitrile (C≡N) |
2,200–2,250 |
Medium |
|
Aromatics |
1,650–2,000 |
Weak |
|
Amines (N–H) |
3,300–3,350 |
Medium |
|
Carbonyls (C=O) Aldehyde (CHO) Ketone (RCOR) Ester (RCOOR) Acid (RCOOH) |
1,720–1,740 1,715 1,735–1,750 1,700–1,725 |
Strong |
Sizing up the IR spectrum
The IR spectrum of hexane (C6H14) is shown in Figure 18-7. Because hexane has only C-H and C-C bonds (and no functional groups), this spectrum can help orient you to the important regions in an IR spectrum.
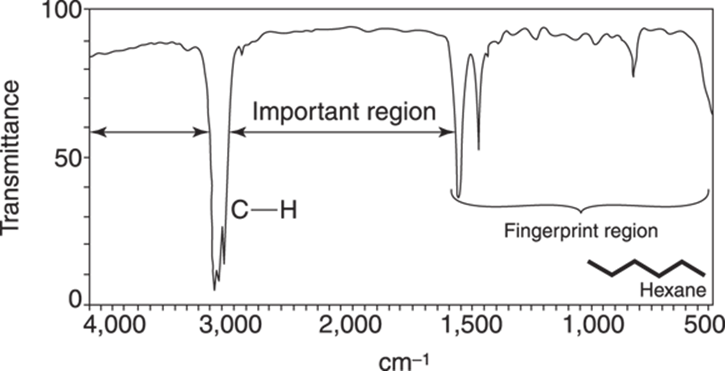
FIGURE 18-7: The IR spectrum of hexane.
Note the two features of the spectrum — the C-H absorptions between 2,800 cm–1 to 3,000 cm–1, and the fingerprint region below 1,500 cm–1. You should think of this spectrum as a blank; you mentally subtract out the two regions shown on this spectrum to look for the important absorptions in unknown compounds. Using these C-H stretches as a frame of reference is also convenient, because almost every organic compound contains C-H bonds. (Note that while individual C-H stretches are weak because of small changes in the dipole moment, a typical molecule often has a lot of these bonds, which makes these absorptions appear fairly intense.) Any absorptions to the left of these C-H stretches are typically N-H,O-H, or alkynyl (triple bond) C-H stretches. The other common functional groups have bands between the fingerprint region and the C-H stretching absorptions.
 Don’t get too distracted by the mess in the fingerprint region. Instead, look primarily in the important places (between 1,500 and 2,800 cm–1, and above 3,000 cm–1).
Recognizing functional groups
Learning where the functional groups appear in the spectrum is usually not enough. You need to be able to recognize and get a feel for what the absorptions of the common functional groups look like. Are they fat and round like a sumo wrestler’s belly (as in an O-H stretch), or are they small and thin like a supermodel’s (as in a carbon-carbon double bond stretch)? In Figure 18-8, I show you what the common functional groups look like.
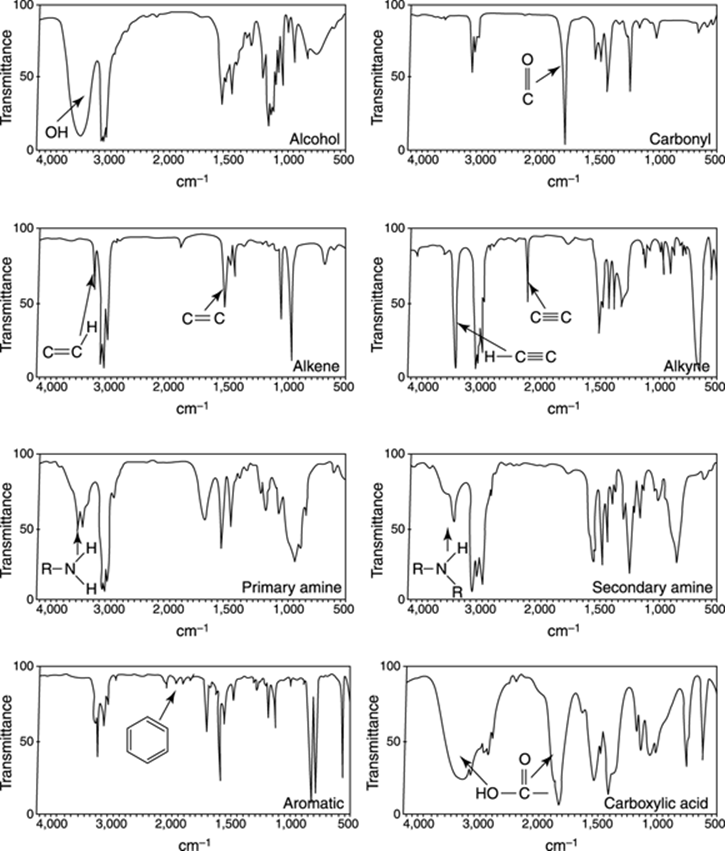
FIGURE 18-8: Absorptions of different functional groups.
Seeing to the Left of the C-H Absorptions
Look left and then right. In this section, I cover the features of the functional groups that appear to the left of the C-H absorptions in the IR spectrum. Refer to Figure 18-8 for examples of these functional groups.
Big and fat: The alcohols
Alcohols are very broad, fat absorptions that come to the left of the C-H absorptions. Because of their broadness, they’re very easy to spot.
Milking the spectrum: Amines
Primary amines (amines substituted by only one R group and abbreviated RNH2) are very easy to spot. They appear to the left of the C-H absorptions in the spectrum in about the same region as alcohol absorptions. Primary amines consist of two small peaks, and the overall effect is to make the absorptions of a primary amine look like a cow udder (refer to Figure 18-8). Secondary amines (amines substituted by two R groups and abbreviated R2NH) consist of only a single absorption in that region. A common mistake is to confuse secondary amine absorption with alcohol absorptions, because they both occur in the same region of the spectrum. Usually, secondary amine absorptions are somewhat thinner and sharper than the broad and rounded absorptions produced by alcohols. Only practice with problems dealing with IR spectra will make you confident in telling the difference between amine and alcohol absorptions.
Seeing to the Right of the C-H Absorptions
In this section, I cover the features of the functional groups that appear to the right of the C-H absorptions in the IR spectrum but to the left of the fingerprint region.
Big and tall: Carbonyl groups
Carbonyl groups are very easy to spot in an IR spectrum. They consist of an intense, thin absorption at about 1,700 cm–1 that looks like a finger (not a middle finger, I hope). Conjugated carbonyls (carbonyl groups adjacent to double bonds) have a somewhat lower frequency of vibration than ketones (these conjugated carbonyls often have absorptions below 1,700 cm–1). Ester carbonyls have a somewhat higher frequency of vibration than ketones. A carboxylic acid has a very fat carbonyl stretch and an alcohol absorption that’s even fatter than a typical alcohol stretch; this alcohol stretch from the carboxylic acid often expands into the region of the C-H stretches.
Hydrocarbon stretches: Alkenes, alkynes, and aromatics
Alkene (C=C) stretches appear around 2,250 cm–1, and are of either weak or medium intensity. If you’re unsure whether a small blip in that region of the spectrum represents an alkene, you can look for the unsaturated hydrogen stretches (C=C-H) above 3,000 cm–1. Typically, these are of medium intensity. Drawing a line down the spectrum at 3,000 cm–1 is often a good idea. Any stretches slightly higher than that frequency are a good indication of having an alkene (or an aromatic ring). Alkynes (carbon-carbon triple bonds) have absorptions between 2,100 and 2,250 cm–1, and are of medium intensity. A terminal alkyne (one at the end of a chain) is easy to spot because of the high-intensity alkynyl C-H stretch that comes at around 3,300 cm–1. Aromatic ring absorptions, on the other hand, can be tough to spot sometimes. They consist of a small series of bumps between 1,650 cm–1 and 2,000 cm–1. The number of bumps (absorptions) changes depending on how the benzene ring is substituted.