Physical Chemistry Essentials - Hofmann A. 2018
Catalysis
7.1 Homogeneous Catalysis
Catalysts accelerate reactions but do not undergo a net chemical change themselves. The process of catalysis is achieved by lowering the activation energy of a reaction, and providing an alternative path to circumvent the slow, rate-determining step of the non-catalysed reaction (see Fig. 7.1).
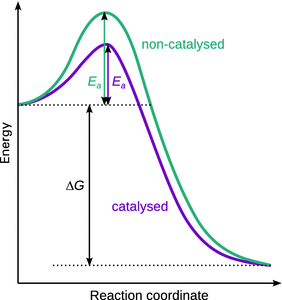
Fig. 7.1
Comparison of the energy profile of a reaction in the absence and presence of a catalyst. The free energy stabilisation of products over reactants is not altered; the catalyst only lowers the activation energy for the reaction
While the catalyst does not undergo a net chemical reaction, it can take part in the reaction, but will be regenerated in due course. Two types of catalysts can be distinguished:
✵ Homogeneous catalyst: a catalyst that exists in the same phase as the reaction mixture
✵ Heterogeneous catalyst: exists in a different phase than the reaction mixture.
Examples for reactions with homogeneous catalysis include hydrogen peroxide decomposition by iodide and any reactions by biological enzymes; here, the iodide and the enzymes are present in solution, as are the reactants. In contrast, heterogeneous catalysts do not exist in the same phase as the reactants. Examples for such processes include the olefin hydrogenation by palladium, platinum or nickel catalysis.
7.1 Homogeneous Catalysis
In order to appreciate the kinetics of a homogeneously catalysed reaction, we will have a closer look at the decomposition of hydrogen peroxide, a process which can be catalysed by iodide ions. The reactant (H2O2) and the catalyst (I−) are both present in solution, hence this constitutes a case of homogeneous catalysis.
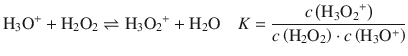
The decomposition of H2O2 is a disproportionation reaction, i.e. a reaction where an element changes its oxidation to a higher and a lower state simultaneously. It follows the net reaction:
![]()
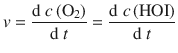
The reaction is believed to happen via the following pre-equilibrium that leads to generation of the hydroxyoxidanium ion H3O2 +:
![]()
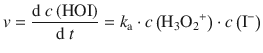
I− can act as a catalyst by reacting with the hydroxyoxidanium ion to hypoiodous acid, HOI:
![]()
![]()
The equilibrium reaction is characterised by the equilibrium constant K. Treating the reaction of iodide with the hydroxyoxidanium ion as an elementary reaction, we can formulate a rate law of second order.
(7.1)
![]()
(7.2)
![]()
Since the reaction of hypoiodous acid with peroxide is an extremely fast reaction, the contribution of this step to the overall rate of peroxide decomposition is negligible. The reaction rate for the catalysed reaction is thus:
From Eq. 7.2, we obtain for the rate
For the concentration of the hydroxyoxidanium ion, we know from the equilibrium 7.1 that
![]()
This yields for the overall rate:
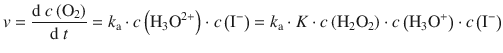
(7.3)
The notable observation from Eq. 7.3 is that an experimentally observed rate constant k is indeed the product of the rate constant of the reaction in 7.2 and the equilibrium constant of reaction 7.1 (k a · K). The derived rate law also shows that the catalysed reaction is dependent on the concentration of the catalyst, the iodide anion.
7.1.1 Acid and Base Catalysis
Acid and base catalysis are of particular importance as they are frequently observed features of organic reactions. We will only look briefly at catalysis involving Brönstedt acids and bases, but Lewis acids/bases can also take part as catalysts in reactions. The crucial step in acid catalysis involving Brönstedt acids is the transfer of a proton to the substrate. Examples include acid-catalysed ester hydrolysis and the keto-enol tautomerism illustrated in Fig. 7.2.
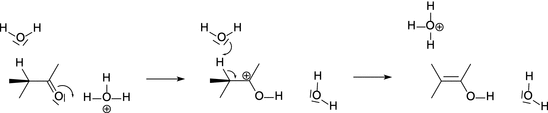
Fig. 7.2
The mechanism of acid catalysis in the transformation of a ketone to an enol (keto-enol tautomerism)
In base catalysis involving Brönstedt bases, abstraction of a proton from the substrate is the crucial step. Examples for such reactions include the isomerisation and halogenation of organic compounds, Claisen condensation, aldol condensation, keto-enol tautomerism (see Fig. 7.3).
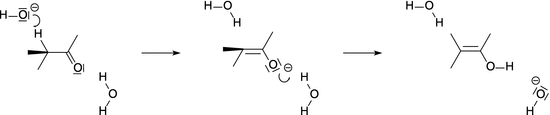
Fig. 7.3
The mechanism of base catalysis in the transformation of a ketone to an enol (keto-enol tautomerism)
7.1.2 Enzymatic Catalysis
Of particular importance for many biochemical reactions is the homogeneous catalysis carried out by enzymes. Enzymatic functions are observed with particular proteins (enzymes) or nucleic acid molecules (ribozymes) that possess active sites which bind the substrates and process them to products. Enzyme-catalysed reactions are prone to inhibition by molecules that interfere with product formation. Many drugs for treatment of diseases work by inhibiting particular enzymes.
Experimental studies of enzyme kinetics are typically conducted by monitoring the initial rate of product formation in solution, with low concentrations of enzymes present. The general features for enzyme-catalysed reactions are:
✵ For a given initial substrate concentration c 0(S), the initial rate of product formation v 0 is proportional to the total concentration of enzyme c 0(E):
![]()
✵ For a given total concentration of enzyme c 0(E) and at low concentrations of substrate c0(S), the rate of product formation is proportional to c 0(S):
![]()
✵ For a given total concentration of enzyme c 0(E) and large substrate concentrations c 0(S), the rate of product formation becomes independent of the substrate concentrations, reaching a maximum rate v max:
![]()
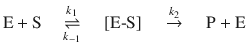
7.1.3 The Michaelis-Menten Mechanism
The general features of enzyme-catalysed reactions (see previous section) are accounted for in the Michaelis-Menten mechanism, which assumes an enzyme-substrate complex as intermediate in the enzymatically catalysed product formation:
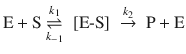
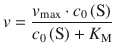
Investigating the kinetics of the hydrolysis of sucrose into glucose and fructose by the enzyme invertase, Leonor Michaelis and Maud Menten developed the above mechanism and derived the following expression for the rate of an enzymatic reaction, known as the Michaelis-Menten equation (Michaelis and Menten 1913):
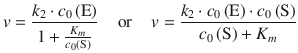
(7.4)
with the Michaelis-Menten constant
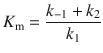
(7.5)
Equation 7.4 describes the shape of the v 0−c 0(S) curve as shown in Fig. 7.4, and thus explains the three observations introduced in Sect. 7.1.2 that characterise enzymatic catalysis.
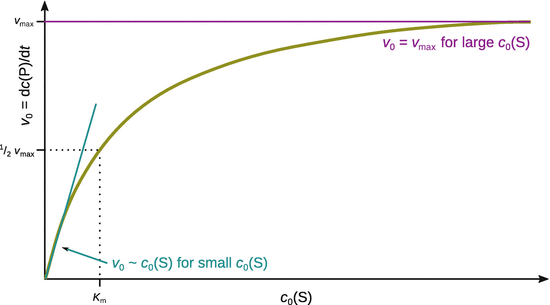
Fig. 7.4
Typical Michaelis-Menten kinetics of an enzyme in the v 0−c 0(S) plot
As apparent from Table 7.1, these considerations also deliver a definition of the maximum rate as per v max = k 2 ⋅ c 0(E), which we can substitute into the initial Michaelis-Menten Eq. 7.4:
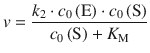
(7.4)
and thus obtain
(7.6)
Table 7.1
The Michaelis-Menten kinetics describes the three general observations of enzymatic reactions
|
Observation |
Michaelis-Menten |
v 0 ∼ c 0(E) |
|
v 0 ∼ c 0(S) for small c 0(S) |
for c 0(S) << K m follows:
|
v 0 = v max for large c 0(S) |
for c 0(S) >> K m follows: v = v max = k 2 ⋅ c 0(E) |
This form of the Michaelis-Menten equation is of practical importance, as it contains all parameters accessible in experimental measurements of enzymatic reactions. The equation can be transformed into a linear relationship, which has been of huge importance for enzymology studies. This analysis technique has been of great importance before the availability of computer-aided non-linear fitting software; it is still applied today in particular applications. By inverting both side of Eq. 7.6 one obtains:
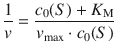
where the right side can be separated into two terms:
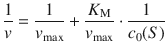
(7.7)
By plotting ![]() on the ordinate (y-axis) and
on the ordinate (y-axis) and ![]() on the abscissa (x-axis), a linear relationship with the positive slope
on the abscissa (x-axis), a linear relationship with the positive slope ![]() and positive y-intercept
and positive y-intercept ![]() is obtained. This plot is known as the Lineweaver-Burk plot (see Fig. 7.5).
is obtained. This plot is known as the Lineweaver-Burk plot (see Fig. 7.5).
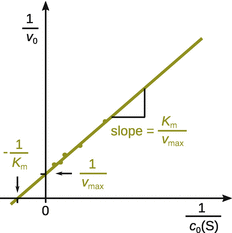
Fig. 7.5
Illustration of the Lineweaver-Burk plot
7.1.4 Enzyme Efficiency and Enzyme Inhibition
The turnover number of an enzyme, k cat, is the number of catalytic cycles performed in a given time interval, divided by that time interval. k cat is a first-order rate constant and equivalent to the rate constant for release of product from the enzyme-substrate complex, k 2:
![]()
(7.8)
Equation 7.8 is a direct consequence of one of the three general observations for enzymatic reactions (see Table 7.1).
The efficiency of an enzyme is dependent on
✵ How much substrate it requires
✵ How many turnover cycles it performs in a given time period.
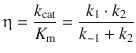
The substrate concentration required to achieve 50% of the maximum rate of an enzymatic reaction is described by the Michaelis-Menten constant K M. Therefore, a lower K M will result in higher efficiency. Likewise, the efficiency will be higher, if the turnover number (k cat) is high. The catalytic efficiency η of an enzyme is thus defined as:

(7.9)
and, by using the relationships from Eqs. 7.5 and 7.8, can also be expressed in terms of the rate constants k 1, k −1 and k 2:
7.1.5 Enzyme Inhibition
Molecules that affect enzyme activity are called effectors and can either be activators or inhibitors. The discovery of enzyme inhibitors (and thus the study of enzyme inhibition) is an important biomedical discipline, since enzyme inhibitors may be used as therapeutics. Drug discovery therefore relies heavily on enzyme inhibition studies.
There are three different types of enzyme inhibition mechanisms:
✵ Competitive inhibition
✵ Un-competitive inhibition
✵ Non-competitive inhibition
In competitive inhibition, either the substrate or the inhibitor can bind to the enzyme, but not both of them simultaneously. This can come about by way of two different scenarios: The inhibitor may directly compete with the substrate for binding in the active site (one binding site); alternatively, the inhibitor may bind to a site different from the active site (two binding sites), but its binding will exclude binding of the substrate in the active site. This latter case is called allosteric inhibition. When comparing the enzyme kinetics data at different concentrations of effector in the Lineweaver-Burk plot, competitive inhibition shows the behaviour illustrated in Fig. 7.6, left panel.
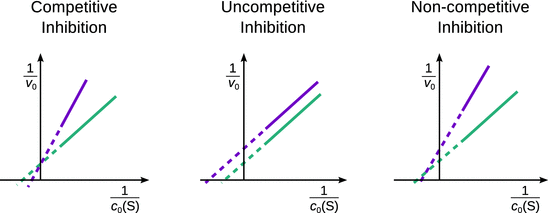
Fig. 7.6
Different types of inhibition show different changes in the Lineweaver-Burk plot. In this schematic illustration, the turquoise curves show enzyme activity data in the absence, and the magenta curves in the presence of an inhibitor
The mechanism of uncompetitive inhibition requires two different binding events, the substrate binding to the active site of the enzyme, and the inhibitor binding to a different site. Binding of the inhibitor decreases the activity of the enzyme. However, in contrast to the above allosteric competitive inhibition, in the case of uncompetitive inhibition the effector binds only when the substrate is present. Therefore, binding of the inhibitor is indeed to the enzyme-substrate complex [E-S]. In the Lineweaver-Burk plot, uncompetitive inhibition results in parallel lines with different x- and y-intercepts (Fig. 7.6, centre panel).
Non-competitive inhibition of an enzymatic reaction arises when the inhibitor reduces the binding of the substrate to the free enzyme as well as the enzyme-substrate complex [E-S]. This mechanism can be distinguished from the two other in the Lineweaver-Burk plot as illustrated in Fig. 7.6, right panel.