Process Technology: An Introduction - Haan A.B. 2015
11 Particle removal from gases
11.2 Collecting efficiency
The evaluation of any particulate separation process requires the determination of the collecting efficiency. A first start is to use the overall efficiency of particle collection defined on a mass basis
![]()
(11.1)
to describe the effectiveness of the separation. Besides the mass basis, the collecting efficiency may also be expressed in terms of the number of particles or area of particles entering and leaving the collector. A major complication is that the overall efficiency depends not only on the operating conditions, but also on the particle-size distribution of the feed. It is therefore impossible to characterize the performance of gas-solid separation equipment without proper quantification of particle size and size distribution. This requires the identification of the most suitable definition of particle size and the appropriate quantification of the distribution (number, surface, or volume). The distribution of particle sizes is normally plotted as either a differential or cumulative distribution (see Fig. 11.3). The cumulative distribution can be represented as either oversize or undersize distribution. In an oversize cumulative distribution plot, the y-axis represents the fraction of population with particle sizes greater than the selected size (on the x-axis). The plots also allow interpolation of size fractions for particle sizes that have not been experimentally determined.
The dependence of collection efficiency on particle size is represented by the grade efficiency function. It is most common to define the grade efficiency curve as the collecting efficiency obtained for each particle size dp:
![]()
(11.2)
For an ideal separation the vertical line in Fig. 11.4 would describe the grade efficiency curve. In practice however, this situation is rarely realized, and consequently the s-shape curve represents a typical grade efficiency curve. There are several key aspects to a grade efficiency curve. The size for which the particle has equal probability to be collected in the coarse or the fines steams is called the cut size. Another useful concept is the sharpness of the cut. The sharpness of cut defines the amount of material that is misclassified into the two product fractions. One of the most common definitions is the ratio of the sizes associated with two different efficiencies,
![]()
(11.3)
where d80 and d20 are the particle sizes associated with 80 % and 20 % collecting efficiency on the grade efficiency curve.
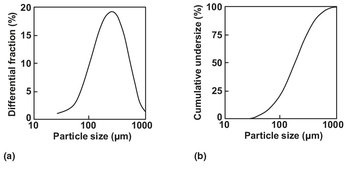
Fig.11.3: Differential (a) and cumulative (b) particle-size distribution curves.
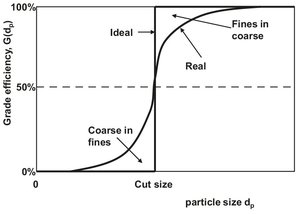
Fig. 11.4: Ideal and real grade collecting efficiency curves.
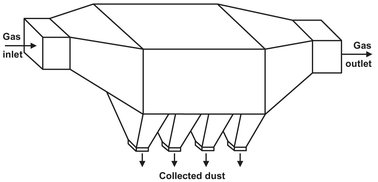
Fig. 11.5: Horizontal flow-settling chamber with square cross section.