Master AP Calculus AB & BC
Part II. AP CALCULUS AB & BC REVIEW
CHAPTER 2. Calculus Prerequisites
PARAMETRIC EQUATIONS (BC TOPIC ONLY)
There are numerous ways to express relations, and the Calculus AB test focuses almost exclusively on rectangular representation. However, the BC test includes three others: parametric, polar, and vector. Luckily, there is a lot of overlap among the three, so come on back in off of that ledge, BCer—you have so much to live for!
Parametric equations use a parameter (a third variable) in their definition. For example, the parametric representation of a circle centered at the origin with radius one is given by: x = cos t, y = sin t. You get the ordered pair to draw the graph by substituting successive values of t into the expressions for x and y (the arrows give you a sense of direction in the graph but are not actually part of the graph).
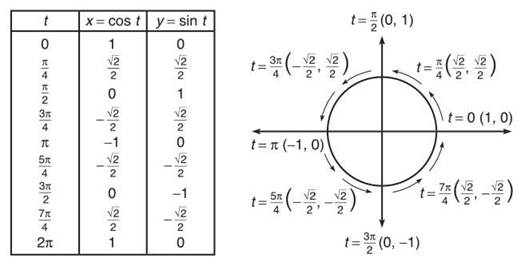
NOTE. In this example, you should use t values on the interval [0,2π), since x and y involve trigonometric functions. The graph you get as a result is the unit circle! If you think about it, this makes a lot of sense.
The graph tells you a lot more than the equivalent rectangular equation of x2 + y2 = 1. With this set of parameters, you can easily tell that the graph begins and ends at the point (1,0) and proceeds in a counter-clockwise path. You can even get some notion of the speed traveled in the path. These are the major endearing qualities of parametric equations.
Your TI calculator can easily draw parametric equations. Press the Mode button and select Parametric mode. The “Y=” screen will now show “x1T =” and “y1T =”. Type your parametric equations there. The “x,t,θ” button will now display a t, since you are in parametric mode. In order to adjust the values through which t will cycle, press Window, and set the maximum and minimum values of t.
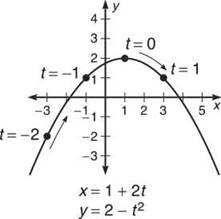
Example 15: Graph the parametric equation x = 1 + 2t, y = 2 — t2 and convert it to rectangular form.
Solution: Using a table of values or the calculator, you get the graph of a parabola. If you got only half of the parabola, make sure you are substituting in negative values of t. A good range for t on the calculator is —10 ≤ f ≤ 10 if there aren’t any trigonometric functions, although sometimes 10 is unnecessarily high. Better safe than sorry, though.
NOTE. If you graph the parametric equations x = cos(2t), y = sin (2t), the graph is the same as x = cos t and y = sin t, but the circle is actually drawn twice! In fact, the circle is fully completed when t = π. There can be numerous ways to express a graph in parametric form, differing in direction, path, and the speed of the graph.
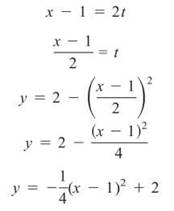
In order to convert to rectangular form, solve either x or y for t and plug into the other. The x expression seems easier, so it’s better to start by solving it for t:
TIP. Adjust the range of t on the calculator by pressing the Window button.
This is a parabola with vertex (1,2) opening downward, as is verified in our graph.
Example 16: Graph the parametric equation x = cos2t, y = sint, and find its corresponding equation in rectangular form.
Solution: Again, graph using a table of values or a calculator, but make sure to reset your t values to [0,2π). In order to convert to rectangular form, utilize the Mamma Theorem and substitute.
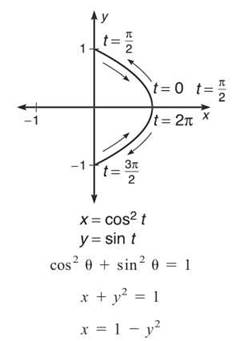
Notice that the parametric graph does not include the entire parabola. Therefore, it is important that you restrict the rectangular equation so that its graph matches exactly. The final answer is x = 1 — y2, x ≥ 0.
EXERCISE 6
Directions: Solve each of the following problems. Decide which is the best of the choices given and indicate your responses in the book.
DO NOT USE A GRAPHING CALCULATOR FOR THESE PROBLEMS.
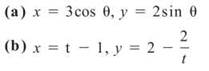
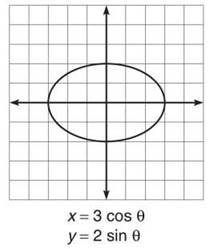
1. Draw the graphs of the following parametric equations and rewrite each in rectangular form:
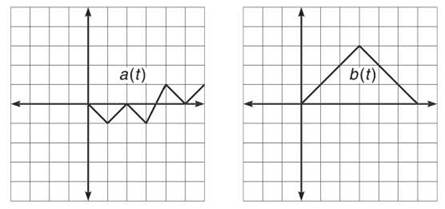
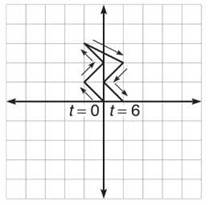
2. Given the graphs below, draw the graph of the parametric equations x = a(t), y = b(t).
3. Find parametric equations whose graph is an ellipse centered at the origin with horizontal major axis of length 8 and minor axis of length 4.
4. Based on your work on the above problems, name another benefit of parametric equations versus rectangular functions.
5. Create as many parametric representations of y = ax + b as you can.
ANSWERS AND EXPLANATIONS
1. (a) The graph is easy to find via chart or graphing calculator. In this instance, it is just as easy to find by converting the equation to rectangular form. Because the Mamma Theorem states that cos2θ + sin2θ = 1, you should solve the parametric equations for cos θ and sin θ. If you do, the result is x/3 = cos θ and y/2 = sin θ. By substitution into the Mamma Theorem, ![]() which is standard form for an ellipse.
which is standard form for an ellipse.
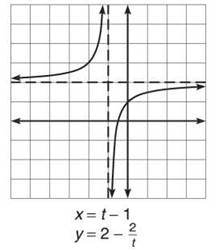
(b) Again, the challenge is the conversion to rectangular form. In this problem, it is easy to solve the x equation for t: t = x + 1. Substitute this into the y equation to get ![]() Simplify this to get the rectangular equation
Simplify this to get the rectangular equation ![]()
2. Make an ordered pair to begin graphing. For example, consider t = 2. At this value of t, a(2) = 0 and b(2) = 2. Therefore, the graph will contain the point (0,2). Use a similar process for the other values of t between 0 and 6.
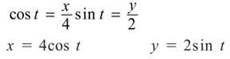
3. Your work in 1(a) makes this much easier. The ellipse described has equation ![]() Because the Mamma Theorem also has two terms being summed to equal 1, you can do the following:
Because the Mamma Theorem also has two terms being summed to equal 1, you can do the following:
![]() (because of Mamma)
(because of Mamma)
4. Parametric equations can easily describe non-functions, as best evidenced in Solution 2 above. That crazy-looking thing certainly does not pass the vertical line test.
5. The simplest representation of any function in parametric form is accomplished by setting x — t and to make that substitution in the y equation: y = at + b. However, there are many ways to express that function. Notice that x = t — b and y = at — ab + b also results in the same graph. Simply pick anything for the x equation and adjust y accordingly.