5 Steps to a 5 AP Calculus AB & BC, 2012-2013 Edition (2011)
STEP 2. Determine Your Test Readiness
Chapter 3. Take a Diagnostic Exam
IN THIS CHAPTER
Summary: Get started in your review by working out the problems in the diagnostic exam. Use the answer sheet to record your answers. After you have finished working the problems, check your answers with the answer key. The problems in the diagnostic exam are presented in small groups matching the order of the review chapters. Your results should give you a good idea of how well you are prepared for the AP Calculus Exams at this time. Note those chapters that you need to study the most, and spend more time on them. Good luck. You can do it.
Key Ideas

![]() Work out the problems in the diagnostic exam carefully.
Work out the problems in the diagnostic exam carefully.
![]() Check your work against the given answers.
Check your work against the given answers.
![]() Determine your areas of strength and weakness.
Determine your areas of strength and weakness.
![]() Identify and mark the pages that you must give special attention.
Identify and mark the pages that you must give special attention.
DIAGNOSTIC TEST ANSWER SHEET
1. ____________________
2. ____________________
3. ____________________
4. ____________________
5. ____________________
6. ____________________
7. ____________________
8. ____________________
9. ____________________
10. ____________________
11. ____________________
12. ____________________
13. ____________________
14. ____________________
15. ____________________
16. ____________________
17. ____________________
18. ____________________
19. ____________________
20. ____________________
21. ____________________
22. ____________________
23. ____________________
24. ____________________
25. ____________________
26. ____________________
27. ____________________
28. ____________________
29. ____________________
30. ____________________
31. ____________________
32. ____________________
33. ____________________
34. ____________________
35. ____________________
36. ____________________
37. ____________________
38. ____________________
39. ____________________
40. ____________________
41. ____________________
42. ____________________
43. ____________________
44. ____________________
45. ____________________

46. ____________________
47. ____________________
48. ____________________
49. ____________________
50. ____________________
51. ____________________
52. ____________________
53. ____________________
54. ____________________
55. ____________________
56. ____________________
57. ____________________
58. ____________________
59. ____________________
60. ____________________
3.1 Getting Started!
Taking the Diagnostic Test helps you assess your strengths and weaknesses as you begin preparing for the AP Calculus exam. The questions in the Diagnostic Test contain both multiple-choice and open-ended questions. They are arranged by topic, and designed to review concepts tested on the AP Calculus exam. All questions in the diagnostic test should be done without the use of a graphing calculator, except in a few cases where you need to find the numerical value of a logarithmic or exponential function. Towards the end of the test, you will find a group of questions that cover topics unique to the BC exam. These include all the material from Chapter 14 as well as selected topics from other chapters.
3.2 Diagnostic Test
Chapter 5
1. A function f is continuous on [−2, 0] and some of the values of f are shown below.
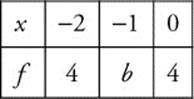
If f(x) = 2 has no solution on [−2, 0], then b could be
(A) 3
(B) 2
(C) 1
(D) 0
(E) −2
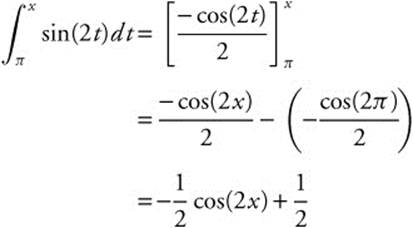
2. Evaluate 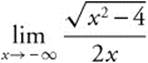 .
.
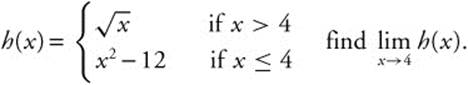
3. If
4. If f(x) = |2xex|, what is the value of ![]()
Chapter 6
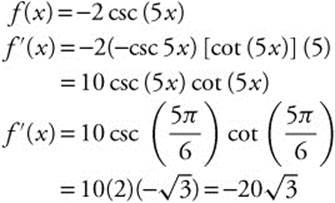
5. If f (x)= −2 csc (5x), find ![]() .
.
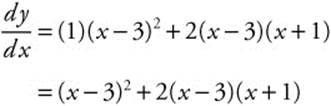
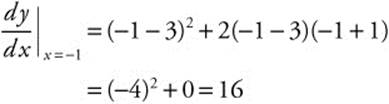
6. Given the equation y = (x + 1)(x − 3)2, what is the instantaneous rate of change of y at x = −1?
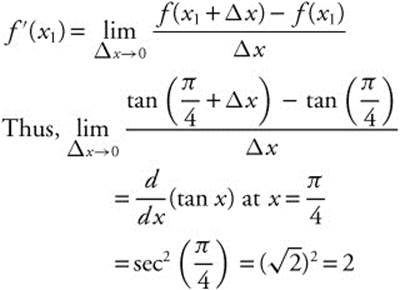
7. What is 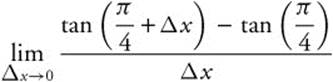 ?
?
Chapter 7
8. The graph of f is shown in Figure D-1. Draw a possible graph of f′ on (a, b).
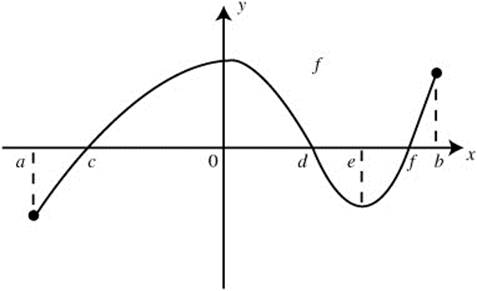
Figure D-1
9. The graph of the function g is shown in Figure D-2. Which of the following is true for g on (a, b)?
I. g is monotonic on (a, b).
II. g′ is continuous on (a, b).
III. g″ >0 on (a, b).
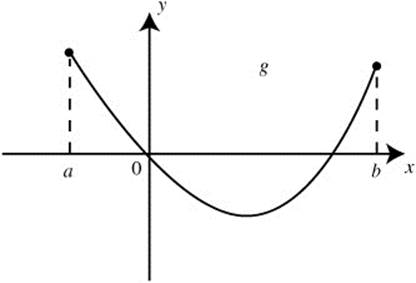
Figure D-2
10. The graph of f is shown in Figure D-3 and f is twice differentiable, which of the following statements is true?
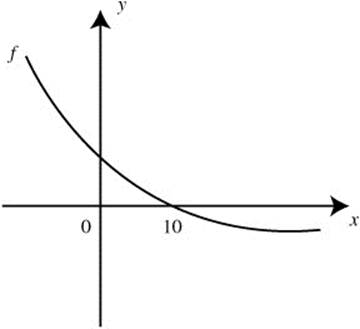
Figure D-3
(A) f(10) < f′(10) < f″(10)
(B) f″(10) < f′(10) < f(10)
(C) f′(10) < f(10) < f″(10)
(D) f′(10) < f″(10) < f(10)
(E) f″(10) < f(10) < f′(10)
11. The graph of f′, the derivative of f, is shown in Figure D-4. At what value(s) of x is the graph of f concave up?
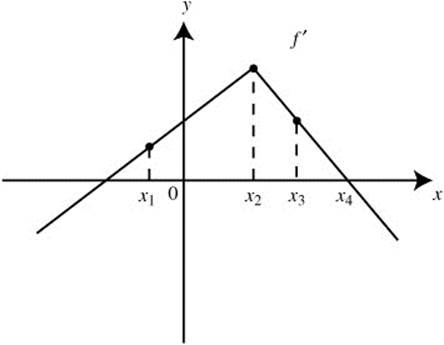
Figure D-4
12. How many points of inflection does the graph of y = sin(x2) have on the interval [−π, π]?
13. If 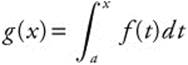 and the graph of f is shown in Figure D-5, which of the graphs in Figure D-6 on the next page is a possible graph of g?
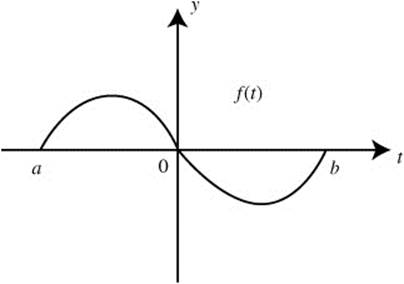
Figure D-5
14. The graphs of f′, g′, p′, and q′ are shown in Figure D-7 on the next page. Which of the functions f, g, p, or q have a point of inflection on (a, b)?
Chapter 8
15. When the area of a square is increasing four times as fast as the diagonals, what is the length of a side of the square?
16. If g(x) = |x2 − 4x − 12|, which of the following statements about g is/are true?
I. g has a relative maximum at x = 2.
II. g is differentiable at x = 6.
III. g has a point of inflection at x = −2.
Chapter 9
17. Given the equation ![]() what is an equation of the normal line to the graph at x = 5?
what is an equation of the normal line to the graph at x = 5?
18. What is the slope of the tangent to the curve y = cos(x y) at x = 0?
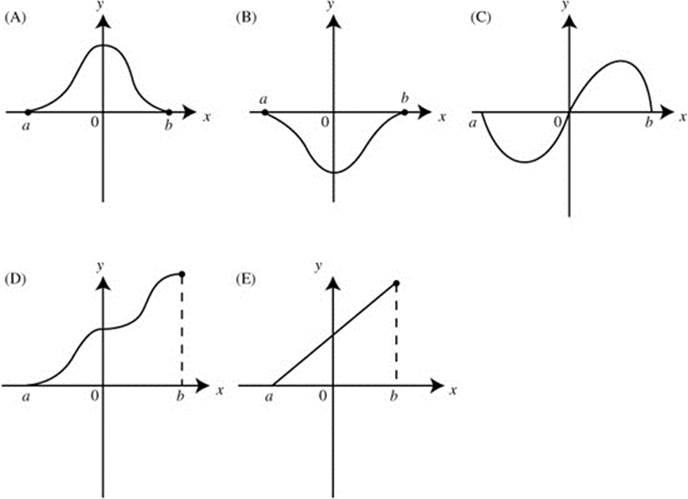
Figure D-6
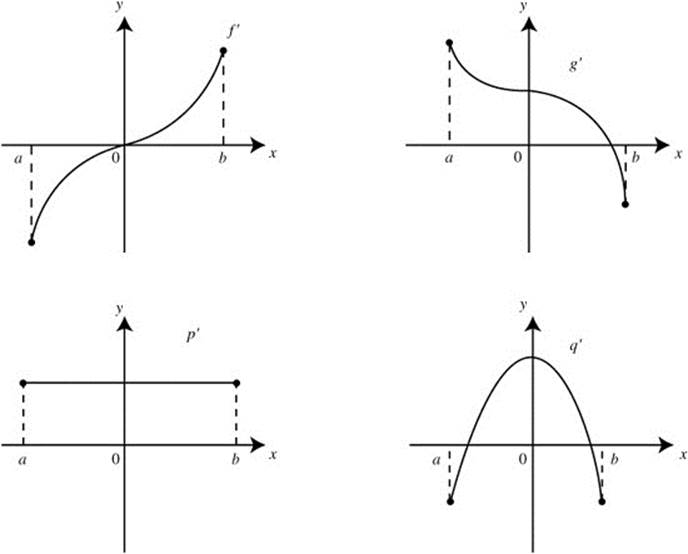
Figure D-7
19. The velocity function of a moving particle on the x-axis is given as v(t) = t2 − t. For what values of t is the particle’s speed decreasing?
20. The velocity function of a moving particle is ![]() for 0 ≤ t ≤ 6. What is the maximum acceleration of the particle on the interval 0 ≤ t ≤ 6?
for 0 ≤ t ≤ 6. What is the maximum acceleration of the particle on the interval 0 ≤ t ≤ 6?
21. Write an equation of the normal line to the graph of y = x3 for x ≥ 0 at the point where f′(x) = 12 and y = f (x).
22. At what value(s) of x do the graphs of ![]() and y = −x2 have perpendicular tangent lines?
and y = −x2 have perpendicular tangent lines?
23. Given a differentiable function f with ![]() and
and ![]() . Using a tangent line to the graph at
. Using a tangent line to the graph at ![]() , find an approximate value of,
, find an approximate value of, ![]() .
.
Chapter 10
24. Evaluate  .
.
25. If f (x) is an antiderivative of ![]() and f(0) = ln (2), find f(ln 2).
and f(0) = ln (2), find f(ln 2).
26. Find the volume of the solid generated by revolving about the x-axis on the region bounded by the graph of y = sin 2x for 0 ≤ x ≤ π and the line ![]() .
.
Chapter 11
27. Evaluate 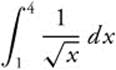 .
.
28. If 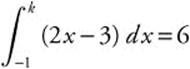 , find k.
29. If 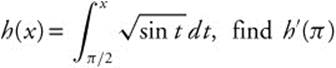 .
.
30. If f′(x) = g(x) and g is a continuous function for all real values of x, then 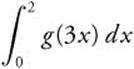 is
is
![]()
(B) f (2) − f (0).
(C) f (6) − f (0).
![]()
(E) 3 f (6) − 3 f (0).
31. Evaluate 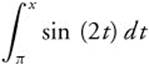 .
.
32. If a function f is continuous for all values of x, which of the following statements is/are always true?
33. If 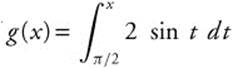 on
on  , find the value(s) of x where g has a local minimum.
Chapter 12
34. The graph of the velocity function of a moving particle is shown in Figure D-8. What is the total distance traveled by the particle during 0 ≤ t ≤ 6?
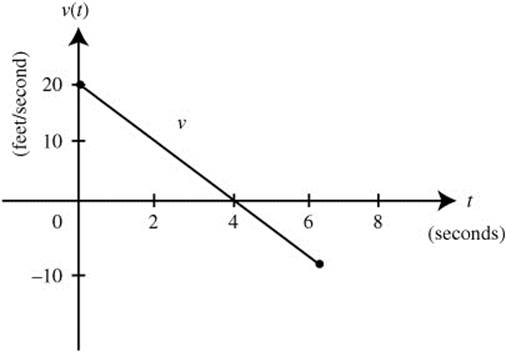
Figure D-8
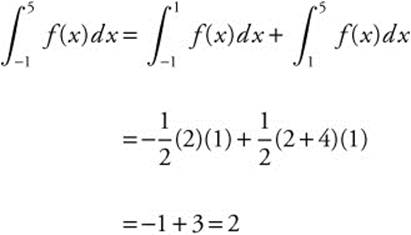
35. The graph of f consists of four line segments, for −1 ≤ x ≤ 5 as shown in Figure D-9.
What is the value of 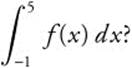
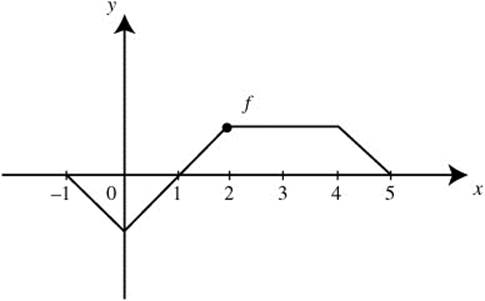
Figure D-9
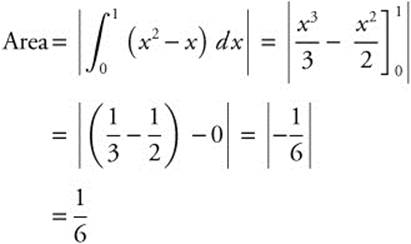
36. Find the area of the region enclosed by the graph of y = x2 − x and the x-axis.
37. If 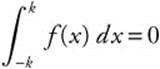 for all real values of k, then which of the graphs in Figure D-10 could be the graph of f?
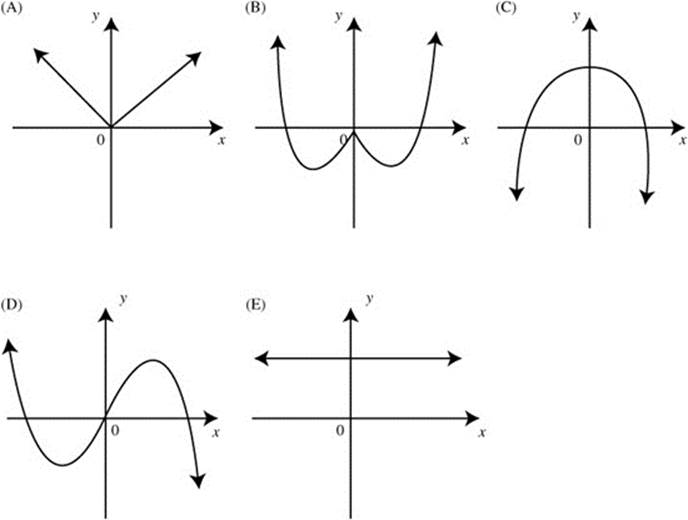
Figure D-10
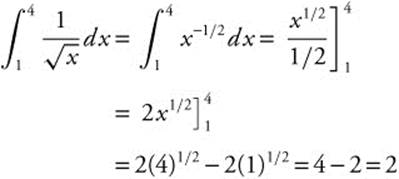
38. The area under the curve ![]() from x = 1 to x = k is 8. Find the value of k.
from x = 1 to x = k is 8. Find the value of k.
39. For 0 ≤ x ≤ 3π, find the area of the region bounded by the graphs of y = sin x and y = cos x.
40. Let f be a continuous function on [0, 6] that has selected values as shown below:
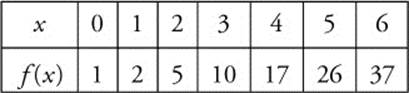
Using three midpoint rectangles of equal widths, find an approximate value of 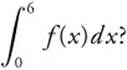
Chapter 13
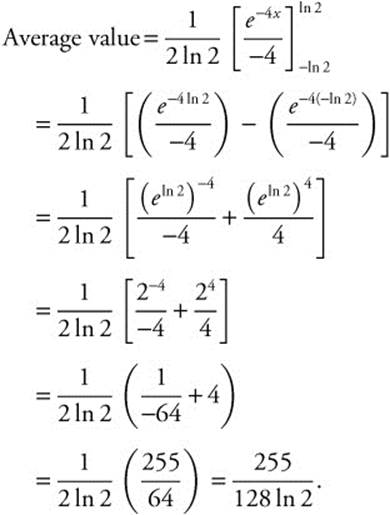
41. What is the average value of the function y = e−4x on [-ln 2, ln 2]?
42. If ![]() and at x = π, y = 2, find a solution to the differential equation.
and at x = π, y = 2, find a solution to the differential equation.
43. Water is leaking from a tank at the rate of f(t) = 10 ln (t + 1) gallons per hour for 0 ≤ t ≤ 10, where t is measured in hours. How many gallons of water have leaked from the tank at exactly after 5 hours?
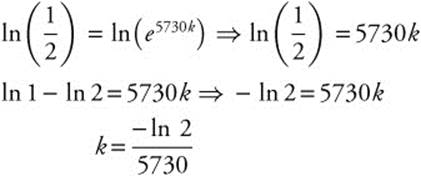
44. Carbon-14 has a half-life of 5730 years. If y is the amount of Carbon-14 present and y decays according to the equation ![]() , where k is a constant and t is measured in years, find the value of k.
, where k is a constant and t is measured in years, find the value of k.
45. What is the volume of the solid whose base is the region enclosed by the graphs of y = x2 and y = x + 2 and whose cross sections perpendicular to the x-axis are squares?
Note: The questions below focus on topics covered only on the BC exam.
Chapter 6
46. Evaluate ![]() .
.
Chapter 7
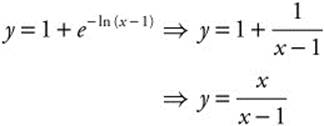
47. Find the rectangular equation of the curve defined by x = 1 + e-t and y = 1 + et.
Chapter 9
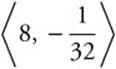
48. An object moves in the plane on a path given by x = 4t2 and ![]() Find the acceleration vector when t = 4.
Find the acceleration vector when t = 4.
49. Find the equation of the tangent line to the curve defined by x = 2t + 3, y = t2 + 2t at t = 1.
Chapter 10
50. Evaluate 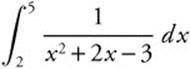 .
.
51. Evaluate 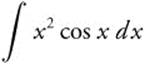 .
.
Chapter 11
52. Evaluate 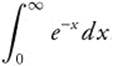 .
.
Chapter 12
53. Find the total area bounded by the curves r = 2 cos θ and r = 2 sin θ.
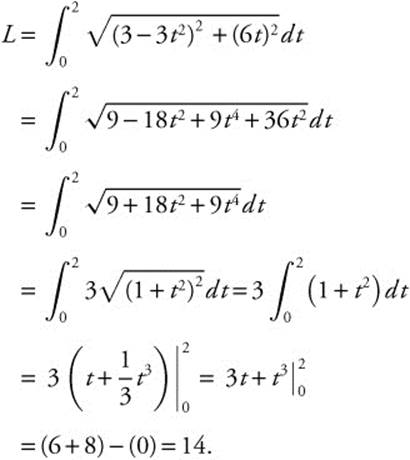
54. Determine the length of the curve defined by x = 3t − t3 and y = 3t2 from t = 0 to t = 2.
Chapter 13
55. The growth of a colony of bacteria in a controlled environment is modeled by 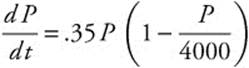 . If the initial population is 100, find the population when t = 5.
56. If ![]() and y = 3 when x = 2, approximate y when x = 3.
and y = 3 when x = 2, approximate y when x = 3.
Chapter 14
57. Determine whether the series ![]() converges or diverges.
converges or diverges.
58. For what values of x does the series 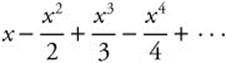 converge absolutely?
59. Find the Taylor series expansion of ![]() about the point x = 2.
about the point x = 2.
60. Find the MacLaurin series for ![]() .
.
3.3 Answers to Diagnostic Test
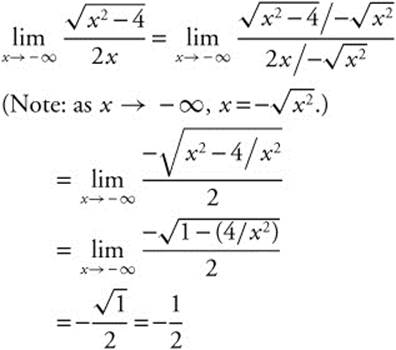
1. A
2. −1/2
3. Does not exist.
4. 2
5. ![]()
6. 16
7. 2
8. See Figure DS-3.
9. II & III
10. C
11. x < x2
12. 8
13. A
14. q
15. ![]()
16. I
17. y = −4x + 22
18. 0
19. 
20. 12
21. ![]()
22. 1.370
23. 2.983
24. ![]()
25. ln 3
26. 1.503
27. 2
28. {−2, 5}
29. 0
30. A
31. ![]()
32. I&III
33. 2π
34. 50 feet
35. 2
36. ![]()
37. D
38. 132/3
39. 5.657
40. 76
41. ![]()
42. y = −2 cos x
43. 57.506
44. ![]()
45. ![]()
Topics Unique to the BC Exam
46. ![]()
47. ![]()
48. 
49. y = 2x − 7
50. 
51. x 2 sin x + 2x cos x − 2 sin x + C
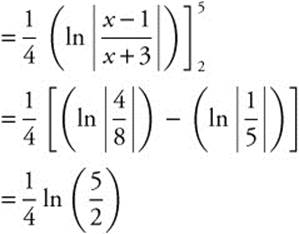
52. 1
53. ![]()
54. 14
55. 514.325
56. 2.415
57. Converges
58. −1 < x < 1
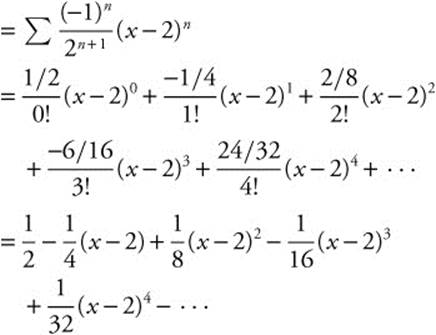
59. ![]()
60. ![]()
3.4 Solutions to Diagnostic Test
Chapter 5
1. See Figure DS-1.
If b = 2, then x = −1 would be a solution for f(x) = 2.
If b = 1, 0 or −2, f(x) = 2 would have two solutions.
Thus, b = 3, choice (A).
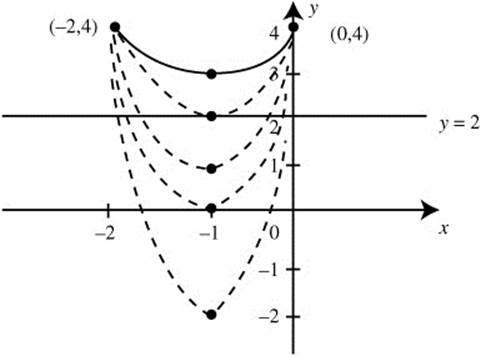
Figure DS-1
2.
3
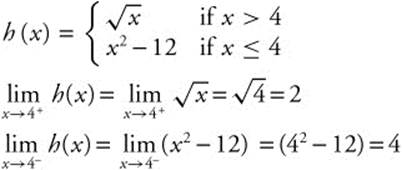
Since ![]() does not exist.
does not exist.
4.
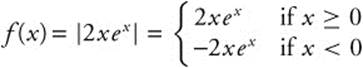
If x ≤ 0, f′(x) = 2ex + ex (2x) = 2ex + 2xex
![]()
Chapter 6
5.
6. y = (x + 1)(x − 3)2;
7.
Chapter 7
8. See Figure DS-2 on the next page.
9. I. Since the graph of g is decreasing and then increasing, it is not monotonic.
II. Since the graph of g is a smooth curve, g′ is continuous.
III. Since the graph of g is concave upward, g″ > 0.
Thus, only statements II and III are true.
10. The graph indicates that (1) f(10) = 0, (2) f′(10) < 0, since f is decreasing; and (3) f″(10) > 0, since f is concave upward. Thus, f′(10) < f(10) < f″(10), choice (C).
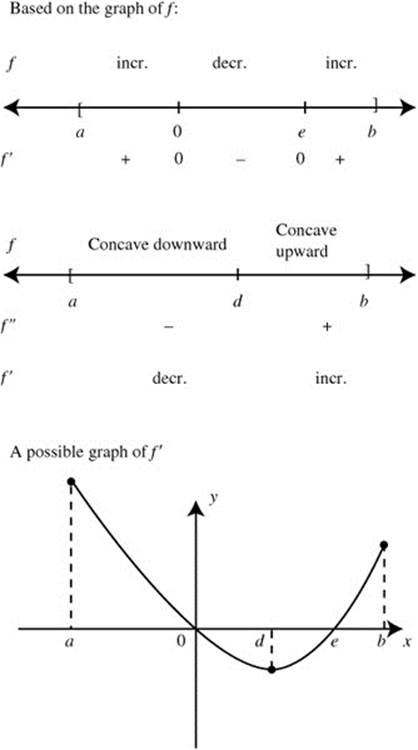
Figure DS-2
11. See Figure DS-3.
The graph of f is concave upward for x < x2.
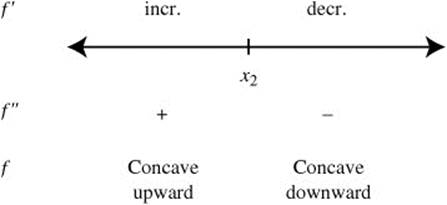
Figure DS-3
12. See Figure DS-4.
Enter y1 = sin(x2). Using the [Inflection] function of your calculator, you obtain four points of inflection on [0, π]. The points of inflection occur at x = 0.81, 1.81, 2.52, and 3.07. Since y1 = sin (x2) is an even function, there is a total of eight points of inflection on [−π, π]. An alternate solution is to enter ![]() . The graph of y2 crosses the x-axis eight times, thus eight zeros on [−π, π].
. The graph of y2 crosses the x-axis eight times, thus eight zeros on [−π, π].
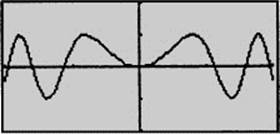
Figure DS-4
13. Since 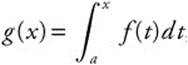 , g′(x) = f(x).
See Figure DS-5.
The only graph that satisfies the behavior of g is choice (A).
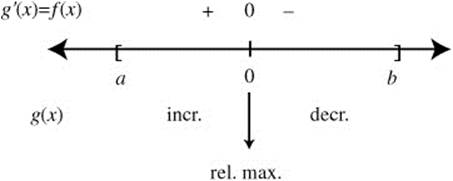
Figure DS-5
14. See Figure DS-6.
A change of concavity occurs at x = 0 for q. Thus, q has a point of inflection at x = 0. None of the other functions has a point of inflection.
Figure DS-6
Chapter 8
15. Let z be the diagonal of a square. Area of a
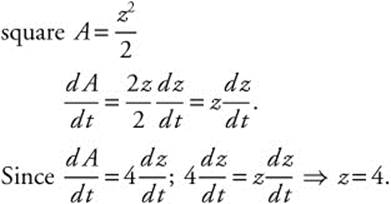
Let s be a side of the square. Since the diagonal z = 4, s2 + s2 = z2 or 2s2 = 16. Thus, s2 = 8 or ![]() .
.
16. See Figure DS-7.
The graph of g indicates that a relative maximum occurs at x = 2; g is not differentiable at x = 6, since there is a cusp at x = 6, and g does not have a point of inflection at x = −2, since there is no tangent line at x = −2. Thus, only statement I is true.
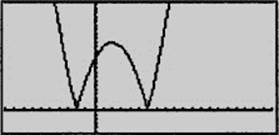
Figure DS-7
Chapter 9
17.
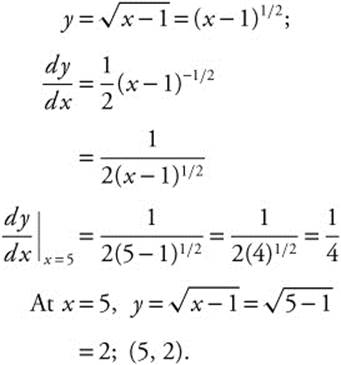
Slope of normal line = negative reciprocal of  .
.
Equation of normal line:
y − 2 = −4(x − 5) ⇒ y = −4(x − 5) + 2 or y = −4x + 22.
18.
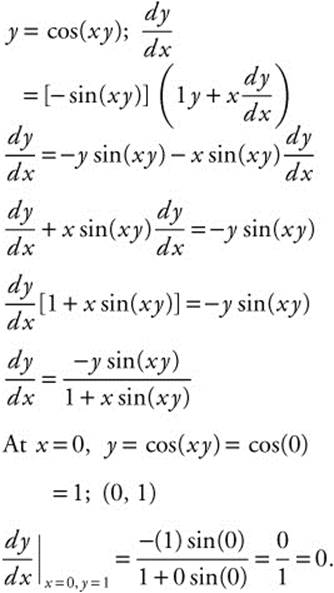
Thus, the slope of the tangent at x = 0 is 0.
19. See Figure DS-8.
v(t) = t2 − t
Set v(t) = 0 ⇒ t(t − 1) = 0
⇒ t = 0 or t = 1
a(t) = v′(t) = 2t − 1.
![]()
Since v(t) < 0 and a(t) > 0 on  , the speed of the particle is decreasing on
  .
.
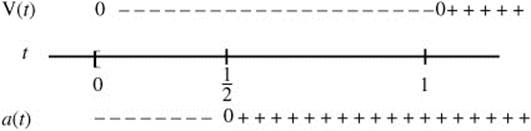
Figure DS-8
20.
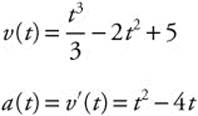
See Figure DS-9.
The graph indicates that the maximum acceleration occurs at the endpoint t = 6. a(t) = t2 − 4t and a(6) = 62 − 4(6) = 12.
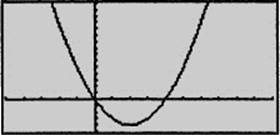
Figure DS-9
21.
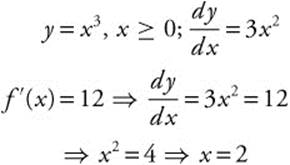
Slope of normal = negative reciprocal of slope of tangent ![]() .
.
At x = 2, y = x3 = 23 = 8; (2, 8) ![]() .
.
![]() or
or ![]() .
.
22.
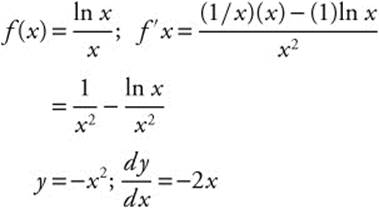
Perpendicular tangents
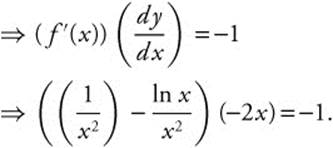
Using the [Solve] function on your calculator, you obtain ![]() .
.
23. ![]() is on the graph.
is on the graph.
![]() ⇒ slope of the tangent at
⇒ slope of the tangent at ![]() is −1.
is −1.
Equation of tangent line:
![]()
Thus,
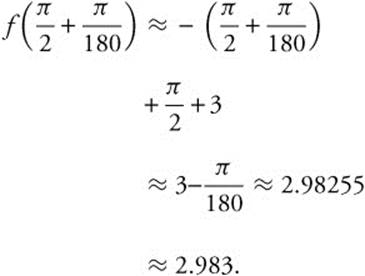
Chapter 10
24.
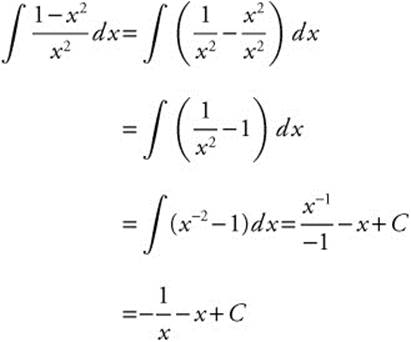

You can check the answer by differentiating your result.
25. Let u = ex + 1; du = ex dx.
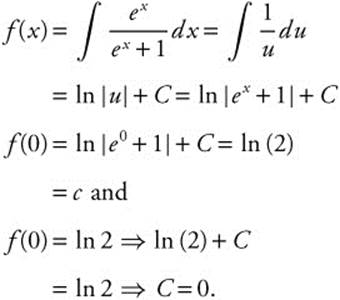
Thus, f(x) = ln (ex + 1) and f(ln 2)
= ln (eln2 + 1) = ln (2 + 1)
= ln 3.
26. See Figure DS-10.
To find the points of intersection, set
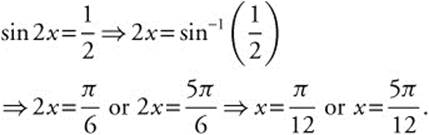
Volume of solid
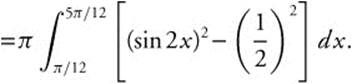
Using your calculator, you obtain: Volume of solid ≈ (0.478306)π ≈ 1.50264 ≈ 1.503.
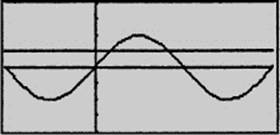
Figure DS-10
Chapter 11
27.
28.
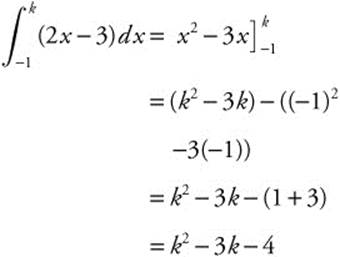
Set k2 − 3k − 4 = 6 ⇒ k2 − 3k − 10 = 0
⇒ (k − 5)(k + 2) = 0 ⇒ k = 5 or k = −2.
You can check your answer by evaluating 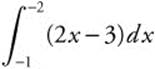 and
and 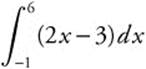 .
.
29.
30. Let u = 3x; du = 3dx or ![]() .
.
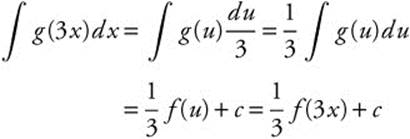
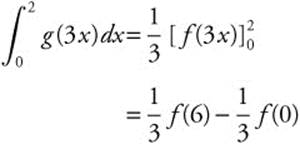
Thus, the correct choice is (A).
31.
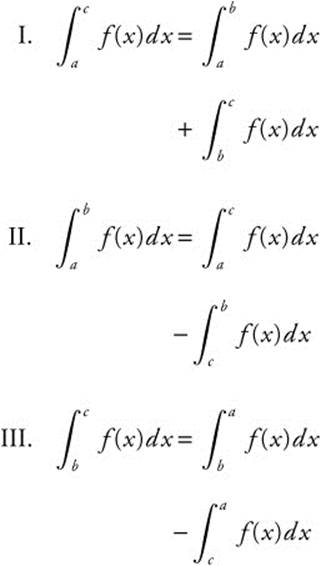
32.
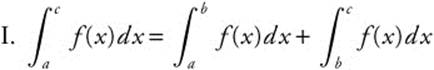
The statement is true, since the upper and lower limits of the integrals are in sequence, i.e. a → c = a → b → c.
II.
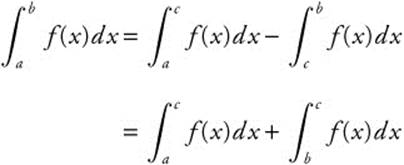
The statement is not always true.
III.
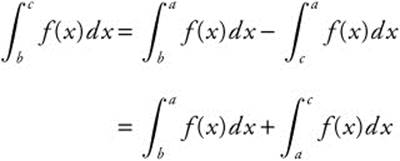
The statement is true.
Thus, only statements I and III are true.
33. Since 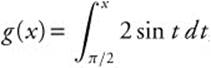 , then g′(x) = 2 sin x.
Set g′(x) = 0 ⇒ 2 sin x = 0 ⇒ x = π or 2π g″(x) = 2 cos x and g″(π) = 2 cos π = −2 and g″(2π) = 1.
Thus g has a local minimum at x = 2π. You can also approach the problem geometrically by looking at the area under the curve. See Figure DS-11.
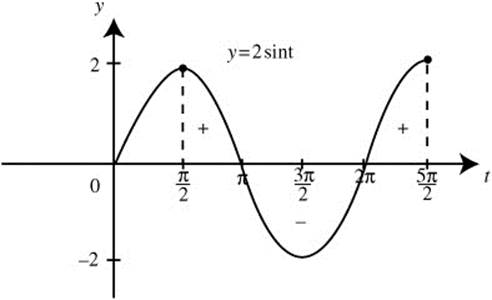
Figure DS-11
Chapter 12
34.
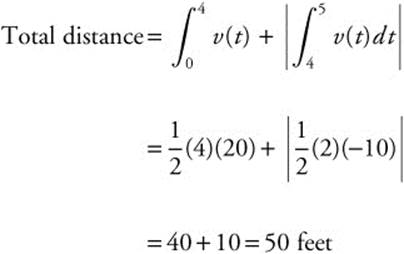
35.
36. To find points of intersection, set y = x2 − x = 0
⇒ x (x − 1) = 0 ⇒ x = 0 or x = 1.
See Figure DS-12.
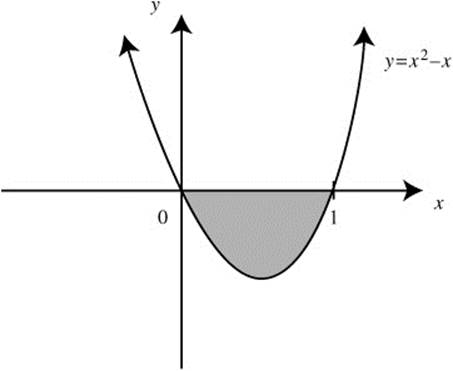
Figure DS-12
37. 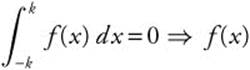 is an odd function, i.e., f(x) = − f(−x). Thus the graph in choice (D) is the only odd function.
38.
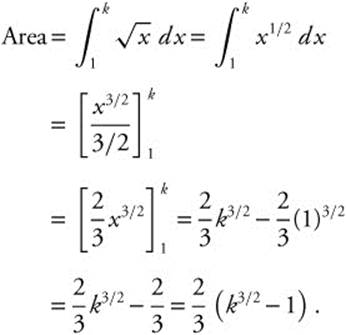
Since A = 8, ![]()
= 12 ⇒ k3/2 = 13 or k = 132/3.
39. See Figure DS-13.
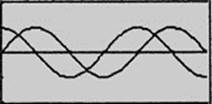
Figure DS-13
Using the [Intersection] function of the calculator, you obtain the intersection points at x = 0.785398, 3.92699, and 7.06858.
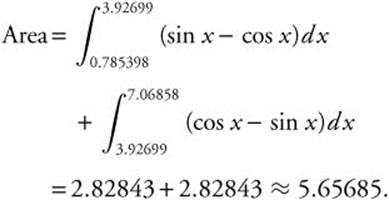
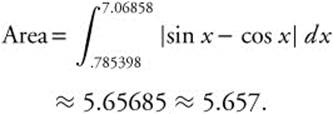
You can also find the area by:
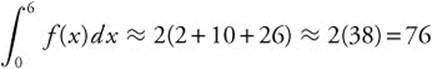
40. Width of a rectangle ![]() . Midpoints are x = 1, 3, and 5 and f(1) = 2, f(3) = 10 and f(5) = 26.
. Midpoints are x = 1, 3, and 5 and f(1) = 2, f(3) = 10 and f(5) = 26.
Chapter 13
41.
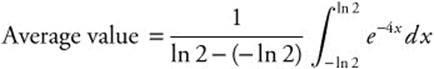 .
.
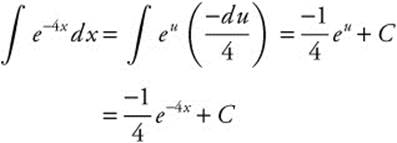
Let u = −4x; du = −4dx, or ![]() .
.
42.
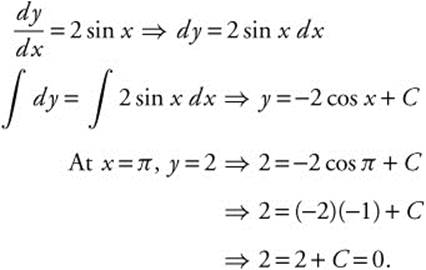
Thus, y = −2 cos x.
43. Amount of water leaked
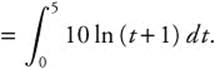
Using your calculator, you obtain 10(6 ln 6 − 5) which is approximately 57.506 gallons.
44.
![]()
Half-life = 5730 ⇒ ![]()
when t = 5730.
Thus, ![]() .
.
45. See Figure DS-14.
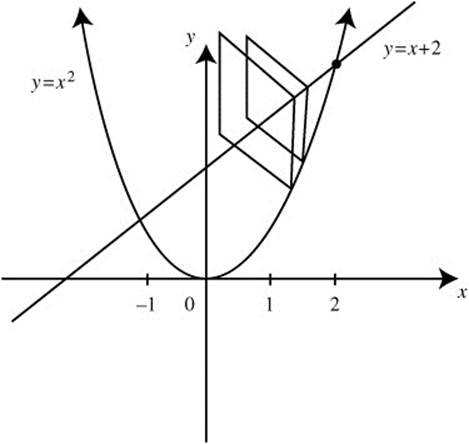
Figure DS-14
To find points of intersection, set x2 = x + 2 ⇒ x2 − x−2 = 0 ⇒ x = 2 or x = −1.
Area of cross section = ((x + 2) − x2)2.
Volume of solid, 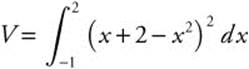 .
.
Using your calculator, you obtain: ![]() .
.

Topics Unique to the BC Exam
Chapter 6
46. By L’Hôpital’s Rule, ![]()
Chapter 7
47. Solve x = 1 + e−t for t. x − 1 = e−t ⇒ − ln (x − 1) = t. Substitute in y = 1 + et.
Chapter 9
48. Position is given by x = 4t2 and ![]() , so velocity is
, so velocity is ![]() and
and 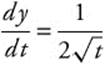 . The acceleration will be
 ![]() ,
, ![]() .
. 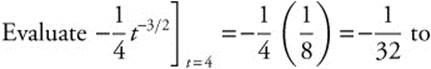 get the acceleration vector
 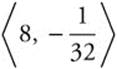 .
.
49. The slope of the tangent line is  and
and ![]() ,
, ![]() , so
, so 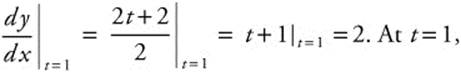
x = 5, y = 3, ⇒ (5, 3),
So, the equation of the tangent line is y − 3 = 2(x − 5) ⇒ y = 2(x − 5) + 3 ⇒ y = 2x − 7.
Chapter 10
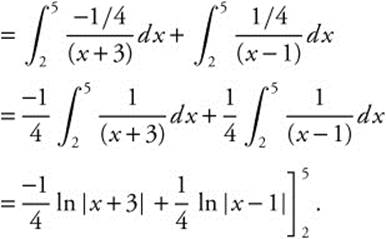
50. 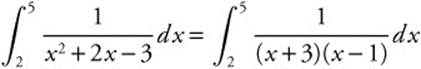 Use a partial fraction decomposition with
 ![]() , which gives
, which gives ![]() and
and ![]() . Then the integral becomes
. Then the integral becomes
51. Integrate ![]() x2 cos x dx by parts with u = x2,
x2 cos x dx by parts with u = x2,
du = 2x dx, dv = cos x dx, and v = sin x.
The integral becomes
= x2 sin x − ![]() sin x (2x) dx
sin x (2x) dx
= x2 sin x − 2 ![]() x sin x dx.
x sin x dx.
Use parts again for the remaining integral, letting u = x, du = dx, dv = sin x dx, and v = − cos x. The integral
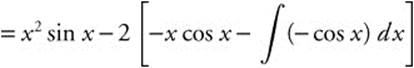 simplifies to
and the final integration gives you
= x2 sin x + 2 x cos x − 2 sin x + C.
Chapter 11
52.
Chapter 12
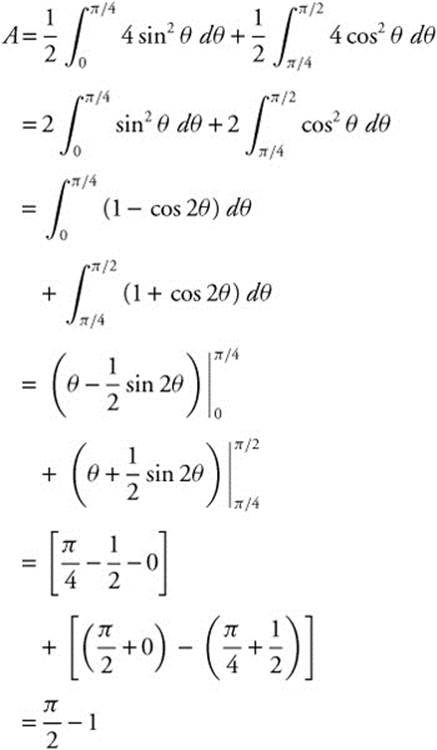
53. The intersection of the circles r = 2 cos θ and r = 2 sin θ can be found by adding the area swept out by r = 2 sin θ for ![]() and the area swept by r = 2 cos θ for
and the area swept by r = 2 cos θ for ![]() .
.
54. Differentiate ![]() and
and ![]() The length of the curve from t = 0 to t = 2 is
The length of the curve from t = 0 to t = 2 is
Chapter 13
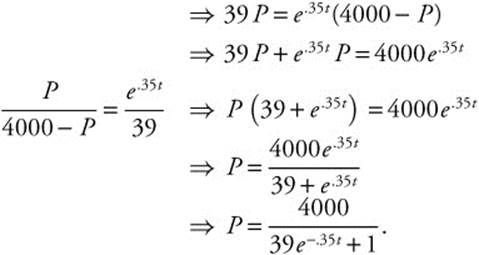
55. Separate and simplify
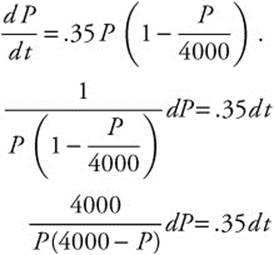
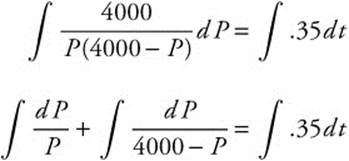
Integrate with a partial fraction decomposition.
ln |P | − ln |4000 − P | = .35t + C1
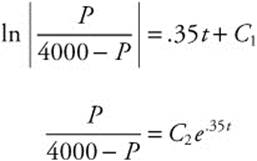
Population at t = 0 is 100, so
![]()
The population model is
When t = 5, 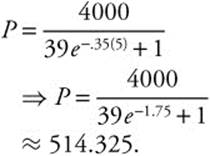
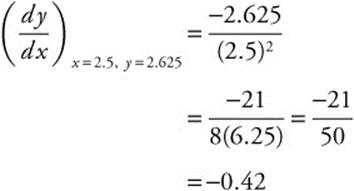
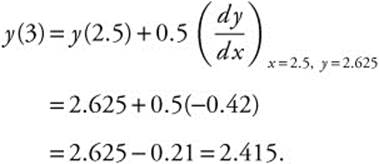
56. If ![]() and y = 3 and x = 2, approximate y when x = 3. Use Euler’s
and y = 3 and x = 2, approximate y when x = 3. Use Euler’s
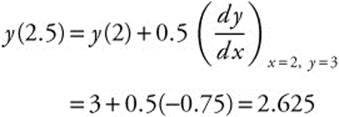
Method with an increment of 0.5.
y(2) = 3 and 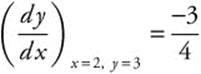 so
so
Chapter 14
57. The series ![]() is a series with positive terms, which can be compared to the series
is a series with positive terms, which can be compared to the series ![]() .
. ![]() and
and ![]() is a p-series with p = 4, and therefore convergent.
is a p-series with p = 4, and therefore convergent. ![]() is term by term smaller than
is term by term smaller than ![]() and so
and so ![]() converges.
converges.
58. The series 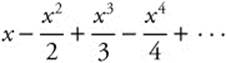 is an alternating series with general term
 ![]() . Using the ratio test for absolute convergence, we have
. Using the ratio test for absolute convergence, we have 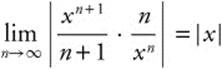
![]() . The series will converge absolutely when |x| < 1 ⇒ − 1 < x < 1. We do not consider the end points since the question asks for absolute convergence.
. The series will converge absolutely when |x| < 1 ⇒ − 1 < x < 1. We do not consider the end points since the question asks for absolute convergence.
59. Investigate the first few derivatives of
![]() .
. ![]() ,
, ![]() ,
, ![]() , and, in general,
, and, in general,
![]()
![]() .
.
Evaluate the derivatives at x = 2. ![]() ,
,
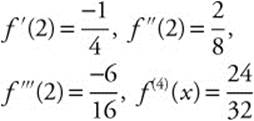
and, in general, ![]() .
.
The Taylor series is 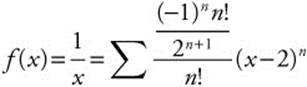
60. Begin with the MacLaurin series for ex.
If f(x) = ex, then f′(x) = ex, f″(x) = ex, and fn(x) = ex.
Thus ![]()
Replacing x by −x 2, we have 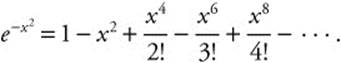
Thus, ![]() .
.
3.5 Calculate Your Score
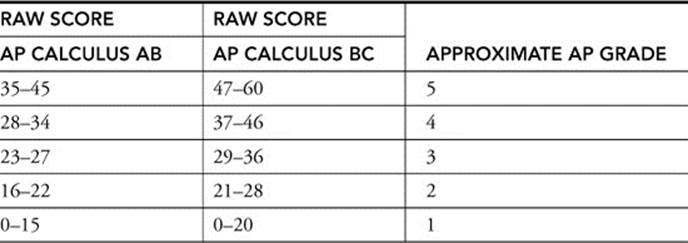
Short-Answer Questions
Questions 1–45 for AP Calculus AB
![]()
Questions 1–60 for AP Calculus BC
![]()
AP Calculus AB/BC Diagnostic Exam