5 Steps to a 5: AP Calculus AB 2017 (2016)
STEP 5
Build Your Test-Taking Confidence
AP Calculus AB Practice Exam 1
AP Calculus AB Practice Exam 2
AP Calculus AB Practice Exam 1
ANSWER SHEET FOR MULTIPLE-CHOICE QUESTIONS
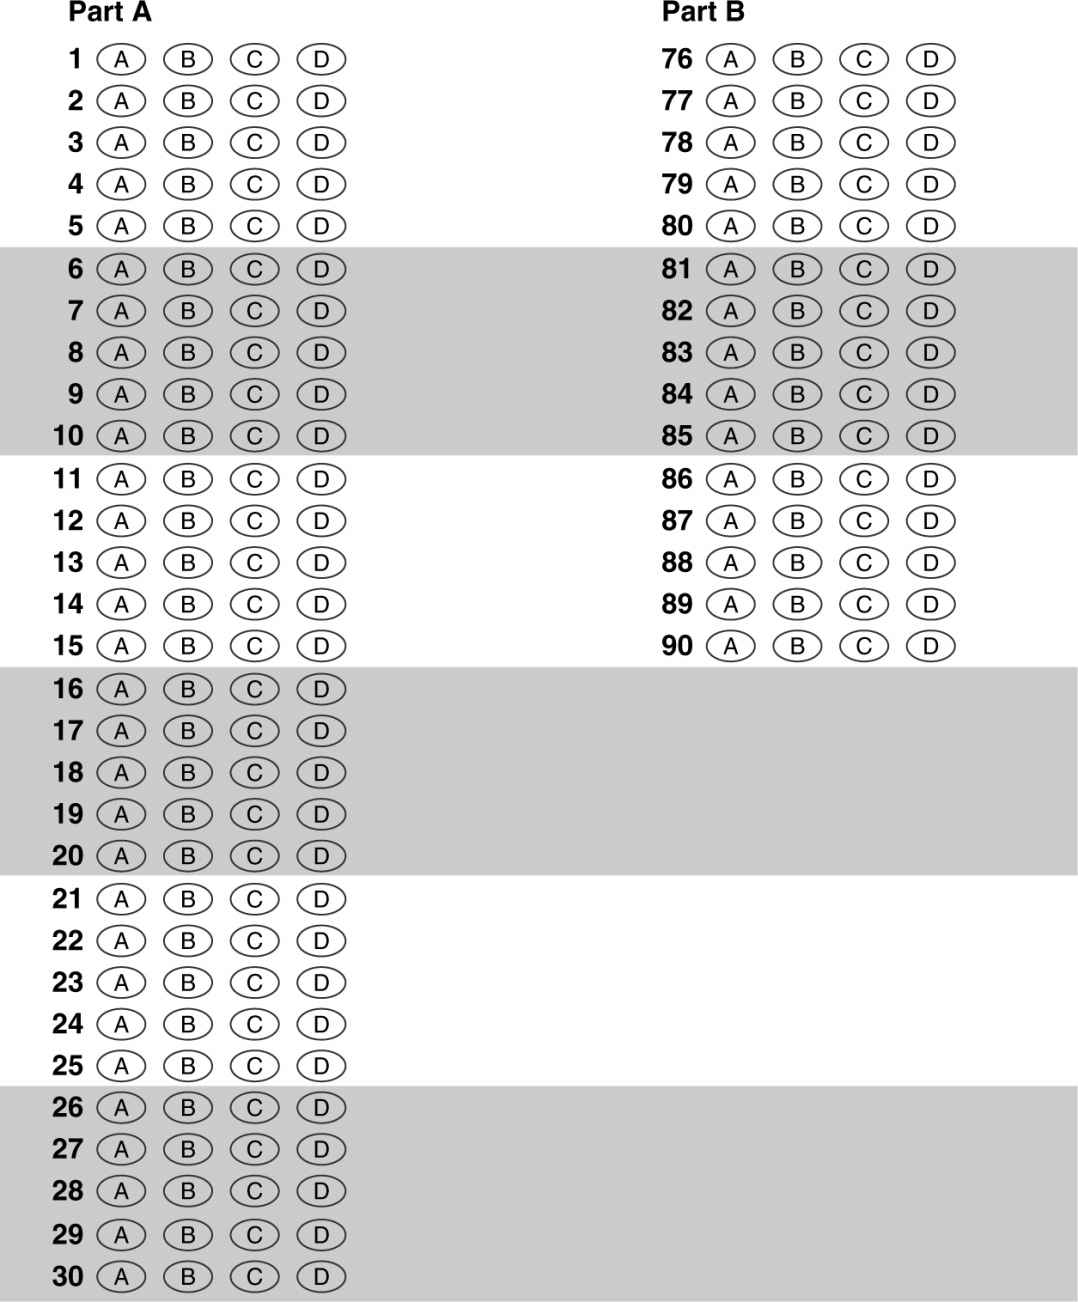
Section I—Part A

Directions:
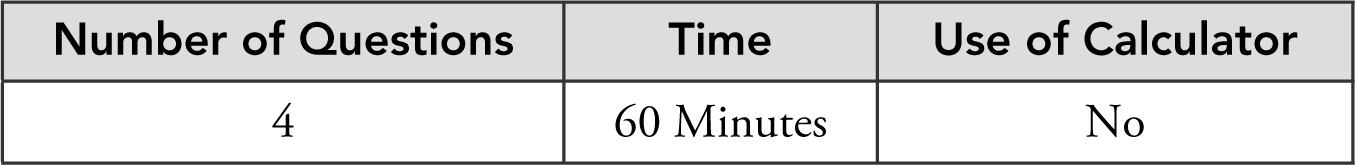
Tear out the answer sheet provided on the previous page and mark your answers on it. All questions are given equal weight. Points are not deducted for incorrect answers and no points are given to unanswered questions. Unless otherwise indicated, the domain of a function f is the set of all real numbers. The use of a calculator is not permitted in this part of the exam.
1 . 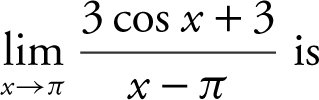
(A) −3
(B) 
(C) 0
(D) 3
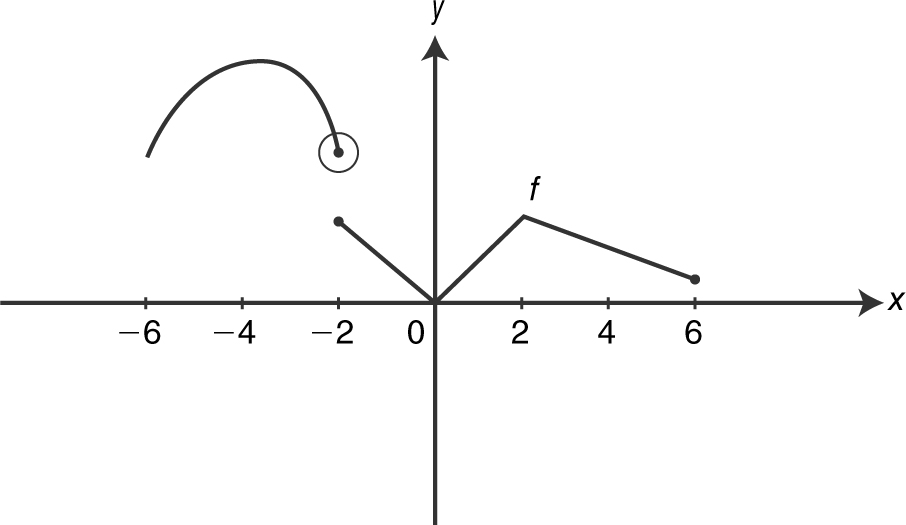
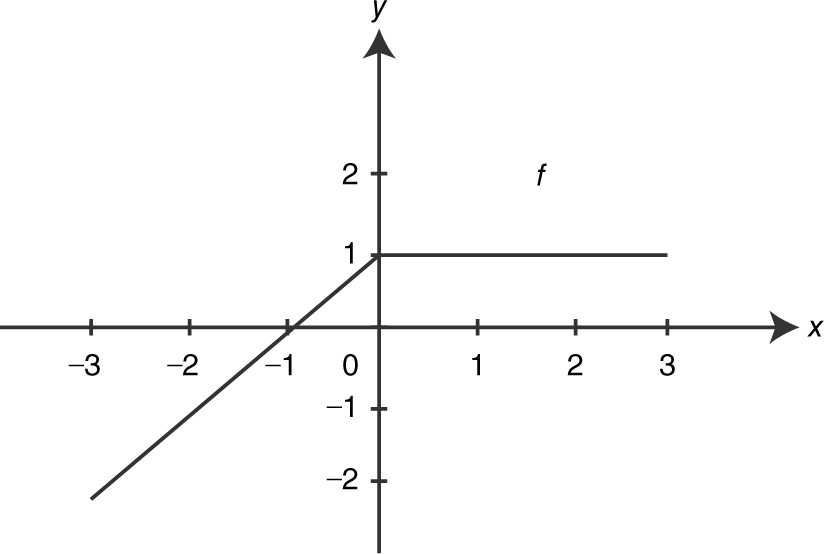
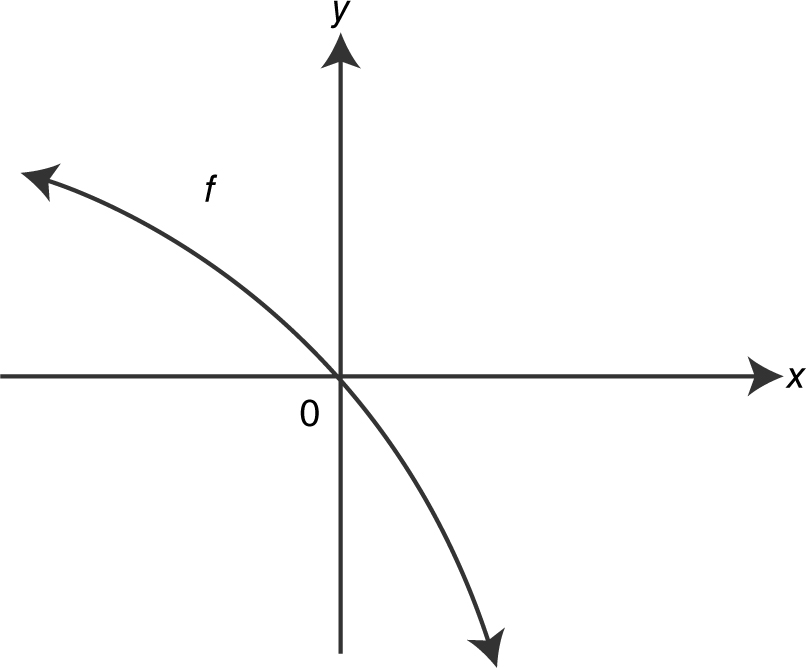
2 . The figure above shows the graph of a piecewise function. The graph has a horizontal tangent at x = −4. What are all the values of x , such that −6 < x < 6, at which f is continuous but not differentiable?
(A) x = −2
(B) x = −4 and x = 0
(C) x = −2 and x = 0
(D) x = −0, and x = 2
3 . 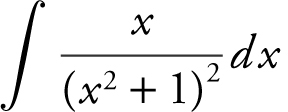
(A) 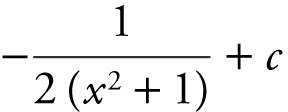
(B) 
(C) 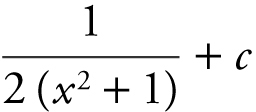
(D) 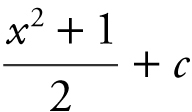
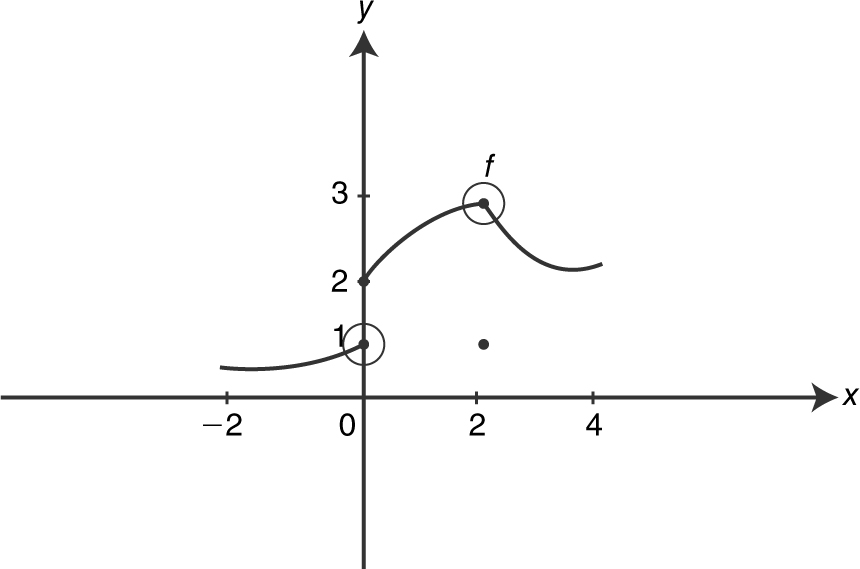
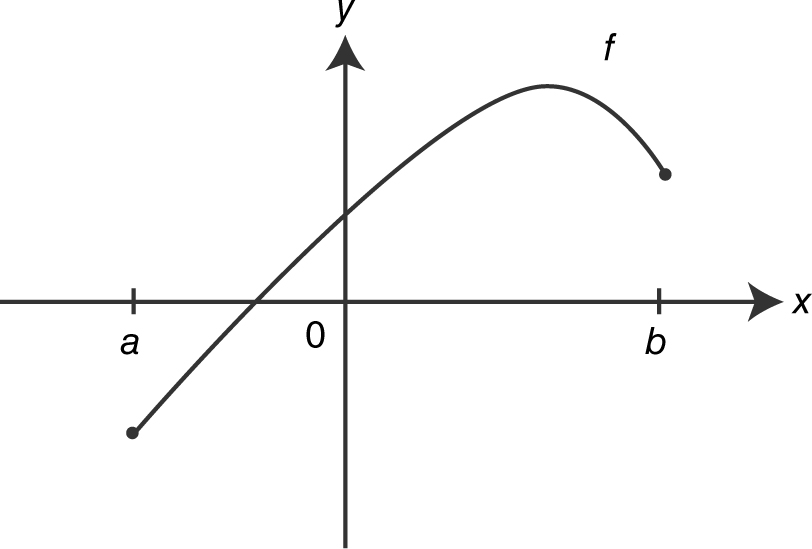
4 . The diagram above shows the graph of a function f for −2 ≤ x ≤4. Which of the following statements is/are true?
I. 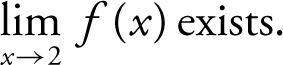
II. 
III. 
(A) I only
(B) II only
(C) I and II only
(D) I, II, and III
5 . 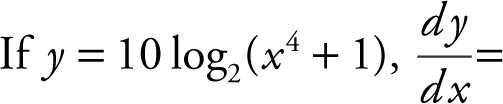
(A) 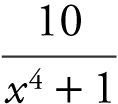
(B) 
(C) 
(D) 
6 . 
(A) 
(B) 
(C) 
(D) 3 x 2−3 + c
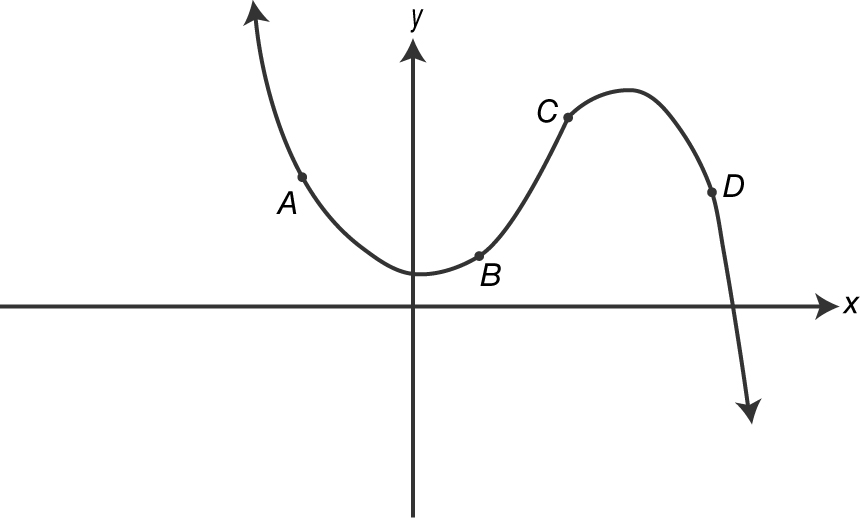
7 . In the figure above, which of the four given points on the graph is  and
and 
(A) A
(B) B
(C) C
(D) D
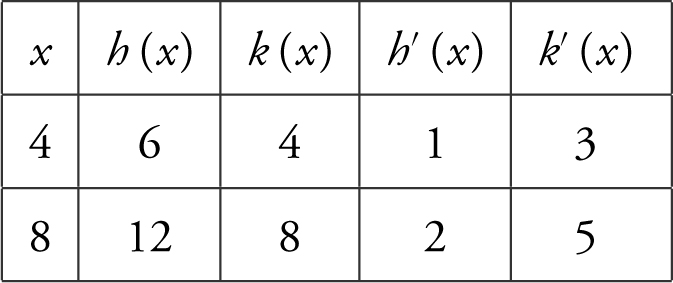
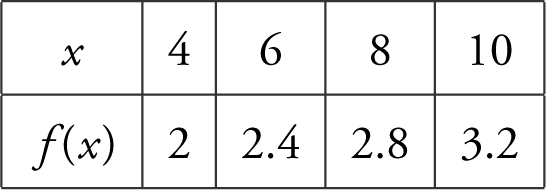
8 . The table above shows the values of the functions h and k and their derivatives at x = 4 and x = 8. What is the value of 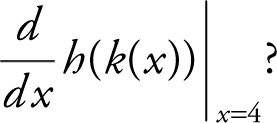
(A) 3
(B) 4
(C) 12
(D) 24
9 . If 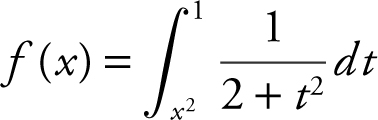 , then f ′(2)=
(A) 
(B) ![]()
(C) ![]()
(D) ![]()
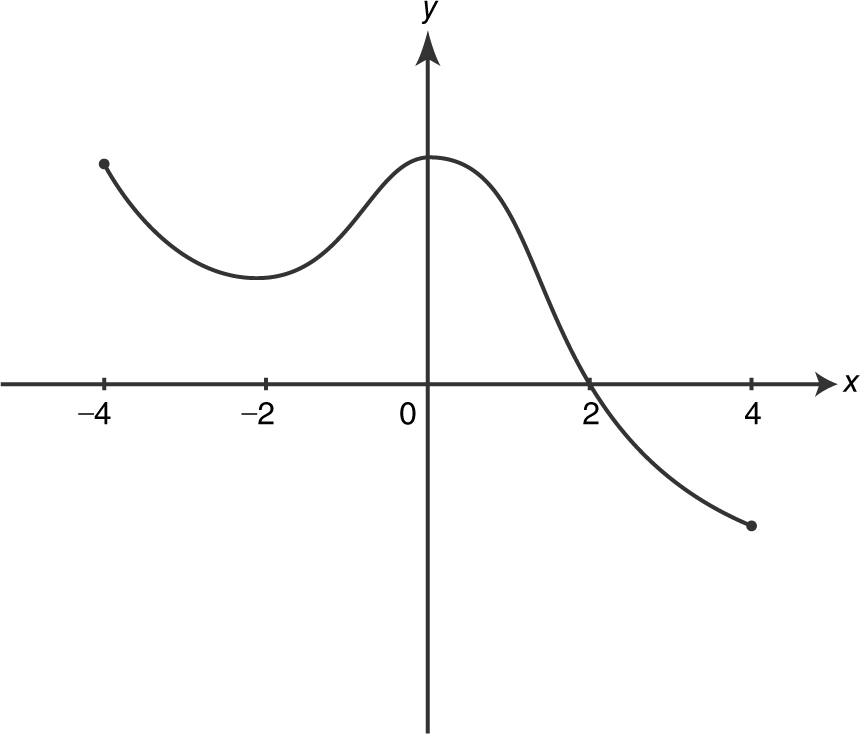
10 . The figure above shows the graph of a continuous function f for −4 ≤ x ≤ 4. On what intervals is f ′(x ) > 0 for all values ofx ?
(A) (−4, 2) only
(B) (−4, −2) and (0, 2)
(C) (−2, 0) only
(D) (0, 4)
11 . If 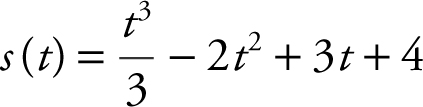 for t ≥ 0 is the position of a moving particle on a straight line, at which of the following intervals of t is the speed of the particle decreasing?
(A) (1, 2) only
(B) (3, ∞) only
(C) (0, 1) and (2, 3)
(D) (1, 2) and (3, ∞)
12 . 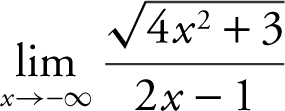
(A) −2
(B) −1
(C) 1
(D) nonexistent
13 . 
(A) −π
(B) 0
(C) ![]()
(D) π
14 . If  is
is
(A) 6
(B) 9
(C) ![]()
(D) 18
15 . Given the function f (x ) = x 3 − 3x 2 + 3x − 1, which of the following statements is true?
(A) The graph of f has a relative minimum at x = 1.
(B) The graph of f has a relative maximum at x = 1.
(C) The graph of f has a point of inflection x = 1.
(D) The graph of f has a relative minimum at x = 0.
16 . If  and
and  , what is the value of
(A) −14
(B) −6
(C) 6
(D) 8
17 . What is the slope of the tangent line to the curve 2x 2 y − 3xy 2 − 2 = 0 at the point (2, 1)?
(A) 
(B) 
(C) ![]()
(D) ![]()
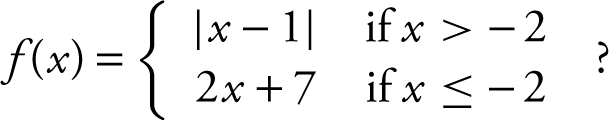
18 . If f is a piecewise function defined as  , which of the following statements is/are true?
I. 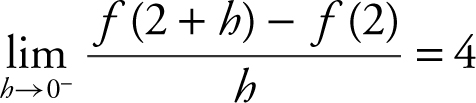
II. 
III. f ′(2) = 4
(A) None
(B) I only
(C) II only
(D) I, II, and III
19 . Air is pumped into a spherical balloon at the rate of 10 cubic centimeters per second. How fast is the diameter, in centimeters per second, increasing when the radius is 5 cm? (The volume of a sphere is  .)
.)
(A) 
(B) 
(C) ![]()
(D) 5π
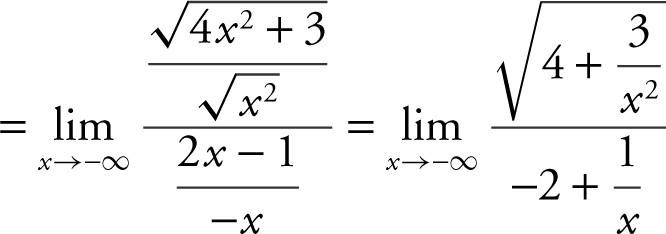
20 . 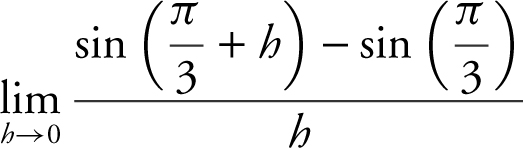 is
is
(A) 0
(B) ![]()
(C) 1
(D) 
21 . The area of the region bounded by the curves of y = −x 2 and y = x is
(A) 
(B) ![]()
(C) ![]()
(D) 6
22 . 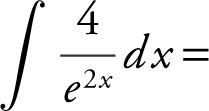
(A) 
(B) 
(C) 
(D) 4e 2x + c
23 . If 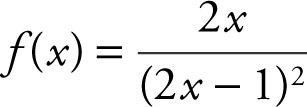 , then f ′(x )=
(A) 
(B) 
(C) 
(D) 
24 . Let f and g be differentiable functions such that f −1 (x ) = g (x ) for all x . The table below shows selected values of f (x ) and f ′(x ). What is the value of g ′(2)?
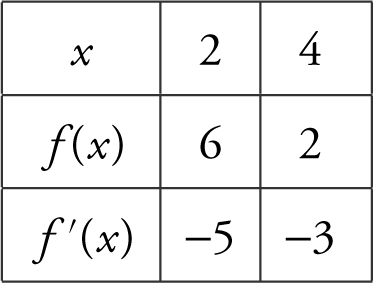
(A) −5
(B) −3
(C) 
(D) 2
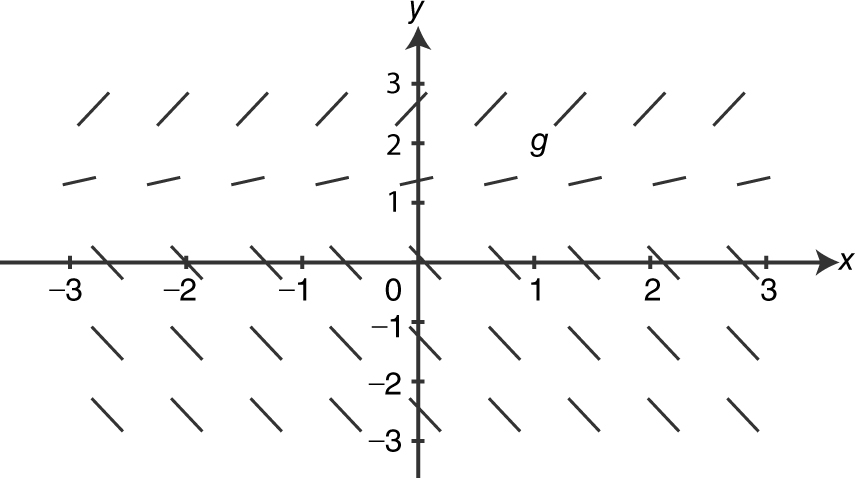
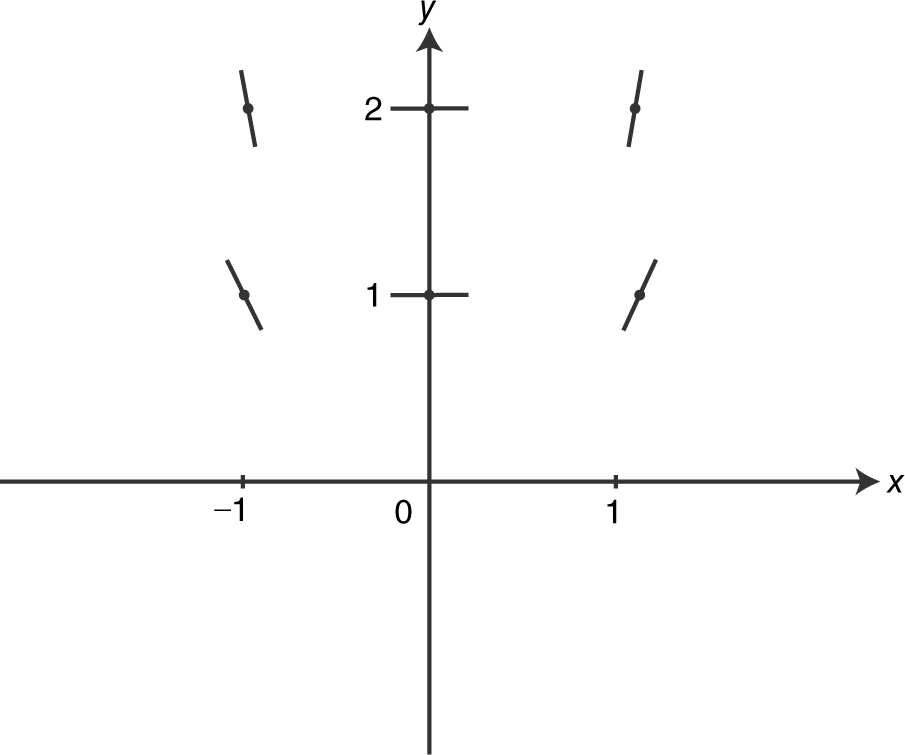
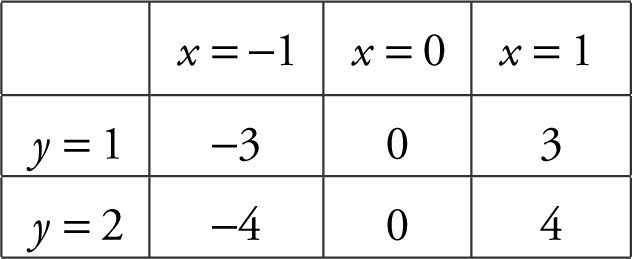
25 . The figure above shows the slope field for which of the following differential equations?
(A) 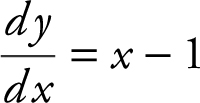
(B) 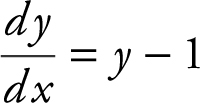
(C) 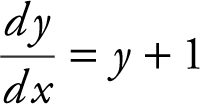
(D) 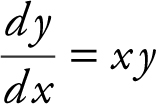
26 . Let f be a continuous and twice differentiable function and f ″(x ) 0 for all x in the interval [4, 5]. Some of the values of f are shown in the table below.
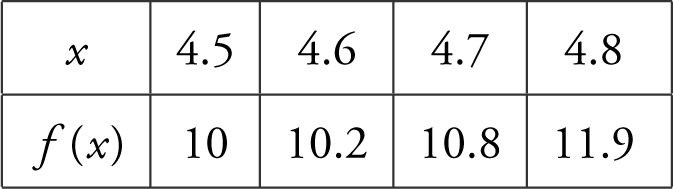
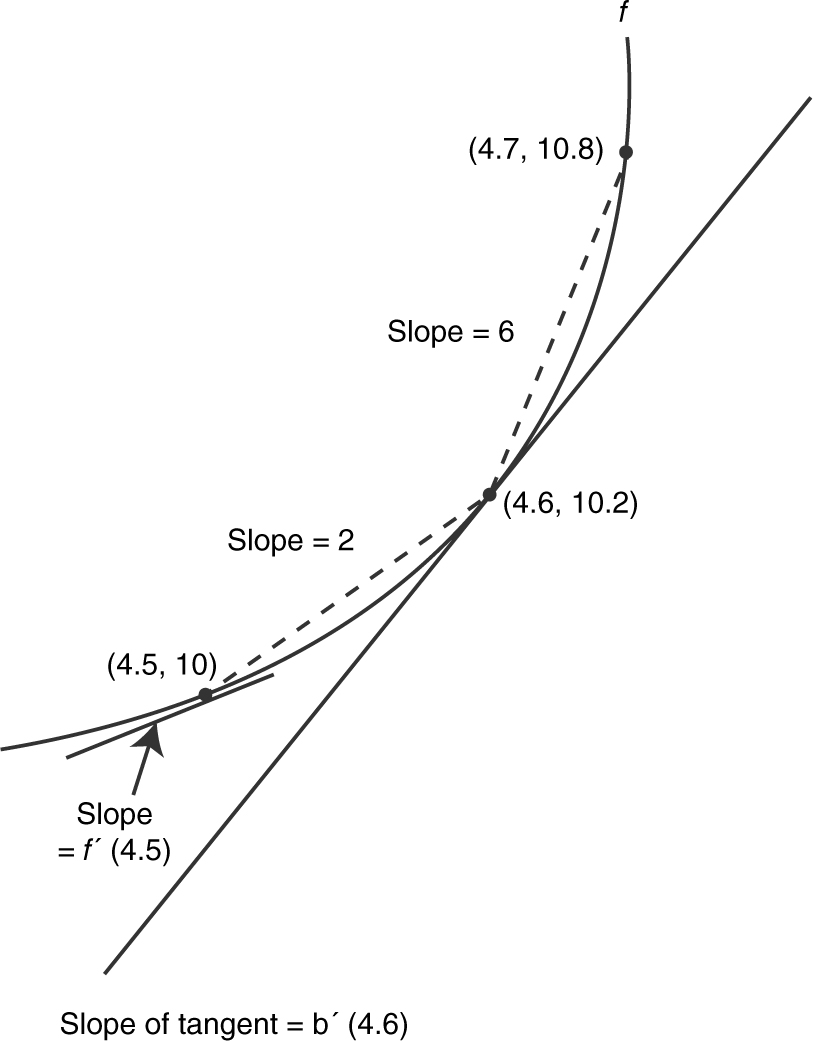
Which of the following is true about f ′(4.6)?
(A) f ′(4.6) < 2
(B) f ′(4.6) > 6
(C) 0.2 < f ′(4.6) < 0.6
(D) 2 < f ′(4.6) < 6
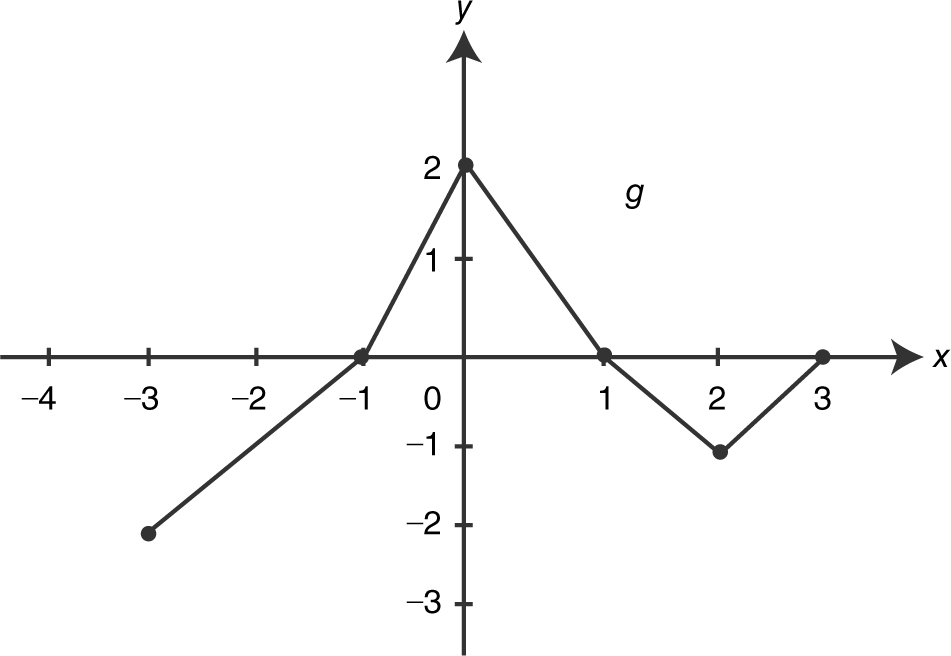
27 . The graph of a function f is shown in the figure above. The graph of f consists of two line segments, and f is continuous on the interval [−3, 3]. If  , then g (−3) is
(A) 
(B) 1
(C) ![]()
(D) ![]()
28 . The solution to the differential equation  where y (0) = e is
(A) 
(B) y = e 3x
(C) y = −e 3x +1
(D) y = e (3x +1)
29 . The graph of a continuous function y = f (x ) passes through the point (e , 4) and  . Which of the following is the function f (x )?
(A) y = 3 ln x + e
(B) y = 3 ln x + 1
(C) y = ln x + 4
(D) y = e x + 4
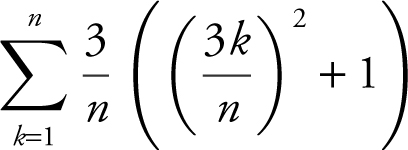
30 . The definite integral 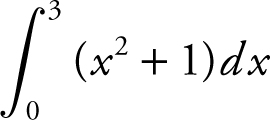 is equivalent to which of the following limits?
(A) 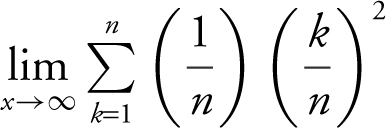
(B) 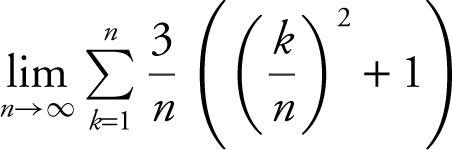
(C) 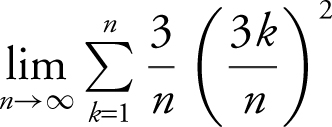
(D) 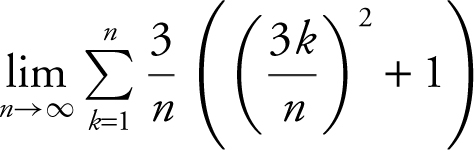
STOP. AP Calculus AB Practice Exam 1, Section I—Part A.
Section I—Part B

Directions:
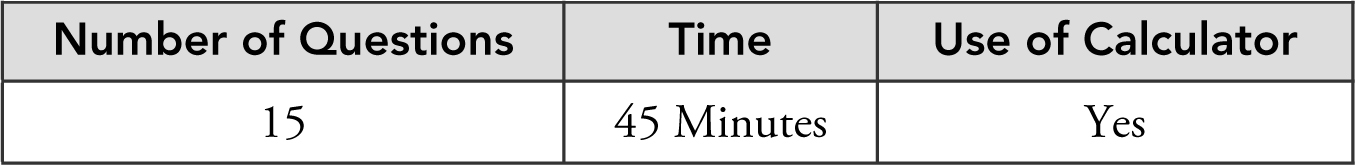
Continue using the same answer sheet. Please note that the questions begin with number 76 . This is not an error; it was done to be consistent with the numbering system of the actual AP Calculus AB exam. All questions are given equal weight. Points are not deducted for incorrect answers and no points are given to unanswered questions. Unless otherwise indicated, the domain of a functionf is the set of all real numbers. If the exact numerical value does not appear among the given choices, select the best approximate value. The use of a calculator is permitted in this part of the exam.
76 . Given that 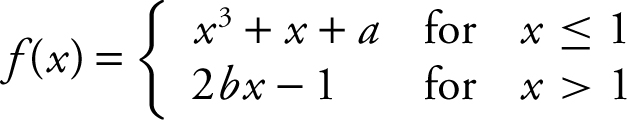 , if f is differentiable at x = 1, what is the value of a + 2b ?
(A) 2
(B) 3
(C) 4
(D) 5
77 . If g ′(x ) = cos(π )x 2 + 1) and  , then g (2)=
(A) −0.681
(B) −0.319
(C) 0.181
(D) 0.681
78 . The point (−2, 5) is on the graph of a differential function f , and f −2) = 3. What is the estimate for f (−1.9), using local linear approximation for f at x = −2?
(A) −16.7
(B) −6.7
(C) −4.7
(D) 5.3
79 . If a function f has its derivative f ′(x ) given as f ′(x ) = −3e −x cos x + 2 for −2 < x < 2, on what interval(s) is f increasing?
(A) (−1.0407, 0.345)
(B) (0, 0.345)
(C) (−2, 0)
(D) (−2, − 1.407) and (0.345, 2)
80 . A particle moving in a straight line has a velocity of v (t ) = 2−t cos (2t ) feet per minute. What is the total distance in feet traveled by the particle when 0 ≤t ≤ 3 minutes? (A) 0.096 (B) 0.121
81 . How many points of inflection does the graph of  have on the intervals (0, 2π)?
(A) 0
(B) 1
(C) 2
(D) 3
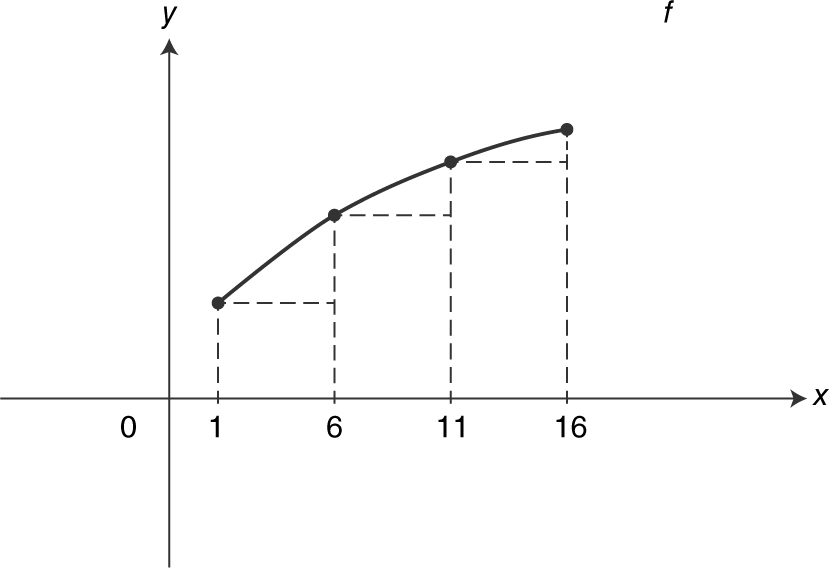
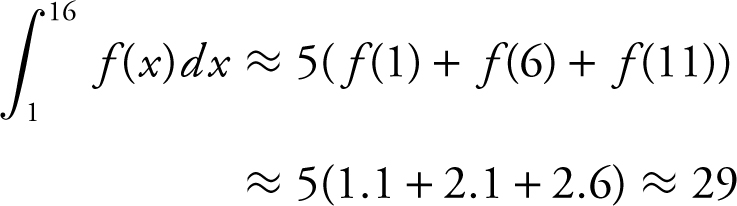
82 . The table below shows selected values of a continuous function f on the closed interval [1,16].
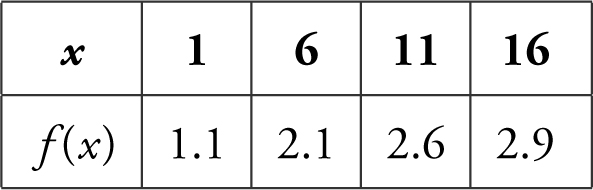
Using three left endpoint rectangles of equal length (LRAM ), what is the approximate value of 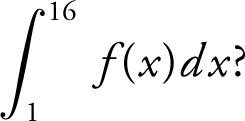
(A) 16.5
(B) 29
(C) 33.5
(D) 38
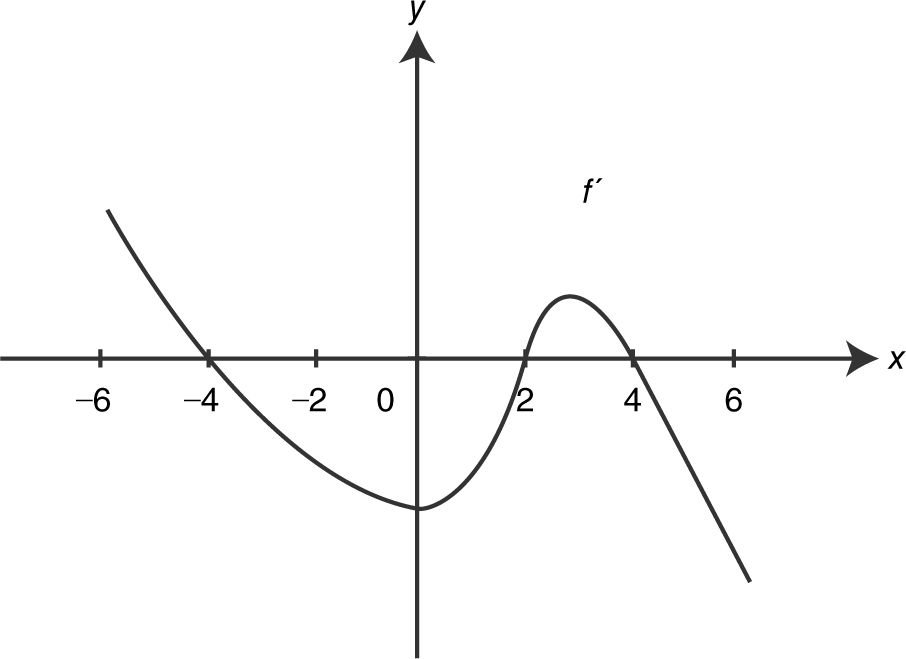
83 . The figure above shows the graph of the derivative of a function f . Which of the following could be the graph of f ?
(A) 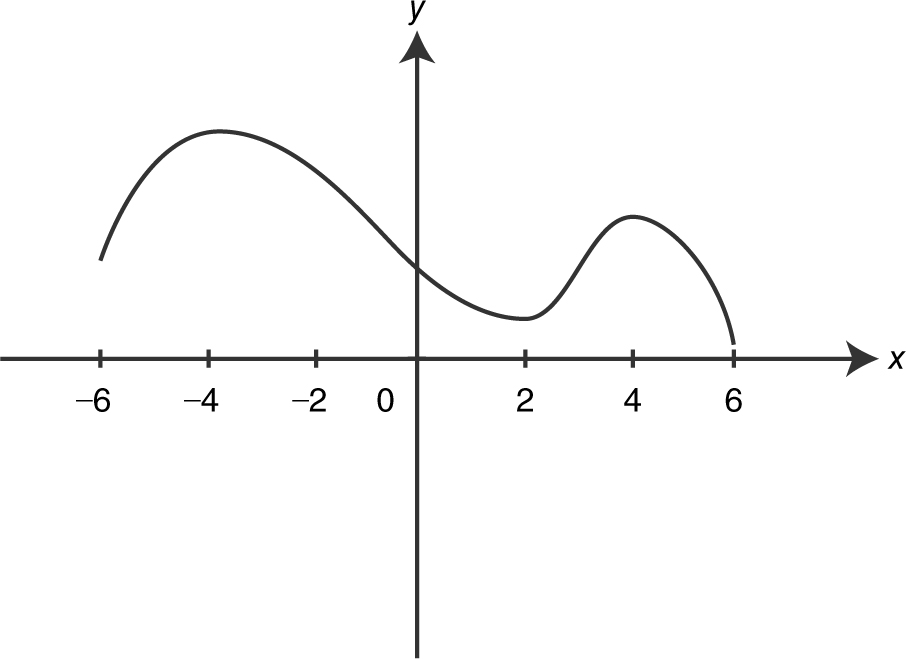
(B) 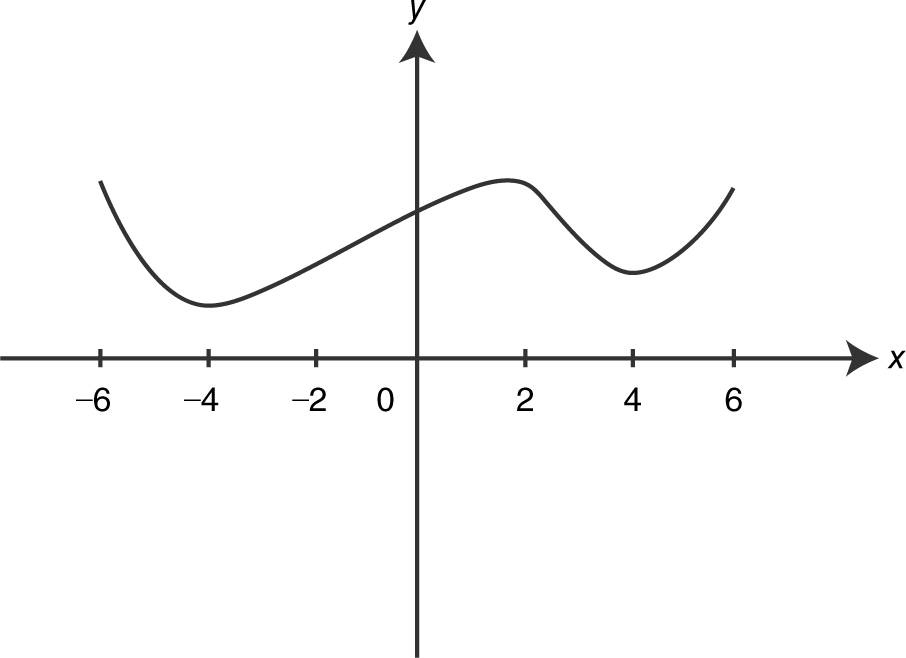
(C) 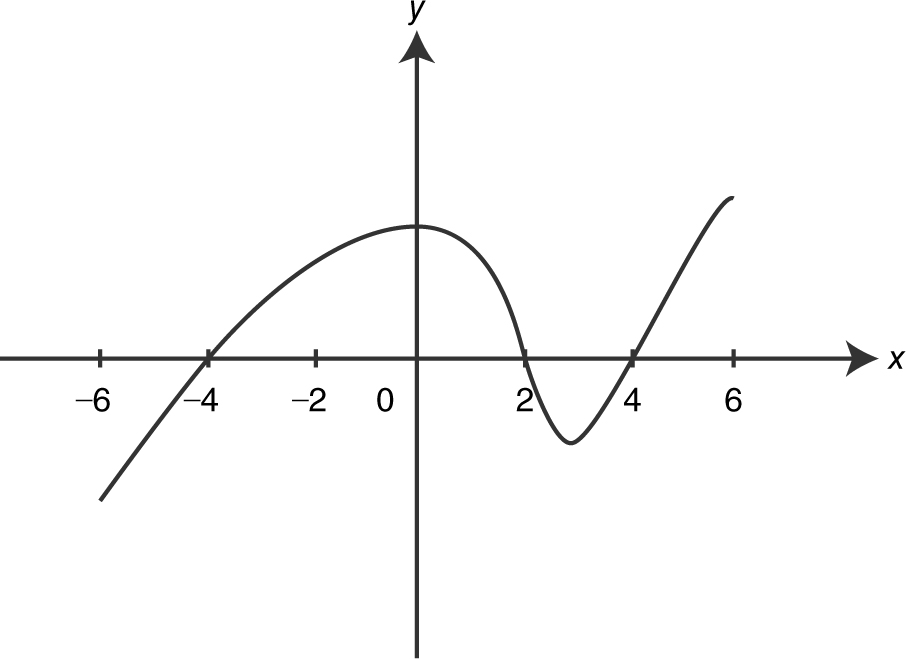
(D) 
84 . A wire 40 centimeters long is being cut into two pieces to make a circle and a square. If the total area of the circle and the square is a minimum, how much wire, in centimeters, should be used for the circle?
(A) 17.596
(B) 22.404
(C) 40
(D) 56.010
85 . Given that f (x ) = arccos(2x ), what is the slope of the tangent to the graph of f at x = 0?
(A) −2
(B) 0
(C) 1
(D) 2
86 . A solid is generated by revolving, about the x -axis, the region bounded by the curves y = x 3 − 2x + 1 and y = x + 2 in the second quadrant. The volume of the solid is
(A) 2.241
(B) 7.039
(C) 10.348
(D) 16.279
87 . A function f is given as f (x ) = x 3 + 1 for 1 ≤ x ≤ 3. If 1 ≤ c ≤ 3 and f ′(c ) is equal to the average rate of change of f on the interval [1, 3], what is the value of c ?
(A) 
(B) 
(C) 6.5
(D) 13
88 . The velocity of a particle moving on a straight line is given as v (t ) = cos(t )(e sin(t ) ) for t ≥ 0. At  , what is the acceleration of the particle?
(A) −2.718
(B) −1.346
(C) −0.420
(D) 1.434
89 . The region, in the first quadrant, bounded by the graph of y = cos(x ), the x -axis, and the y -axis, is divided by the line x = k into two regions of equal area. What is the value of k ?
(A) ![]()
(B) ![]()
(C) ![]()
(D) ![]()
90 . In a given petri dish, the number of bacteria grows at approximately the rate of ![]() bacteria per day, wheret is the number of days since the culture in the petri dish began. At day two, there are 150 bacteria. Which of the following is the best approximation for the number of bacteria at day five?
bacteria per day, wheret is the number of days since the culture in the petri dish began. At day two, there are 150 bacteria. Which of the following is the best approximation for the number of bacteria at day five?
(A) 623
(B) 638
(C) 773
(D) 788
STOP. End of AP Calculus AB Practice Exam, Section I—Part B.
Section II Part A
Directions:
Show all your work . You may not receive any credit for correct answers without supporting work. You may use an approved calculator to help solve a problem. However, you must clearly indicate the setup of your solution using mathematical notations and not calculator syntax. Calculators may be used to find the derivative of a function at a point, compute the numerical value of a definite integral, or solve an equation. Unless otherwise indicated, you may assume the following: (a) the numeric or algebraic answers need not be simplified; (b) your answer, if expressed in approximation, should be correct to 3 places after the decimal point; and (c) the domain of a function f is the set of all real numbers.
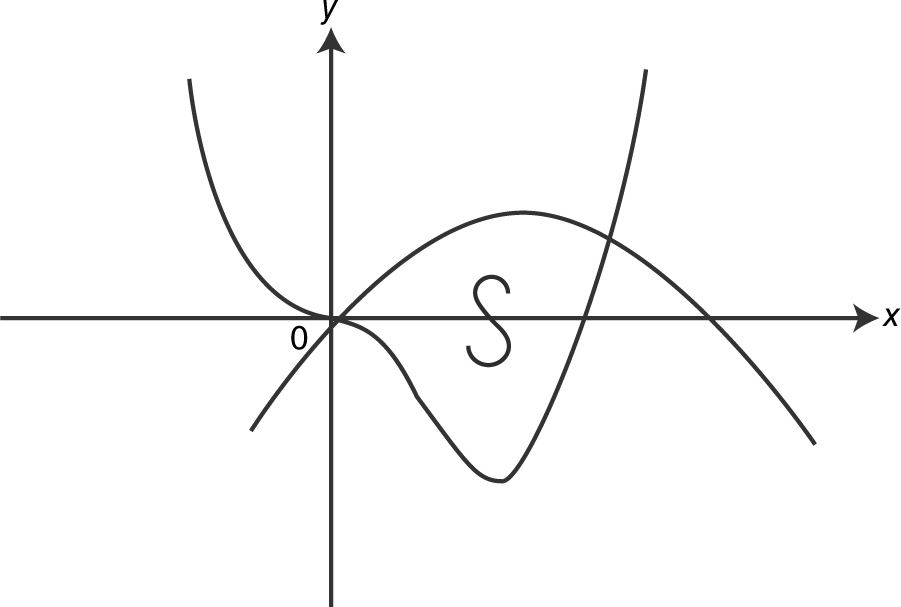
1 . As shown in the figure above, S is the region enclosed by the graphs of y = 2x 4 − 5x 3 and y = 4x − x 2 .
(A) Find the area of the region S.
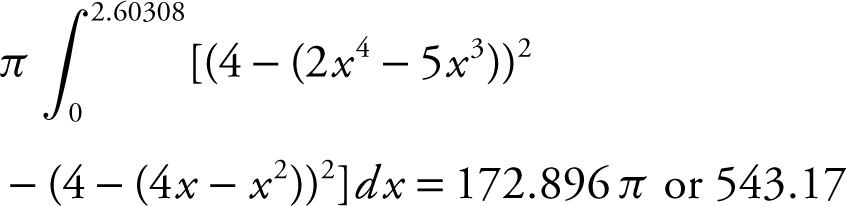
(B) Find the volume of the solid generated when the region S is revolved about the line y = 4.
(C) If region S is the base of a solid, the height of the solid for all points in S at a distance x from the y -axis is given as h (x ) = 0.5 + 2x . Find the volume of the solid.
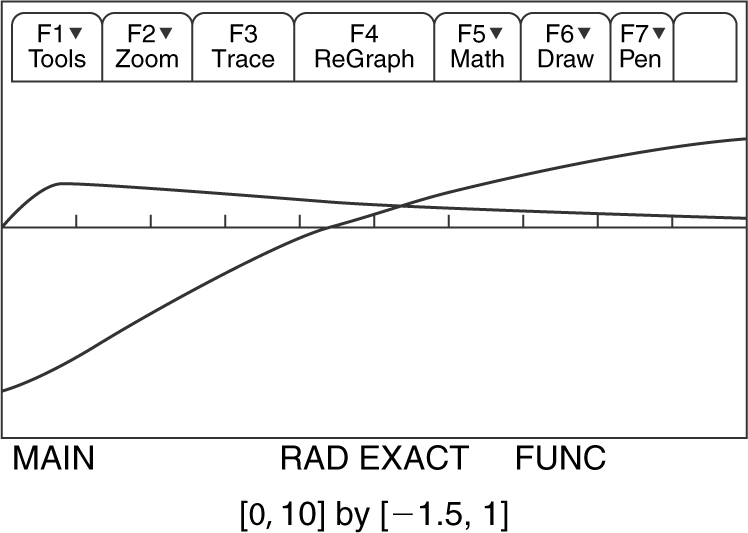
2 . A particle is moving along the x -axis. For 0 ≤t ≤ 10, the acceleration of the particle is given by 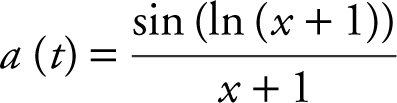 . At t = 0, the velocity of the particle is v (0) = −1.1.
(A) Find the velocity of the particle at t = 4.
(B) For 0 ≤ t ≤ 10, at what time interval is the speed of the particle increasing?
(C) For 0 ≤ t ≤ 10, what is the average velocity of the particle?
(D) For 0 ≤ t ≤ 10, find the total distance traveled by the particle.
STOP. End of AP Calculus AB Practice Exam, Section II—Part A.
Section II—Part B
Directions:
The use of a calculator is not permitted in this part of the exam. You should show all work . You may not receive any credit for correct answers without supporting work. Unless otherwise indicated, the numeric or algebraic answers need not be simplified, and the domain of a function f is the set of all real numbers. When you have finished this part of the exam, you may return to the problems in Part A of Section II and continue to work on them. However, you may not use a calculator.
3 . Given the differential equation 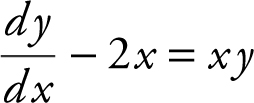 .
.
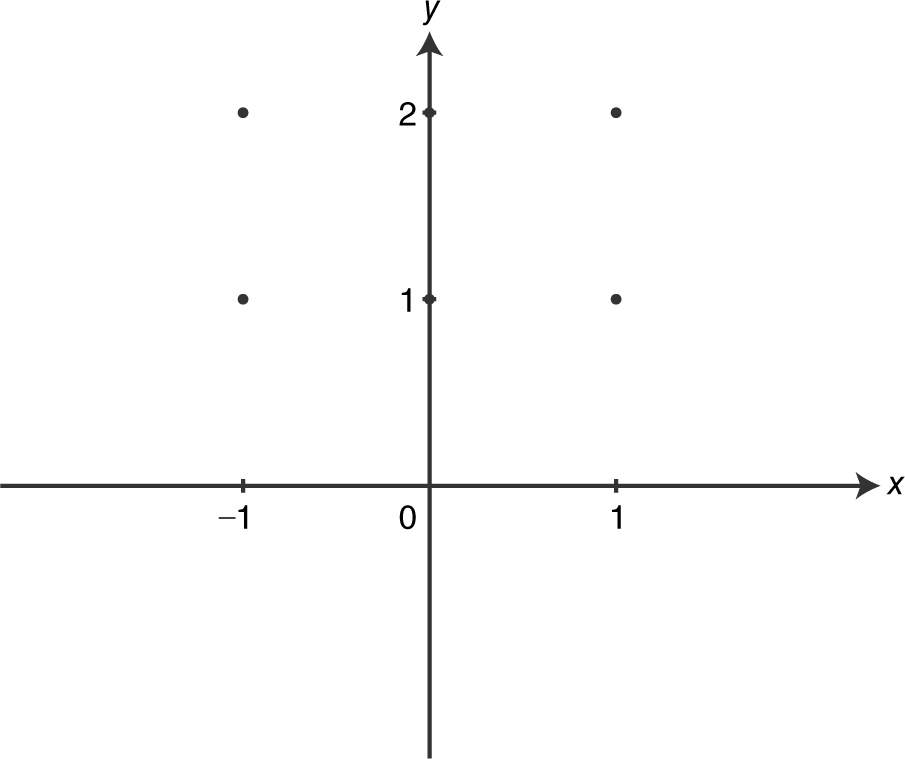
(A) On the axes provided in the figure above, sketch a slope field at the six indicated points.
(B) Let y = f (x ) be the particular solution to the differential equation with the initial condition f (0) = 1. Write an equation of the tangent line to the solution curve at the point (0, 1).
(C) Using the equation of the tangent line in part (b), find the approximate value of f (0.02).
(D) Find y = f (x ) with f (0) = 1.
4 . Let f be a continuous function on the interval [−2, 6], and f is twice differentiable with f ″(x ) < 0 on (−2, 6).
Selected values of f are shown below.
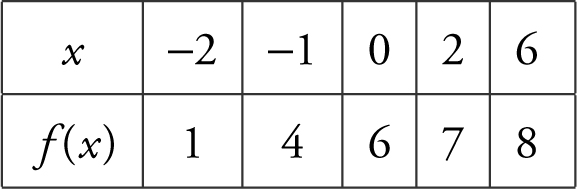
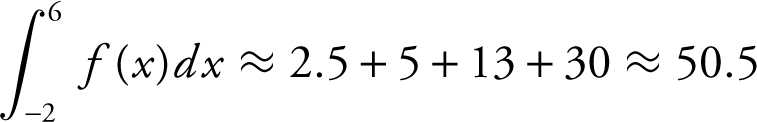
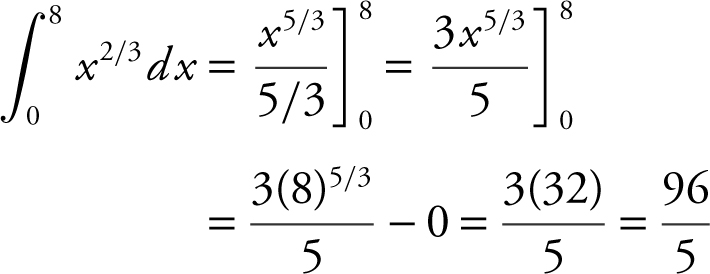
(A) Using trapezoidal approximation with four trapezoids, find the approximate value of 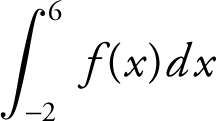 .
.
(B) Using the result in part (a), find the average value of f on [−2, 6].
(C) Find the average rate of change of f over the interval [−2, 6].
(D) Examine f ′(0) and f ′(2), and determine if f ′(0) is greater than, less than, or equal to f ′(2). Explain.
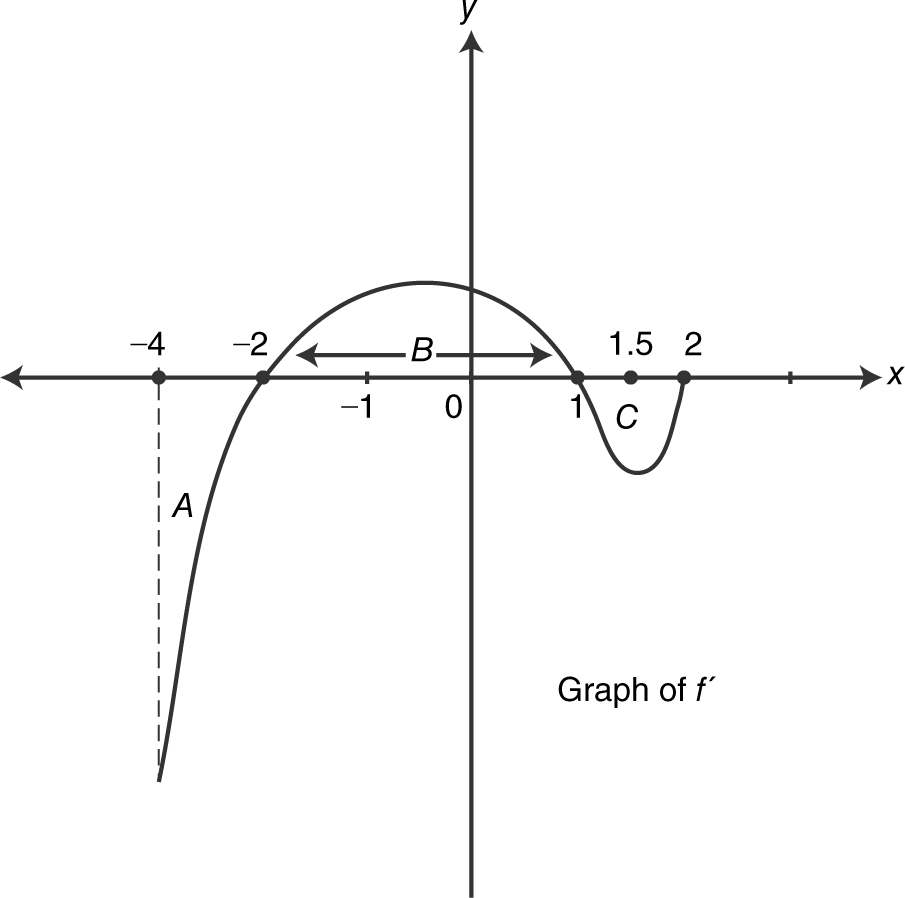
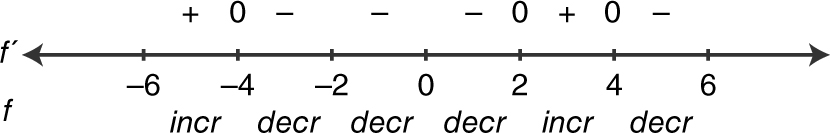
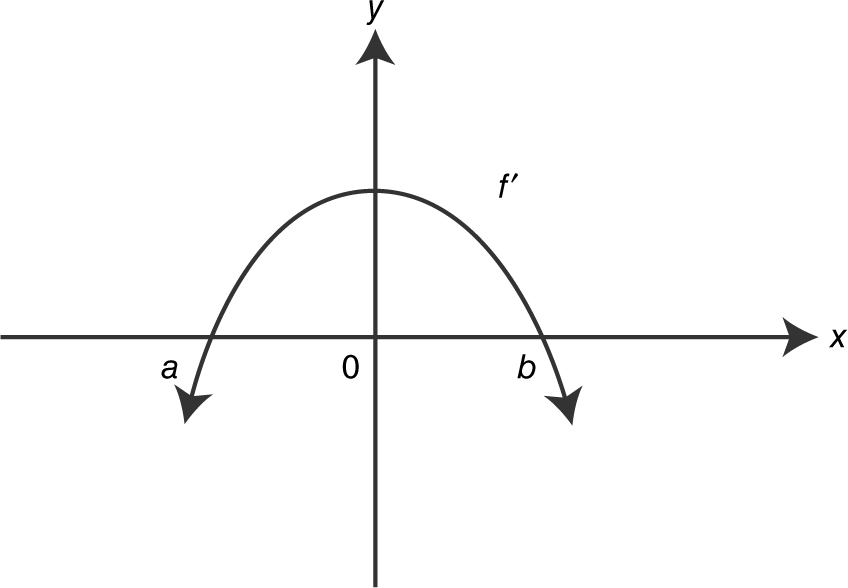
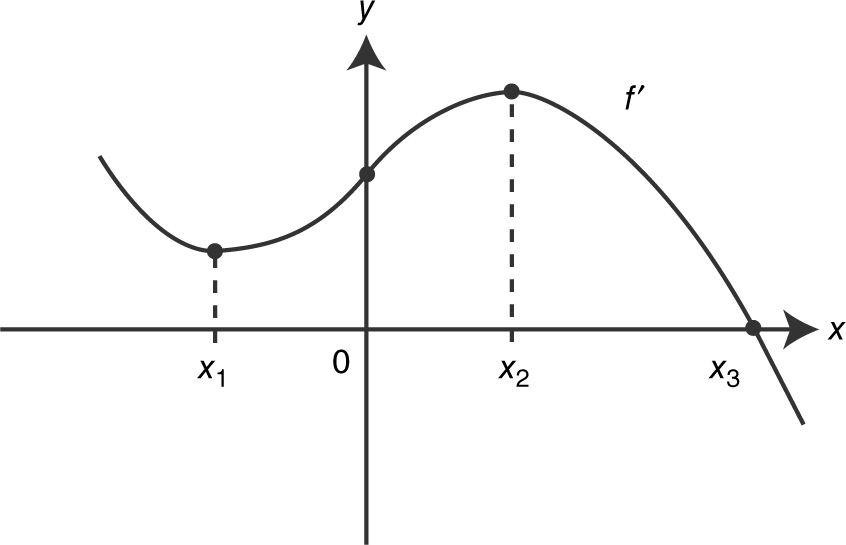
5 . A function f is continuous and twice differentiable for all values of x . The figure above shows the graph of f ′, the derivative of function f on the closed interval [−4, 2]. The graph of f ′ has horizontal tangents at x = −1 and x = 1.5. The areas of regions A , B , and C are 20, 10, and 6, respectively, and f (2) = 3.
(A) Find all x -values on (−4, 2) such that the function f has a local minimum. Justify your answer. (B) Find allx -values on (−4, 2) such that the graph of f has a point of inflection. Justify your answer.
(B) Find all x -values on (−4, 2) such that the graph of f has a point of inflection. Justify your answer.
(C) Evaluate 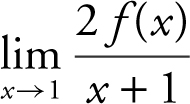 . Explain your reasoning.
(D) Evaluate 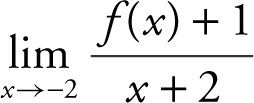 . Explain your reasoning.
6 . The equation of a curve is given as 14y − y 2 = x 2 + 24.
(A) Find  in terms of x and y .
(B) Write an equation of the line tangent to the curve at the point (−3, 11).
(C) Write an equation of each vertical tangent to the curve.
(D) Evaluate  at the point (0, 2).
STOP. End of AP Calculus AB Practice Exam, Section II−Part B.
Answers to AB Practice Exam 1—Section I
Part A
1 . C
2 . D
3 . A
4 . C
5 . C
6 . A
7 . C
8 . A
9 . A
10 . C
11 . C
12 . B
13 . D
14 . B
15 . C
16 . C
17 . D
18 . B
19 . B
20 . B
21 . B
22 . B
23 . D
24 . C
25 . B
26 . D
27 . C
28 . D
29 . B
30 . D
Part B
76 . D
77 . D
78 . D
79 . D
80 . D
81 . D
82 . B
83 . A
84 . A
85 . A
86 . B
87 . A
88 . C
89 . A
90 . C
Answers to AB Practice Exam 1—Section II
Part A
1 . 
2 . 
Part B
3 . 
4 . 
5 . 
6 . 
Solutions for AP Calculus AB Practice Exam 1—Section II
Section I Part A
1 . The correct answer is (C).
Note that  , and
, and  . Therefore, the
  is an indeterminate form of the type
 ![]() . Applying L’Hôpital’s Rule, you have
. Applying L’Hôpital’s Rule, you have  .
.
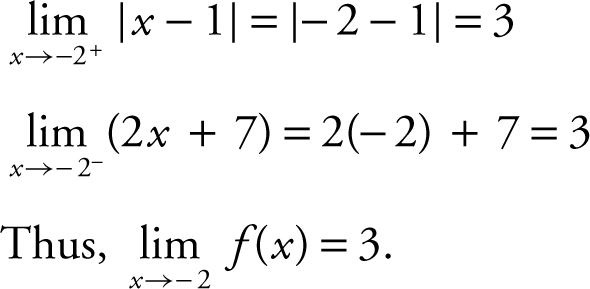
2 . The correct answer is (D).
At x = −4, the graph of f has a horizontal tangent, which implies that f is differentiable and f ′(−4) = 0.
At x = −2, f is discontinuous and thus not differentiable. At each of x = 0 and x = 2, the one-sided derivatives are different, so f is not differentiable. (Note that the graphs at x = 0 and x = 2 are sometimes referred to as “corners”.)
3 . The correct answer is (A).
Using the u -substitution method, let u = x 2 + 1, and obtain du = 2x dx , or  . Therefore,
 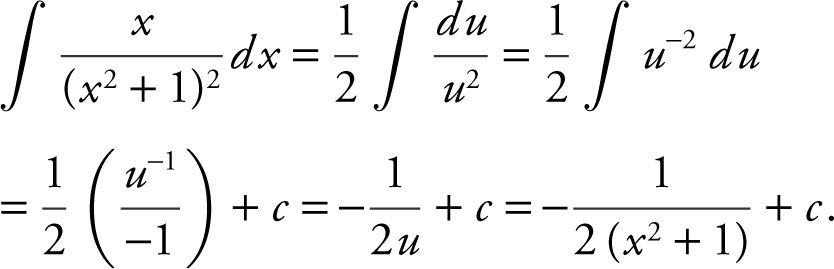 .
.
4 . The correct answer is (C).
Examining the graph, note that  . Since the two one-sided limits are equal,
  exists. Statement I is true. Also, note that
  . and
. and  . Therefore, statement II is true, but statement III is false because the two one-sided limits are not the same.
5 . The correct answer is (C).
Recall the formula 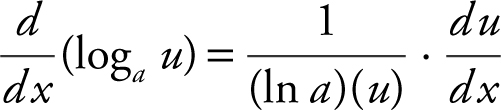 . In this case, y = 10 log2 (x 4 + 1), and you have
 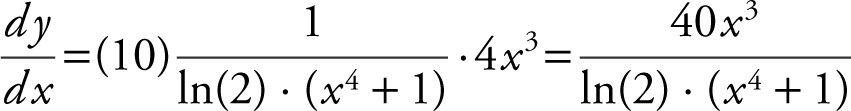 .
.
6 . The correct answer is (A).
Let u = x 2 − 4. Differentiating, you have  . Using u -substitution, rewrite
  . Recall the formula
  . Therefore,
  .
.
7 . The correct answer is (C).
If a function is increasing, then  , and if a function is decreasing,
 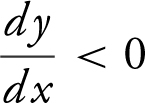 . Also, if a function is concave up,
 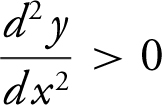 , and if a function is concave down,
 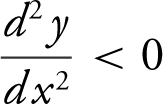 . Note the following:
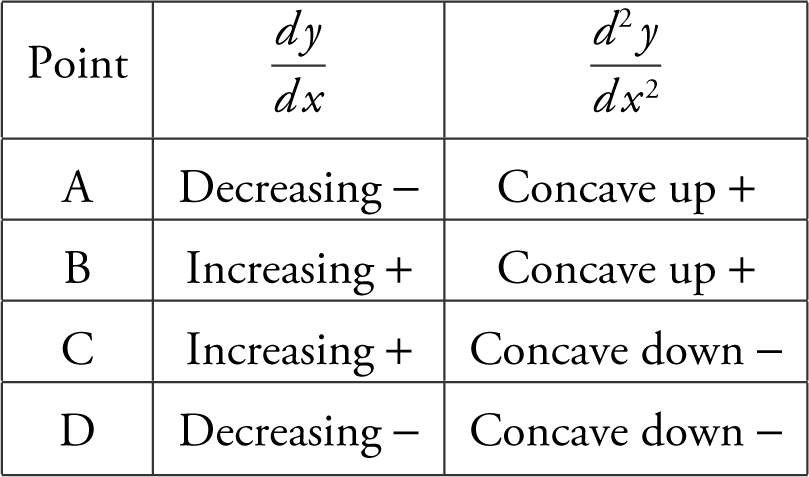
Thus, at point  and
and  .
.
8 . The correct answer is (A).
Note that the notation  is equivalent to (h · k )′(4), the derivative of a composite function, at x = 4. Begin with the chain rule:
 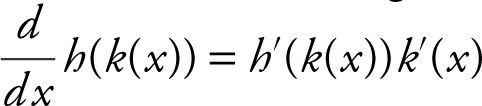 . Therefore,
 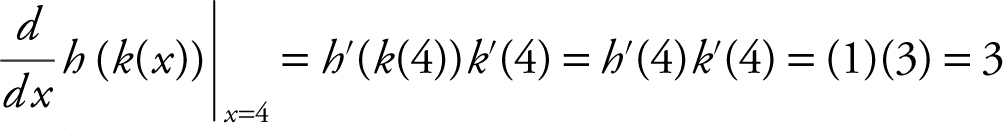 .
.
9 . The correct answer is (A).
Note that 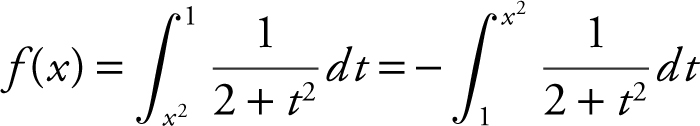 . Applying the Fundamental Theorem of Calculus, you have
 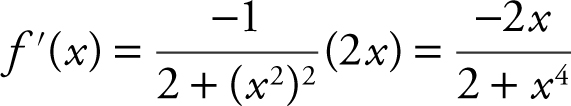 . Thus,
 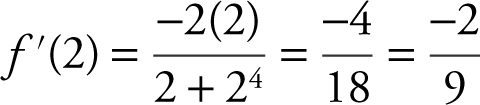 .
.
10 . The correct answer is (C).
Remember that if f is increasing, then f ′(x ) > 0, and that if f is decreasing, then f ′(x ) < 0. Examining the graph of f , you see that f (x ) is increasing on the interval (−2, 0). Therefore, f ′(x ) > 0 on the interval (−2, 0).
11 . The correct answer is (C).
The speed of a moving particle decreases when its velocity and acceleration have opposite signs, e.g., v (t ) > 0 and a (t ) < 0, or v (t ) < 0 and a (t ) > 0. The velocity and acceleration functions are v (t ) = t 2 − 4t + 3 and a (t ) = 2t − 4. Setv (t ) = 0, and obtain t 2 − 4t + 3 = 0 or (t − 3)(t − 1) = 0, which yieldsx = 1 and x = 3. Setting a (t ) = 0, you have 2t − 4 = 0, or t = 2.
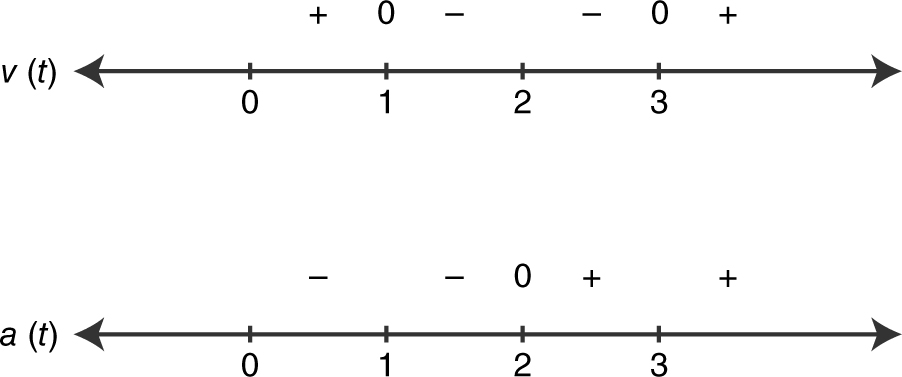
Note that v (t ) and a (t ) have opposite signs on (0, 1) and (2, 3). Thus, the speed of the particle decreases on (0, 1) and (2, 3).
12 . The correct answer is (B).
Note that as x approaches ![]() . Therefore,
. Therefore, 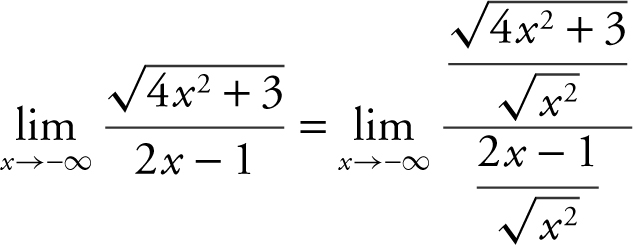
 . Also,
 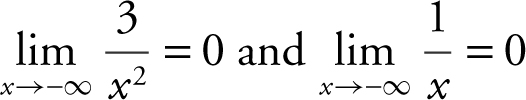 . Thus
 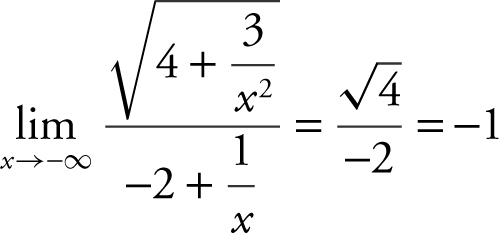 .
.
13 . The correct answer is (D).
Note that the formula 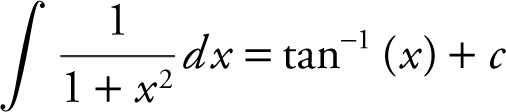 . Therefore,
  .
.
14 . The correct answer is (B).
Using the chain rule, you have f ′ = 24 sin2 (x ). Therefore, 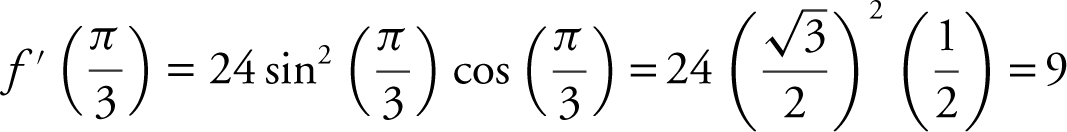 .
.
15 . The correct answer is (C).
The first and second derivatives of f are f ′(x ) = 3x 2 − 6x + 3 and f ′(x ) = 6x − 6. Set f ′(x ) = 0, and you have 3x 2 − 6x + 3 = 0. Solve for x and obtain 3(x 2 − 2x + 1) = 0, or 3(x − 1)(x − 1) = 0, which yields x = 1. Setting f ′(x ) = 0, you have 6x − 6 = 0, or x = 1.
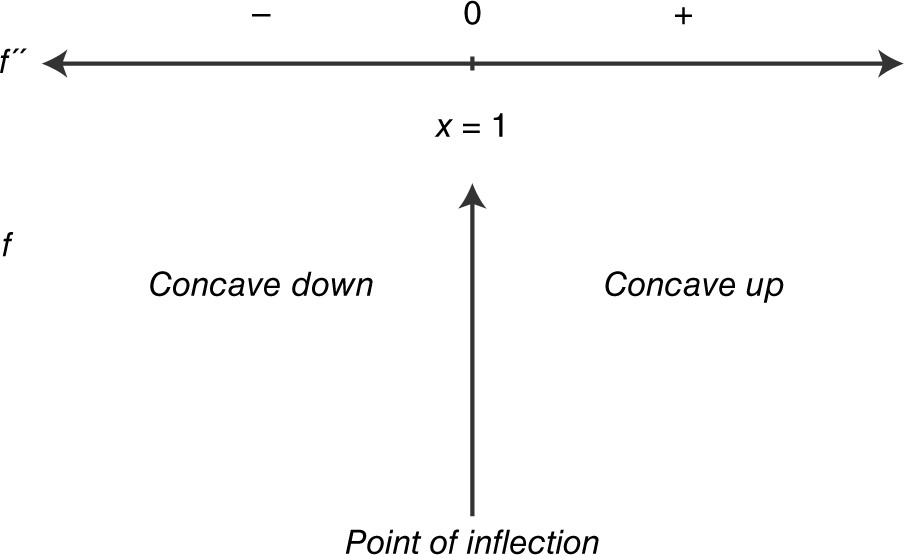
Note that the graph of f changes concavity from down to up. Since f is a differentiable function, it has a point of inflection at x = 1.
16 . The correct answer is (C).
Since  .
.
Also,  .
.
so  .
.
17 . The correct answer is (D).
Using implicit differentiation, you have 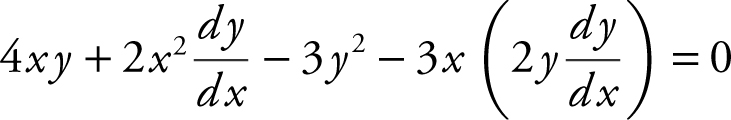 . Substitute x = 2 and y = 1, and obtain
  .
.
18 . The correct answer is (B).
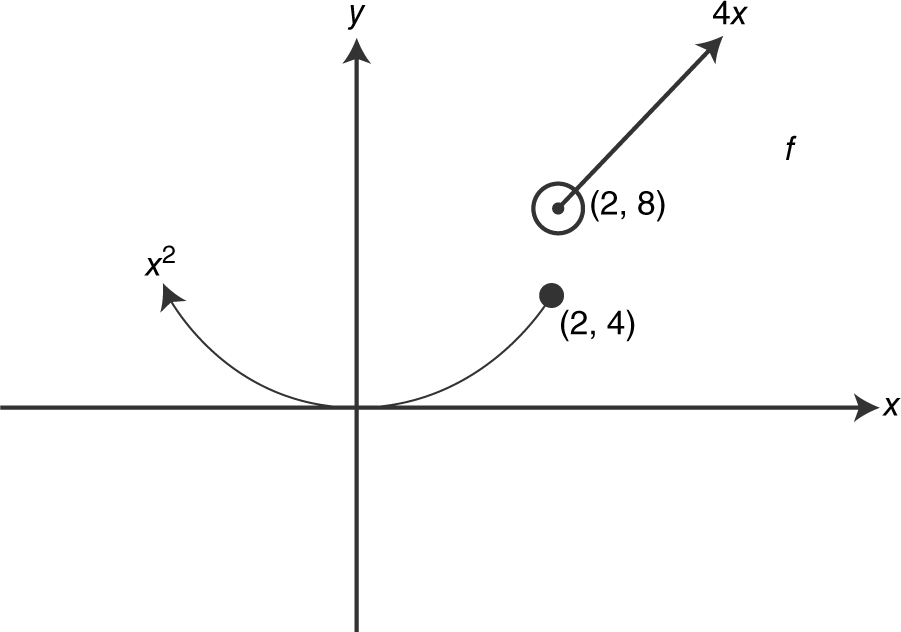
Since f (x ) is discontinuous at x = 2, f ′(2) does not exist. Statement III is false. The limit in statement II represents the right-hand derivative (f + )′(x ), and (f + )′(2) does not exist because the point (2, 8) is not part of the function. Statement II is false. The limit in statement I represents the left-hand derivative (f − )′(x ), and forx ≤ 2, (f − )′(x ) = 2x . Thus, (f − )′(2) = 4. Statement I is true.
19 . The correct answer is (B).
The volume of a sphere is 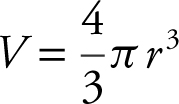 , so
, so 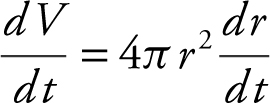 , or
, or 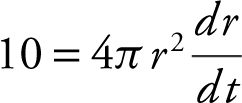 , which yields
 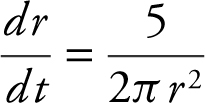 . The diameter D is twice the radius; D = 2r , and
 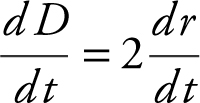 . Therefore,
 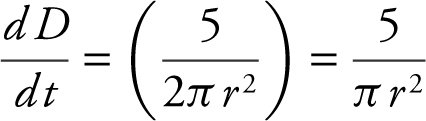 , and
, and  centimeters per second.
20 . The correct answer is (B).
Note that the definition of the derivative  . Therefore, the
  is equivalent to
  . Note that there are other approaches to solving this problem, e.g., applying L’Hôpital’s Rule or expanding sin
  .
.
21 . The correct answer is (B).
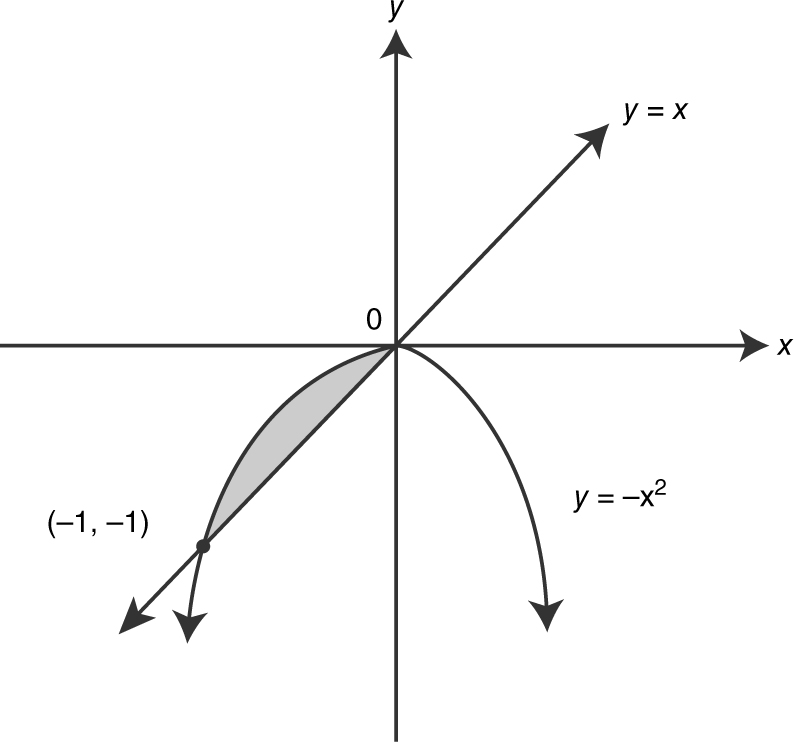
Find the intersection points by setting x = −x 2 . Rewrite x = −x 2 as x 2 + x = 0 or x (x + 1) = 0 and obtain x = 0 and x = − 1. The area of the region bounded by the curves is  .
.
22 . The correct answer is (B).
Rewrite  . Let u = –2 x and obtain du = –2dx , or
  . Therefore,
 .
.
23 . The correct answer is (D).
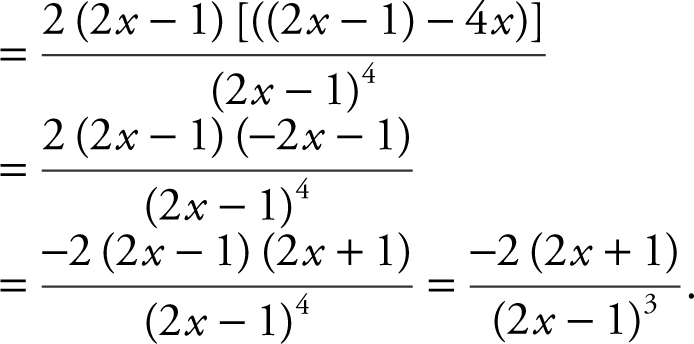
Applying the quotient rule for derivatives, you have 
24 . The correct answer is (C).
Since f and g are inverse functions, if (a , b ) is on the graph of f , then (b , a ) is on the graph of g , and 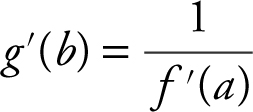 . Note that f (4) = 2, which implies that g (2) = 4. Therefore,
 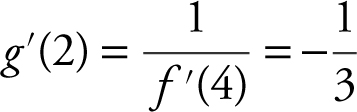 .
.
25 . The correct answer is (B).
Note that the slopes of the tangents depend on the y -coordinates and only the y -coordinates. Also, note that when y > 1, the slopes are positive, and when y < 1, the slopes are negative. Of the given choices, only the differential equation in choice B satisfies these conditions.
26 . The correct choice is (D).
Since f ″(x ) > 0, f ′(x ) is increasing, and in this case, f ′(4.5) < f ′(4.6) < f ′(4.7). Note that 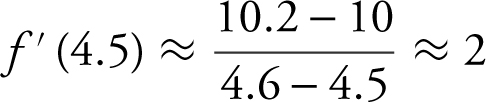 , and
, and 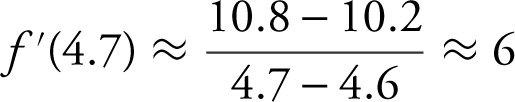 . Also note that
Therefore, 2 < f ′ (4.6) < 6.
27 . The correct choice is (C).
Note that 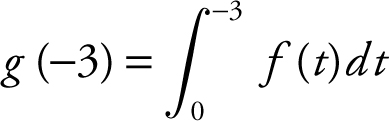
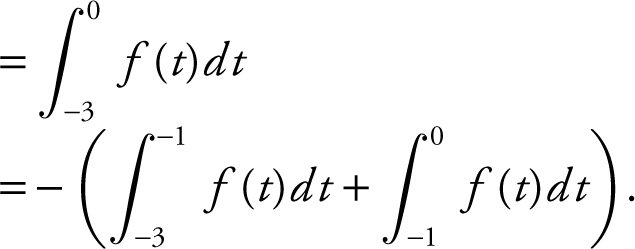
Using area of a triangle, 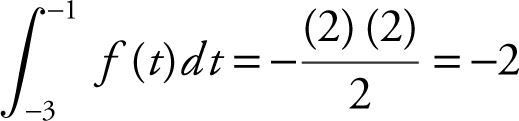 , and
, and 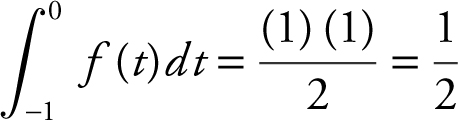 . Therefore,
 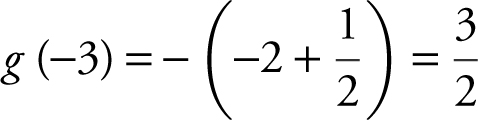 .
.
28 . The correct choice is (D).
Begin with  and obtain
 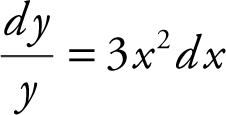 . Integrating both sides of the equation, you have ln|y | = x 3 + c . Substitute x = 0 and y = e , and obtain ln |e | = (0)3 + c , or c = 1, and the equation becomes ln |y | = x 3 + 1. Solving for y , you have e ln|y | = e x 3 +1) , or |y | = e (x 3 +1) , which yields y = ±e (x 3 +1) . Since y (0) = e , which means the graph passes through the point (0, e ), y = e (x 3 +1) .
29 . The correct choice is (B).
Begin by solving the differential equation. Rewrite  as
as 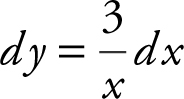 . Integrating both sides, you have
 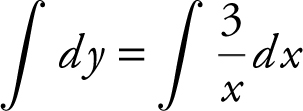 , or y = 3 ln x + c . Substitute x = e and y = 4 in the equation, and obtain 4 = 3 ln e + c , or c = 1. Since, the point (e , 4) is on the graph of f (x ), y = 3 ln x = 1.
30 . The correct choice is (D).
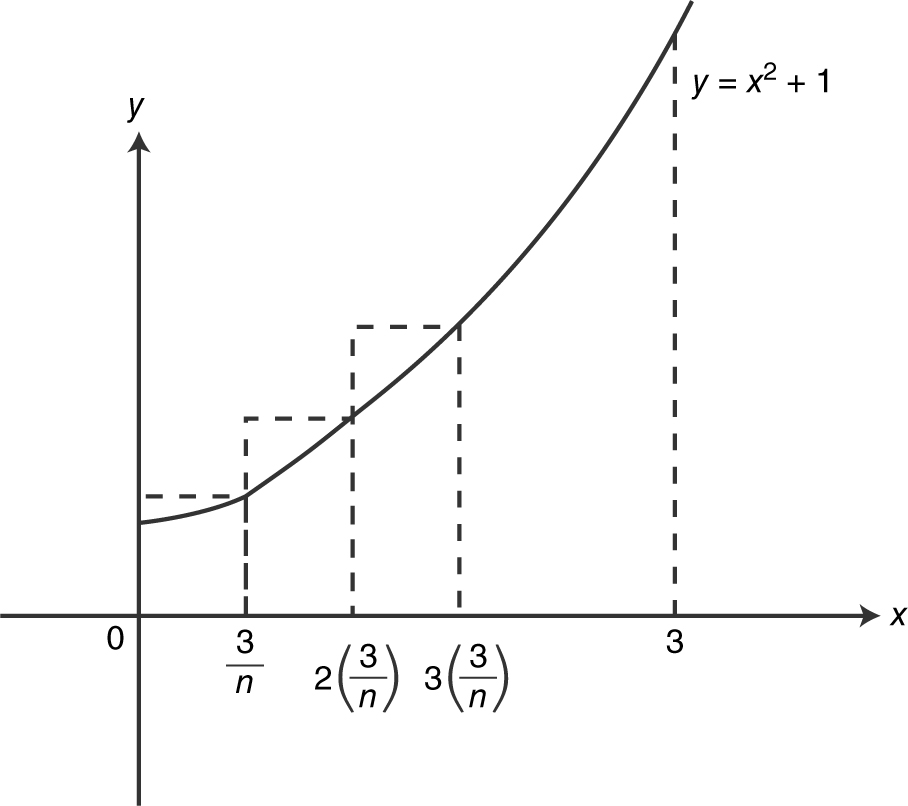
The width of each rectangle is  , and the heights of the rectangles are as follows:
  . . . or
  ,
,  , . . .
The area under the curve is approximately
 , and the
 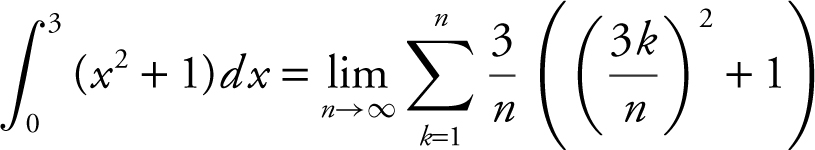 .
.
Section I Part B
76 . The correct answer is (D).
Since the function f is differentiable at x = 1, f is also continuous at x = 1. At x = 1, set x 3 + x + a = 2bx − 1, and obtain (1)3 + (1) + a = 2b (1) − 1, or a = 2b − 3. Also, f ′ (x ) = 3x 2 + 1 for x ≤ 1, and f ′ (x ) = 2b for x > 1. At x = 1, set 3x 2 + 1 = 2b , and you have 3 (1)2 + 1 = 2b , or b = 2. Substituting b = 2 in a = 2b − 3, you have a = 1. Therefore, a + 2b = 1 + 2 (2) = 5.
77 . The correct answer is (D).
Note that 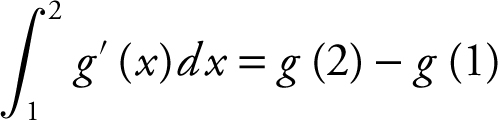 . Therefore,
 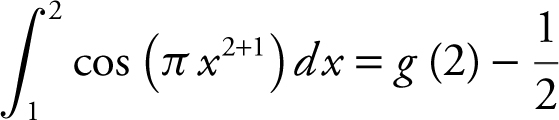 , or
, or 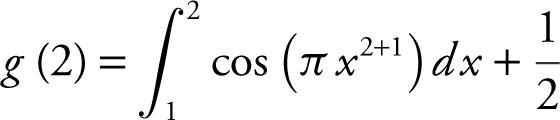 . Using your graphing calculator, you have
 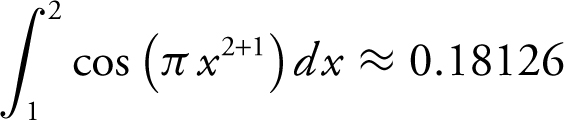 . Thus,
 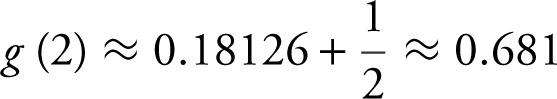 .
.
78 . The correct answer is (D).
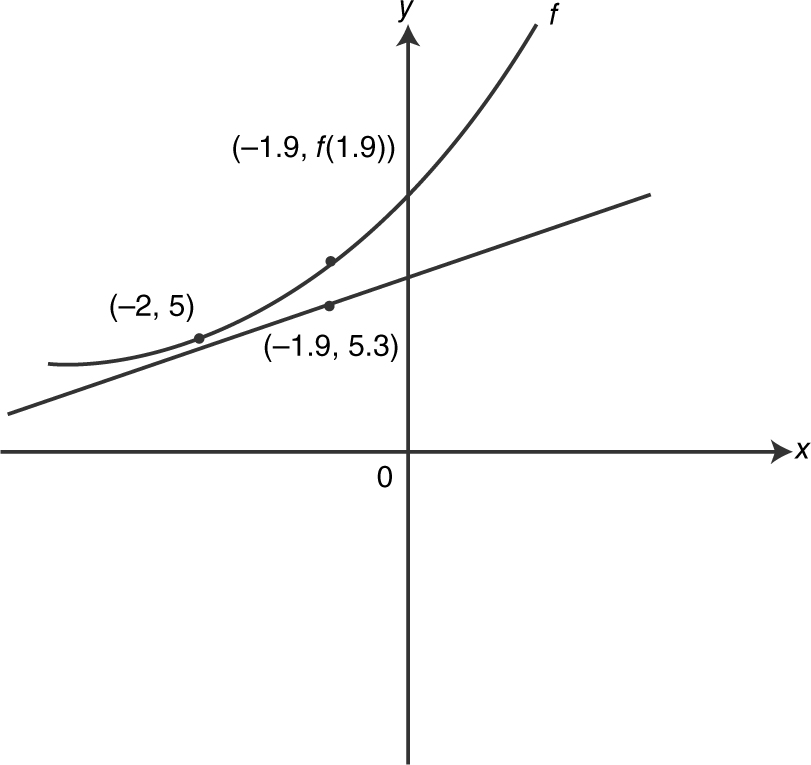
The tangent line for local linearization approximation passes through the point (−2, 5) and has a slope of m = 3. The equation of the tangent is y − 5 = 3 (x + 2). At x = −1.9, y − 5 = 3 (−1.9 + 2), or y = 5.3. Therefore, f (−1.9) ≈ 5.3.
79 . The correct answer is (D).
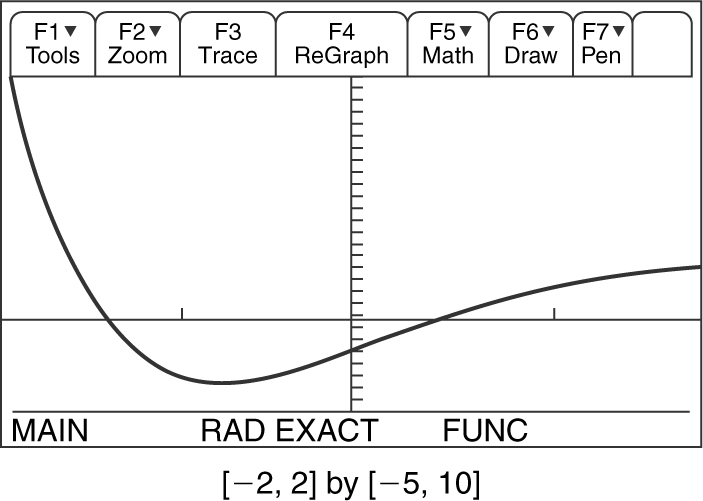
Using your graphing calculator, examine the graph of f ′ (x ). Note that the graph of f ′ (x ) crosses the x -axis at x = −1.407 and x = 0.345. The graph also shows the following:
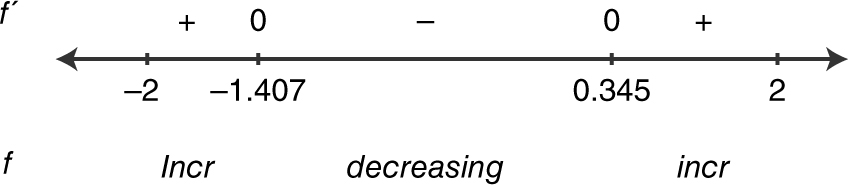
Therefore, the function f increases on the intervals (−2, − 1.407) and (0.345, 2).
80 . The correct answer is (D).
The total distance traveled is 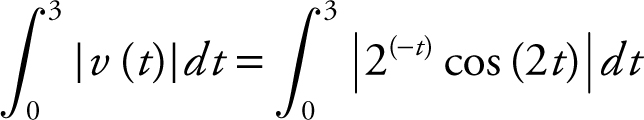 . Using the TI-89 graphing calculator, enter
 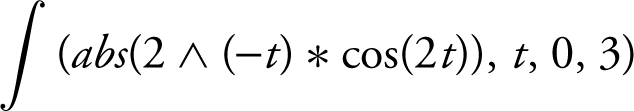 and obtain 0.812884 ≈ 0.813.
81 . The correct answer is (D).
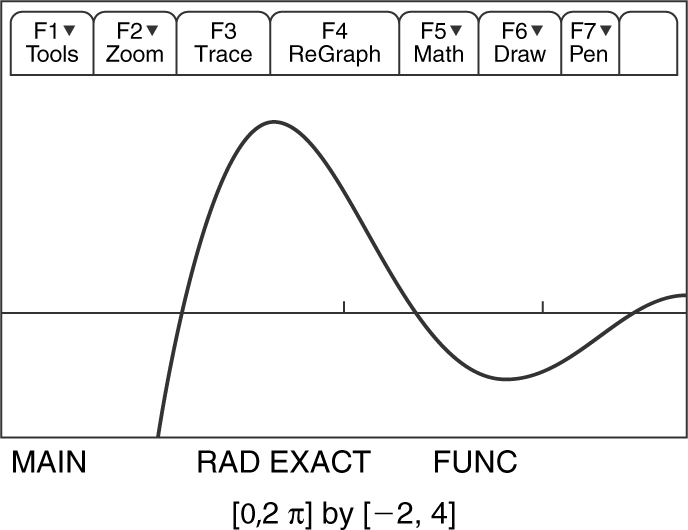
Using the TI-89 graphing calculator, enter the second derivative 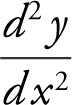 into y 1 as follows:
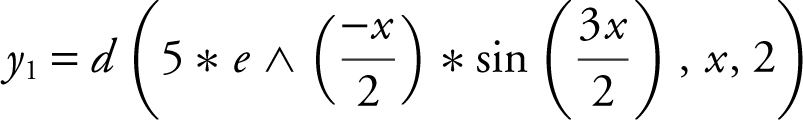
Inspecting the graph of y 1 , you see that the curve crosses thex -axis three times, which means the second derivative changes sign three times. Since the functiony is a twice differentiable function, it has three points of inflection.
82 . The correct answer is (B).
Note that the length of each rectangle is 5. Therefore:
83 . The correct answer is (A).
Note the following:
Also note that f ′(x ) = 0 at x = −4, 2, 4, so the graph of f has a horizontal tangent at each of these points. The only graph that satisfies these conditions is choice (A).
84 . The correct answer is (A).
Let x be the length of the wire used to make a circle. Therefore, the circumference of the circle is 2πr = x , or 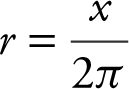 . The area of the circle is
  . The remaining wire has a length of (40 − x ) and is made into a square. Therefore, a side of the square is
 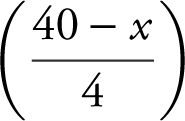 , and the area of the square is
  . Let A be the total area of the two figues. Thus,
 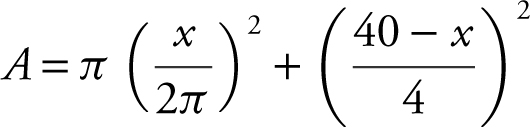 . Enter this equation into the graphing calculator by letting A = y 1 . Examine the graph of y 1 .
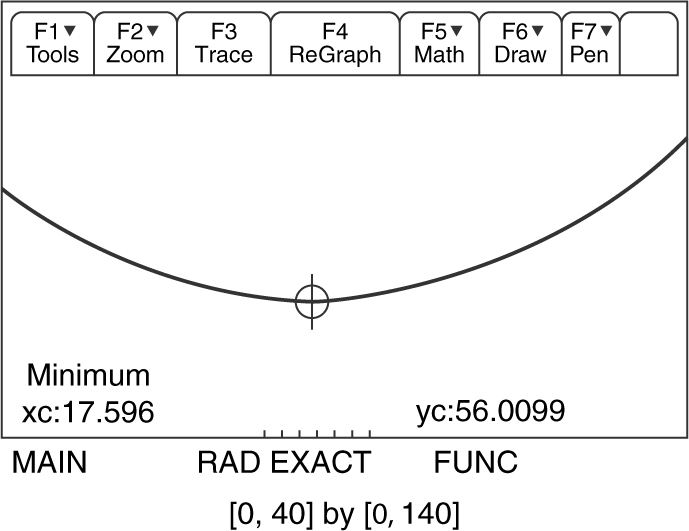
Use the [ Minimum ] function on the calculator, and obtain x = 17.596 centimeters.
85 . The correct answer is (A).
Remember that  arccos
 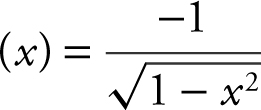 . Using the chain rule,
 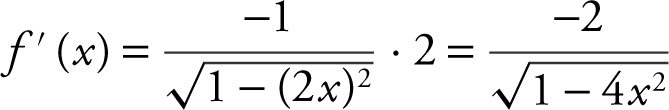 , and f ′(0) = −2. Therefore, the slope of the tangent to the graph of f at x = 0 is −2. Note that you could also find f (x ) and f ′(0) using your graph calculator.
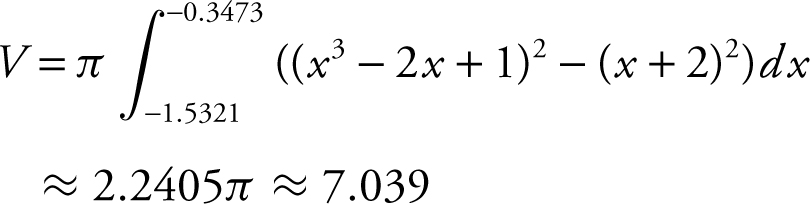
86 . The correct answer is (B).
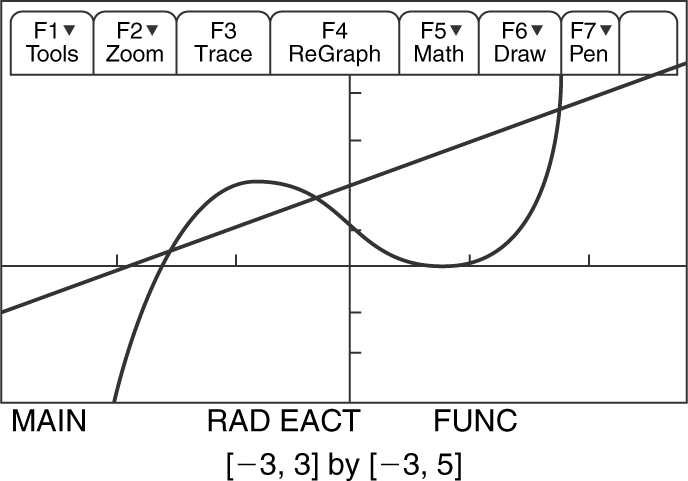
Using the TI-89 graphing calculator, graph the two given equations. Find their intersection points in the second quadrant: x = −1.5321 and x = −0.3473. Find the volume of the solid of revolution:
87 . The correct answer is (A).
Since f (x ) = x 3 + 1, f ′(x ) = 3x 2 , and f ′(c ) = 3(c )2 . The average rate of change of f on [1, 3] is  . Set 3c 2 = 13, and obtain
  .082. Note that only
  is on the interval [1, 3]. Thus,
  .
.
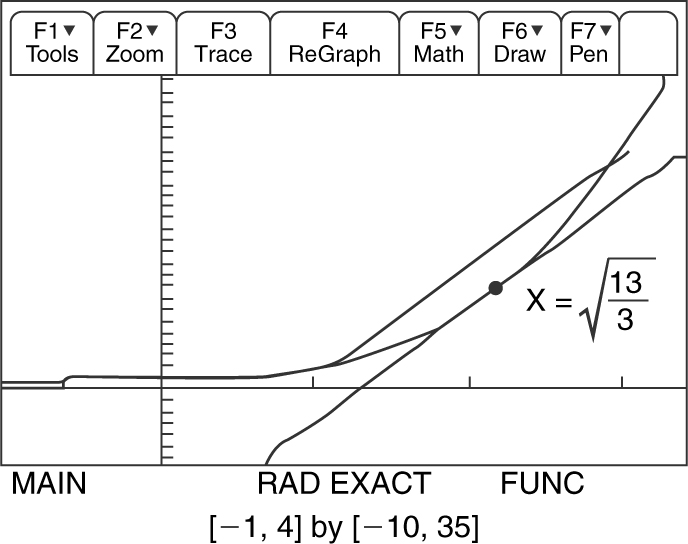
See the figure above for a geometric representation of the problem.
88 . The correct answer is (C).
Remember, a (t ) = v ′(t ). Using the TI-89 graphing calculator, find a (t ), and evaluate it at  :
:
d (cos(t ) * e ^ (sin(t ), t )|t = π/4
= .0.1420036 ≈ −0.420
89 . The correct answer is (A).
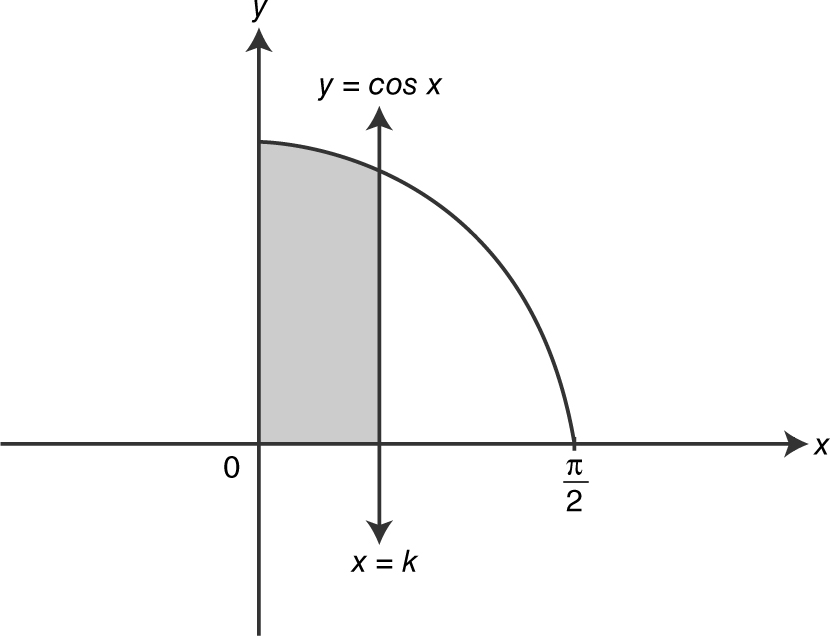
Since the areas of the two regions are equal, set 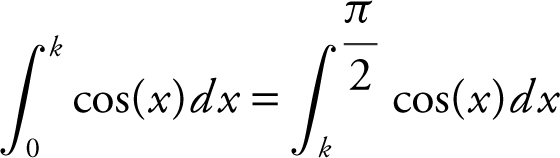 , and obtain
 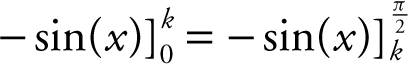 . Evaluating the definite integrals, you have
 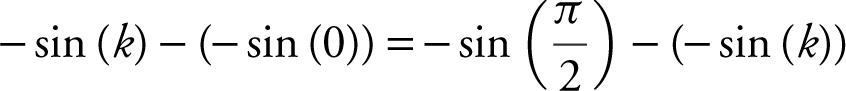 , or 2 sin (k ) = 1, which yields sin
  , or
, or 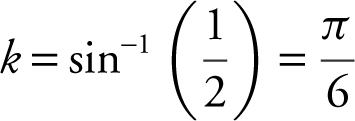 .
.
90 . The correct answer is (C).
Let R (t ) be the function representing the number of bacteria in the petri dish, so  . The net change in the number of bacteria between day two and day five is
  , or
, or 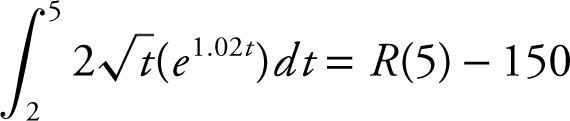 . Thus, 623.227 = R(5) − 150, or R (5) = 773.227 ≈ 773.
Solutions for AP Calculus AB Practice Exam 1—Section II
Section II—Part A
1 . (A) Begin by finding the intersection points of the two curves, and obtain x = 0 and x = 2.60308.
Area of a region enclosed by two curves =  . In this case, the area of region
 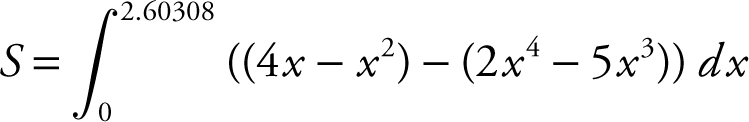 = 17.258.
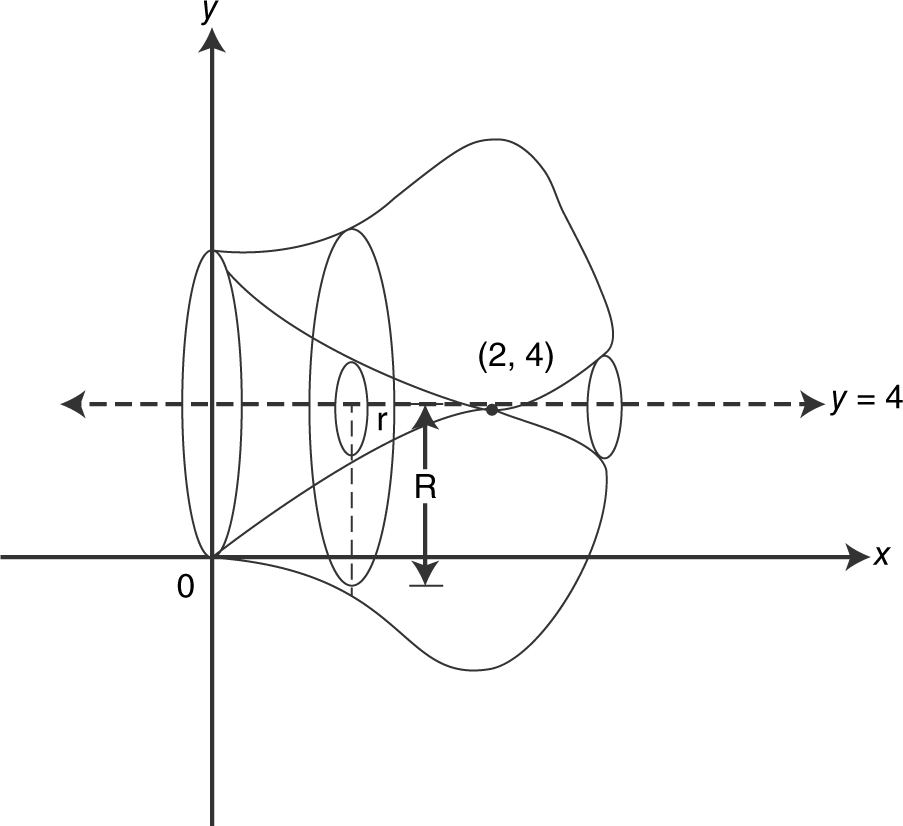
(B) Volume of a solid of revolution with hole 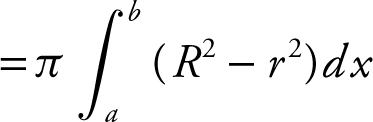 , where R is the outer radius and r is the inner radius. In this case, R = 4 − (2x 4 − 5x 3 ), and r = 4 − (4x − x 2 ). (Note that the highest point in region S is (2, 4).) Therefore, the volume of the solid revolving about the line y = 4 is:
(C) Volume of a solid with a given base 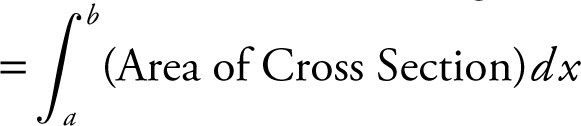 . In this case, the area of the cross section = (0.5 + 2x )((4x − x 2 ) − (2x 4 − 5x 3 )). Thus, the volume of the solid with base
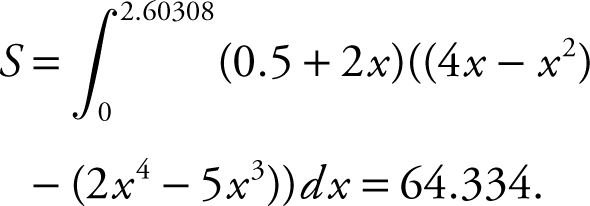
2 . (A) Remember,  , and in this case,
 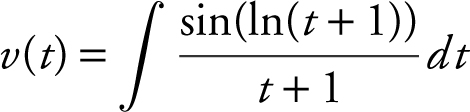 . Using your TI-89 graphing calculator, you have v (t ) = −cos(ln(t + 1)) + c . Since v (0) = −1.1, you have −1.1 = −cos(ln(t + 1)) + c , or −1.1 = −cos(0) + c , which yields c = −0.1. Therefore, v (t ) = −cos(ln(t + 1)) − 0.1, and v (4) = −cos(ln(4 + 1)) − 0.1 = −0.061368, or −0.061. Another approach to find v (4) is as follows. Note that
 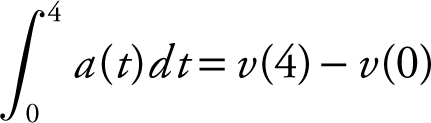 = v (4) − (−1.1) = v (4) + 1.1. Therefore,
 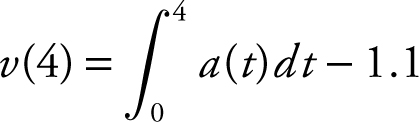 . Also note that
 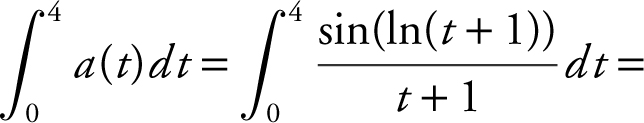 1.03863. Therefore, v (4) = 1.03863 − 1.1 = −0.061368, or −0.061.
(B) The speed of the particle is increasing when a (t ) and v (t ) are both positive or both negative. Examine the graphs of a (t ) and v (t ).
Note that for 0 ≤ t ≤ 10, a (t ) > 0, and for 4.31729
(C) The average value of a function f on a closed interval [a , b ] is  . In this case, the average velocity of the particle on the interval [0, 10] is
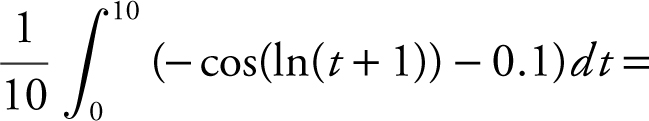
 , or −0.018.
(D) The total distance traveled by the particle for 0 ≤ t ≤ 10 is 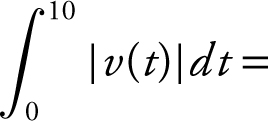
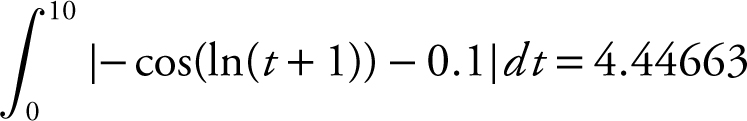 , or 4.447. Another approach to find the total distance traveled by the particle is to add the distance traveled to the left with the distance traveled to the right. From the graph of v (t ), the particle changes direction at t = 4.317. Therefore, the total distance
 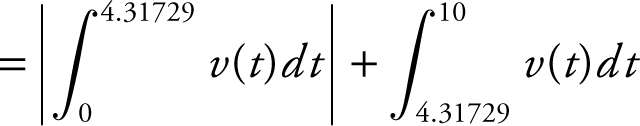 , which yields the same result, 4.447.
Section II—Part B
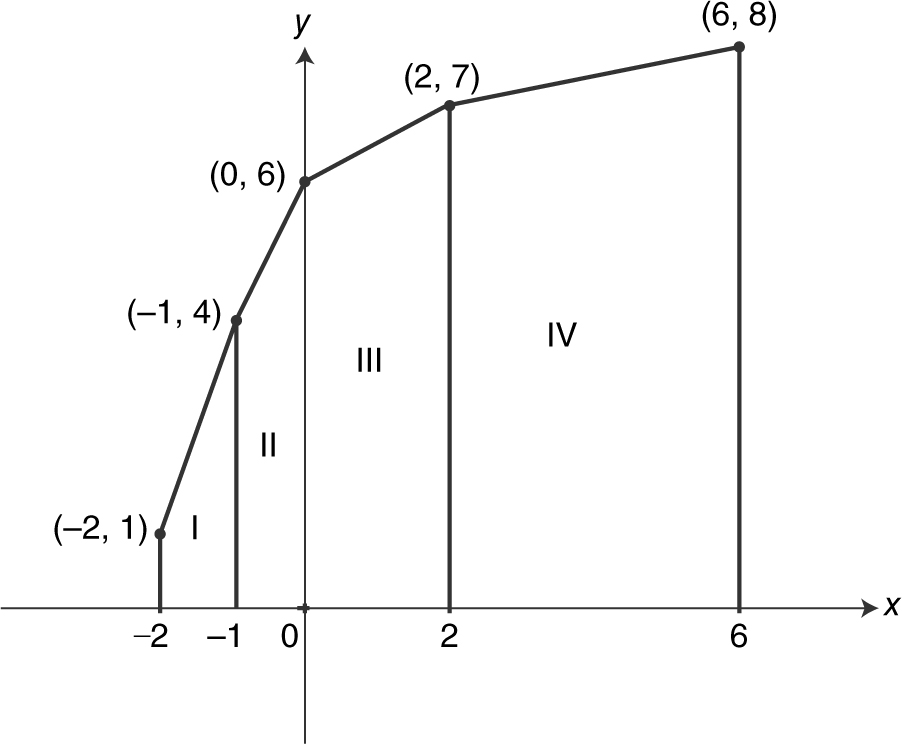
3 . (A)
Rewrite  as
as 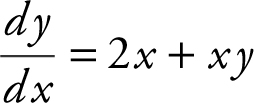 . Below is a summary of
  at the six given points.
(B) At the point (0, 1),  . The equation of the tangent line is y − y 1 = m (x − x 1 ). In this case, y − 1 = 0(x − 0), or y = 1.
(C) Since the tangent y = 1 is a constant function, the values of y stay at 1 for all values of x . Thus, using the tangent line at (0, 1) to approximate f (0.02), you have f (0.02) ≈ 1.
(D) Rewrite  as
as  , and obtain
  . Integrating both sides of the equation, you have
  . Integrate
  by letting u = 2 + y and therefore du= dx . You obtain
 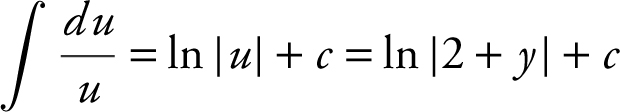 . Thus, ln
 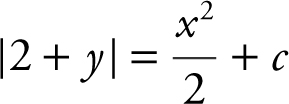 . Applying the exponential function to both sides, you have
 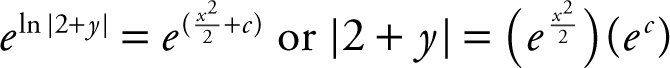 . Since e c is an arbitrary constant, let k = e c and rewrite:
 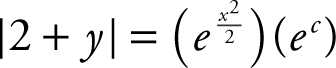 as
as 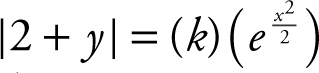 . Substituting (0, 1) into the equation, you have |2 + 1| = (k )(e 0 ), which yields k = 3. Since the point (0, 1) is on the curve of y = f (x ), |2 + y| becomes 2 + y , and you have
 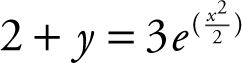 , or
, or 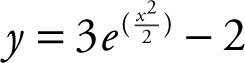 .
.
4 . (A)
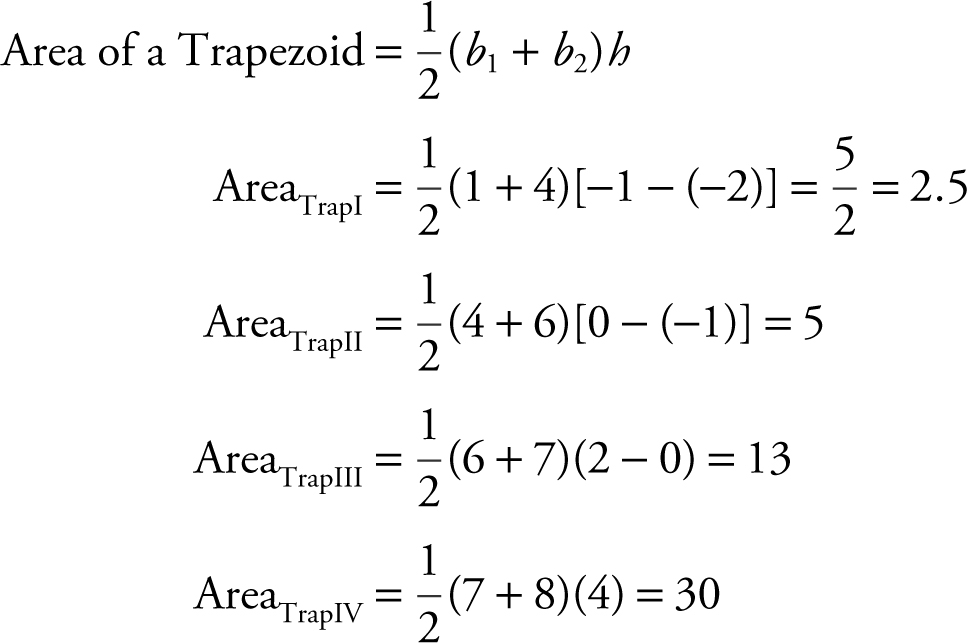
Therefore,
Note that you cannot use the formula
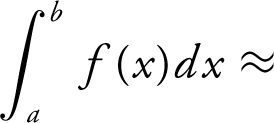
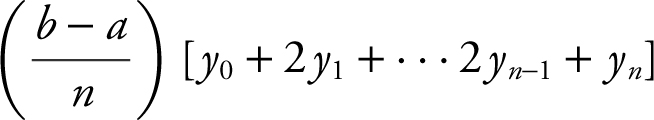 , since the four given intervals have different lengths.
(B) The average value of an integrable function on [a , b ] is 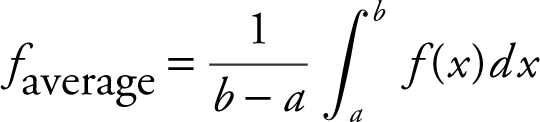 . In this case,
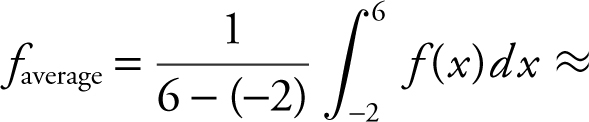
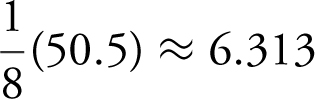 .
.
(C) The average rate of change of a continuous function on [a , b ] is 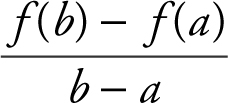 . In this case, the average rate of change of f is
  , or 0.875.
(D) Since f ″(x ) < 0 for all x ∈ (−2, 6) f ′(x ) is decreasing on the interval. Thus, f ′(0) > f ′(2).
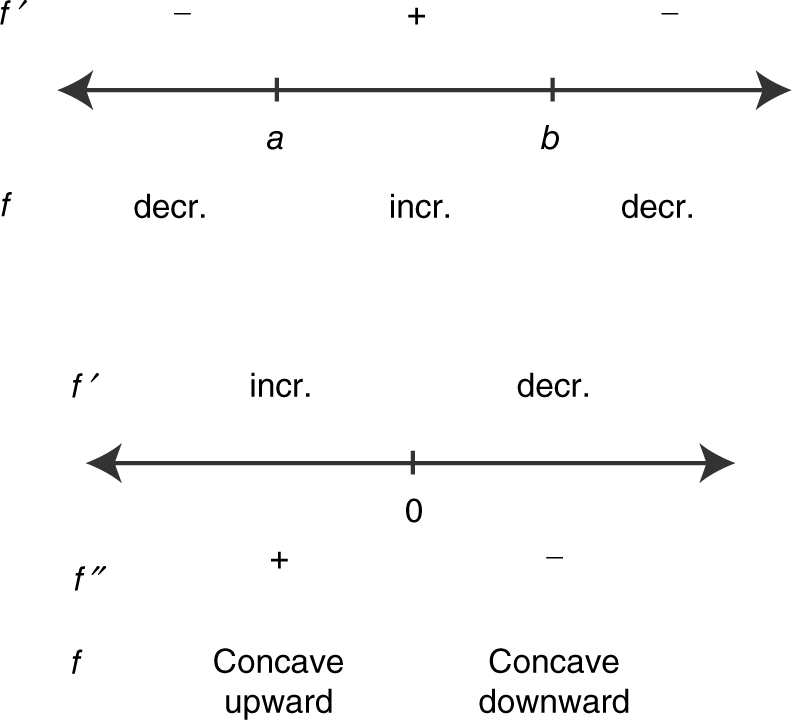
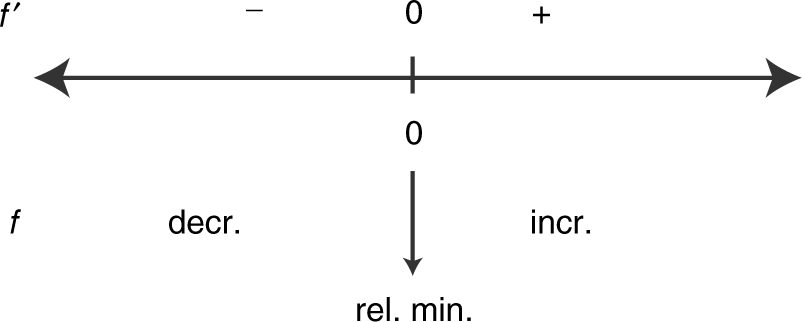
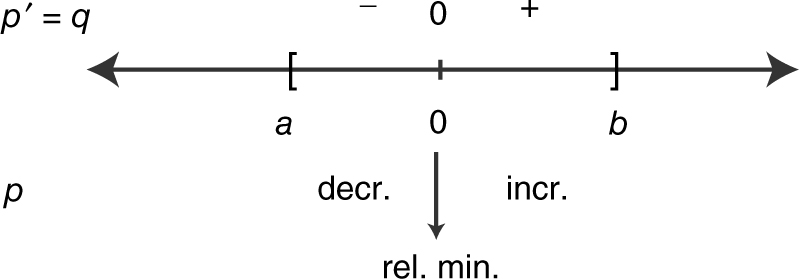
5 . (A) Begin by summarizing f ′(x ) on a number line.
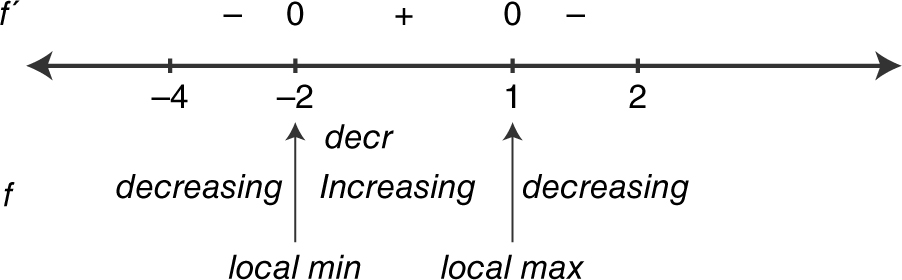
The graph of f has a local minimum at x = −2 on the interval (−4, 2).
(B) Summarize f ″(x ) on the number line.
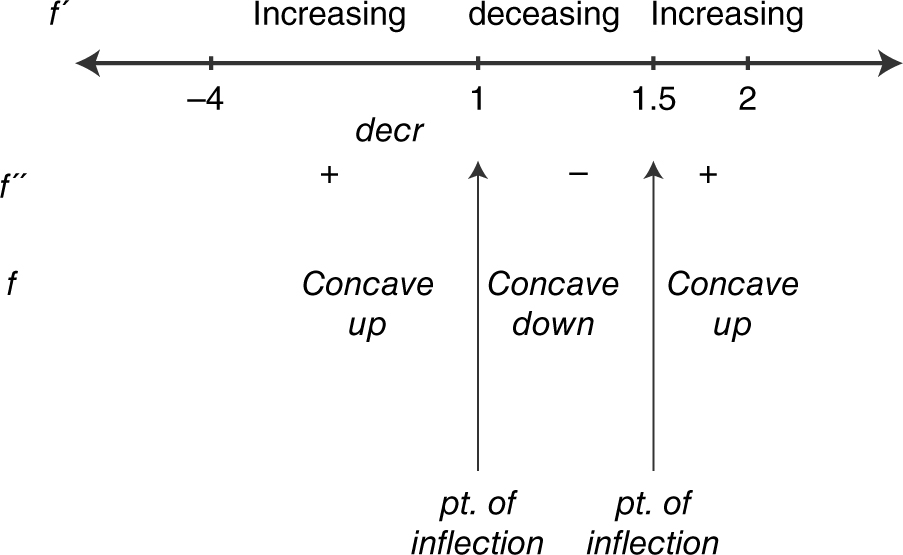
Since the graph of f changes concavity at x = −1 and x = 1.5, the graph of f has a point of inflection at x = −1 and x = 1.5.
(C) Note that  . Also,
  , with f (2) = 3. Since the area of region C is 6, and region C is below the x -axis, you have
  . Therefore, f (2) − f (1) = −6, or 3 − f (1) = −6, which yields f (1) = 9. Thus,
  .
.
(D) By substituting x = −2, you have  . To find the value of f (−2), note that
 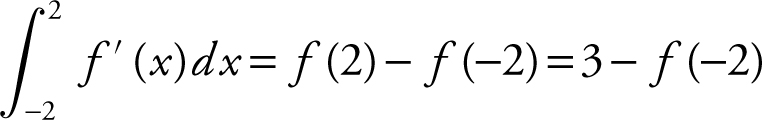 . Also, using regions B and C , you have
 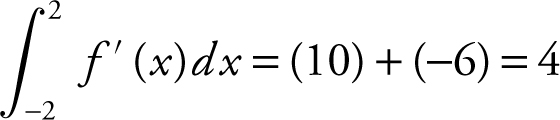 . Therefore, 3 − f (−2) = 4, or f (−2) = −1. Since
 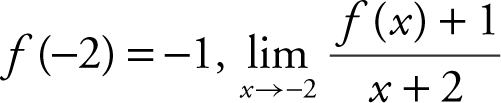 leads to
 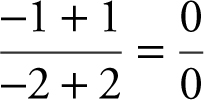 , an indeterminate form. Applying L’Hôpital’s Rule, you have
  . Note that f ′(−2) = 0, and thus
  .
.
6 . (A) The equation of the curve is 14y − y 2 = x 2 + 24. Using implicit differentiation, you have  . Solve for
  obtain
  .
.
(B) The slope of the tangent at the point 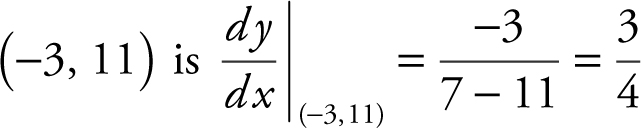 . Using the formula of a line, y − y 1 = m (x − x 1 ), you have
 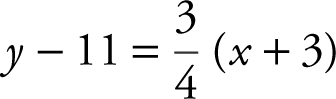 , or
, or 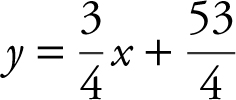 .
.
(C) The slope of all tangents to the curve is derived in part (A) as 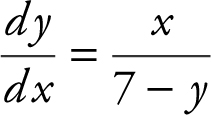 . Remember that a vertical tangent has no slope. Therefore,
  is undefined for all vertical tangents, and
  is undefined when 7 − y = 0 or y = 7. Substituting y = 7 in the equation 14y − y 2 = x 2 + 24, you have 14(7) − (7)2 = x 2 + 24. Solve for x and obtain x = ±5. Therefore, the points of tangency are (5, 7) and (−5 7), and the equations of the vertical tangents are x = −5 and x = 5.
(D) From part (A), 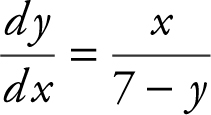 . Using the quotient rule, you have:
 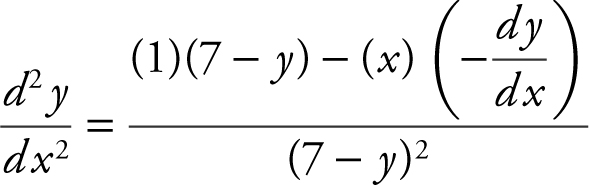 At the point (0, 2) on the curve,
 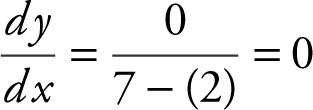 , Therefore,
  .
.
Scoring Sheet for AB Practice Exam 1
Section I—Part A

Section I—Part B

Section II—Part A (Each question is worth 9 points.)

Section II—Part B (Each question is worth 9 points)

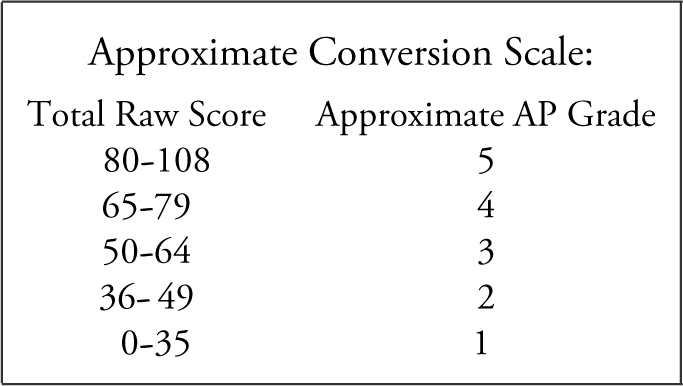
Total Raw Score (Subtotals A + B + C + D) = 
AP Calculus AB Practice Exam 2
ANSWER SHEET FOR MULTIPLE-CHOICE QUESTIONS
Section I—Part A

Directions:
Use the answer sheet provided on the previous page. All questions are given equal weight. Points will not be deducted for incorrect answers, and no points will be given to unanswered questions. Unless otherwise indicated, the domain of a function f is the set of all real numbers. The use of a calculator is not permitted in this part of the exam.
1 . 
(A) ![]()
(B) ![]()
(C) ![]()
(D) 
2 . The  is :
is :
(A) –1
(B) 0
(C) ![]()
(D) 2
3 . What is the  , if
, if
(A) –3
(B) 1
(C) 3
(D) 11
4 . The graph of f ′ is shown below.
Which of the graphs below is a possible graph of f ?
(A) 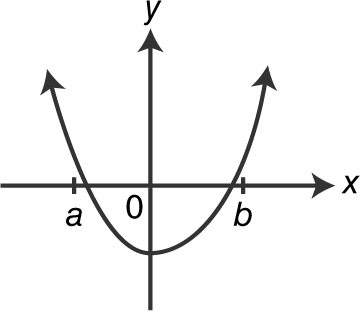
(B) 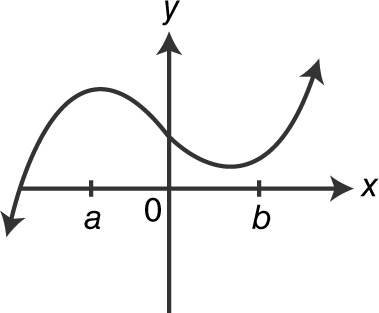
(C) 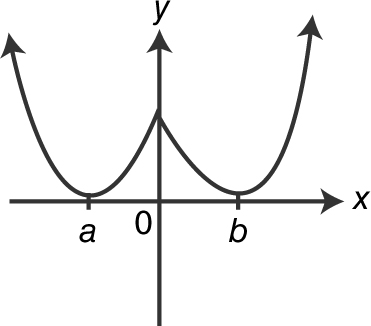
(D) 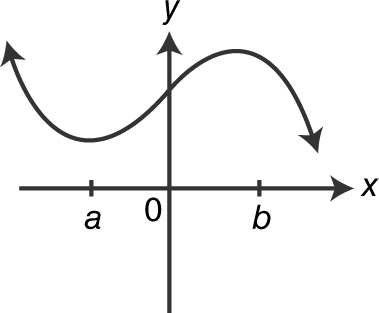
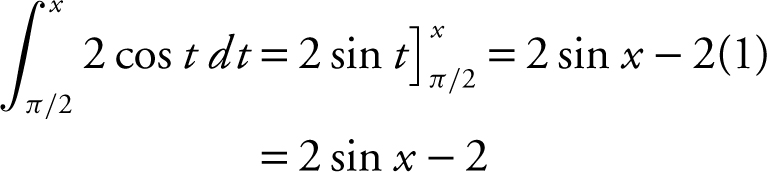
5 . 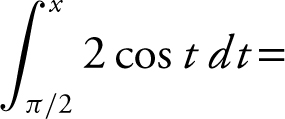
(A) 2 cos x
(B) –2 cos x
(C) 2 sin x
(D) 2 sin x – 2
6 . Given the equation y = 3e −2x , what is an equation of the normal line to the graph at x = ln 2?
(A) 
(B) 
(C) 
(D) 
7 . What is the 
(A) ![]()
(B) ![]()
(C) 0
(D) 
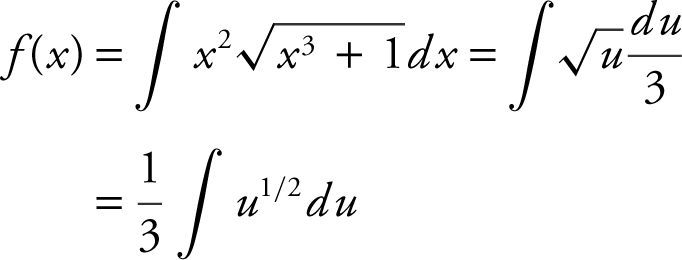
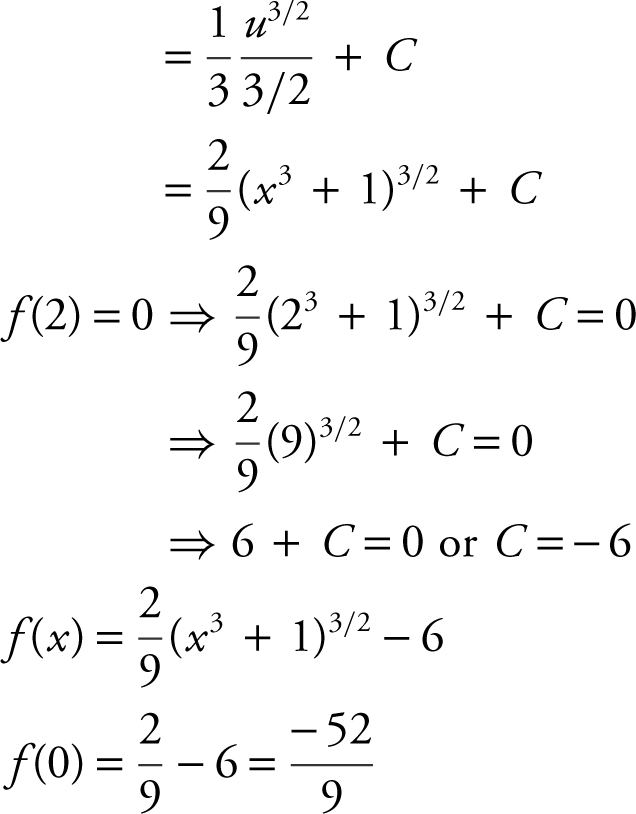
8 . If f (x) is an antiderivative of ![]() and f (2) = 0, then f (0) =
and f (2) = 0, then f (0) =
(A) –6
(B) 6
(C) ![]()
(D) 
9 . If a function f is continuous for all values of x , which of the following statements is/are always true?
I. 
II. 
III. 
(A) I only
(B) I and II only
(C) II only
(D) II and III only
10 . The graph of f is shown below and f is twice differentiable. Which of the following has the largest value: f (0), f ′(0), f ″(0)?
(A) f (0)
(B) f ′(0)
(C) f ″(0)
(D) f (0) and f ′(0)
11 . 
(A) 
(B) 
(C) 
(D) 
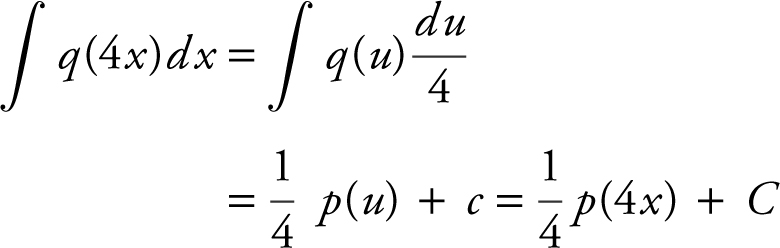
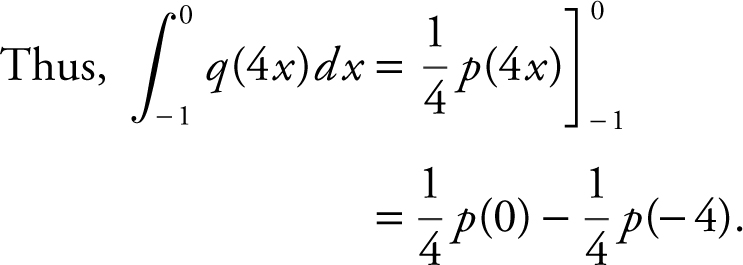
12 . If p ′(x ) = q (x ) and q is a continuous function for all values of x , then  is
is
(A) p (0) = – p (–4)
(B) 4p (0) – 4p (–4)
(C) 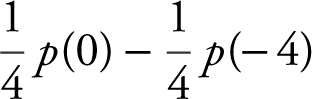
(D) 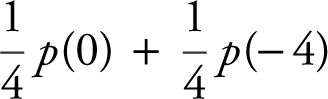
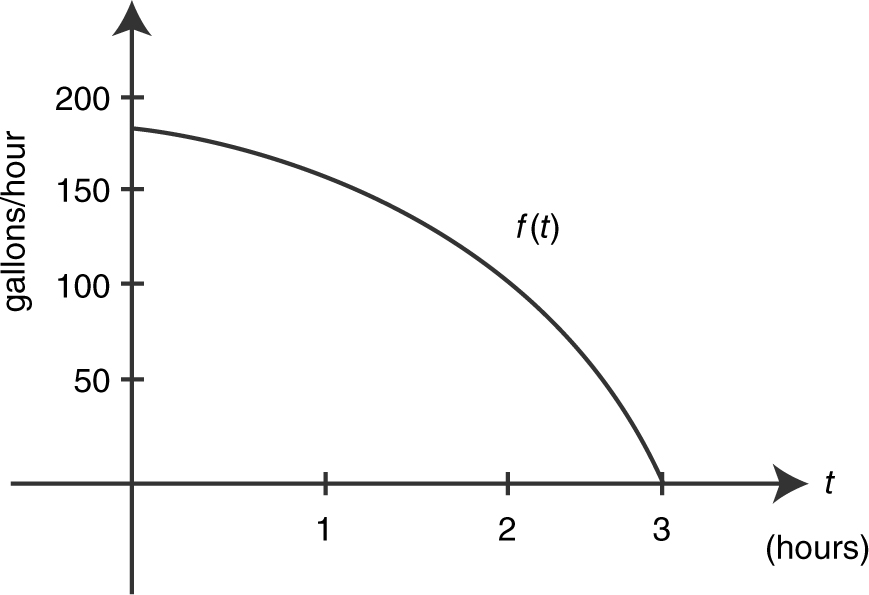
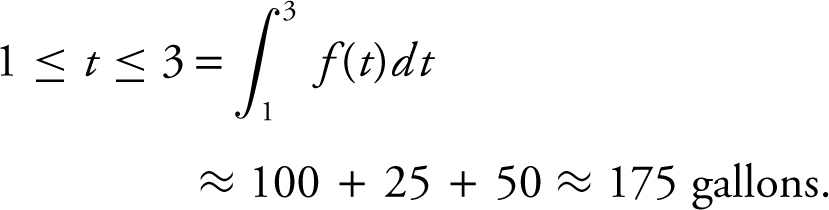
13 . Water is leaking from a tank at a rate represented by f (t ) whose graph is shown below. Which of the following is the best approximation of the total amount of water leaked from the tank for 1 ≤ t ≤ 3?
(A) 
(B) 5 gallons
(C) 175 gallons
(D) 350 gallons
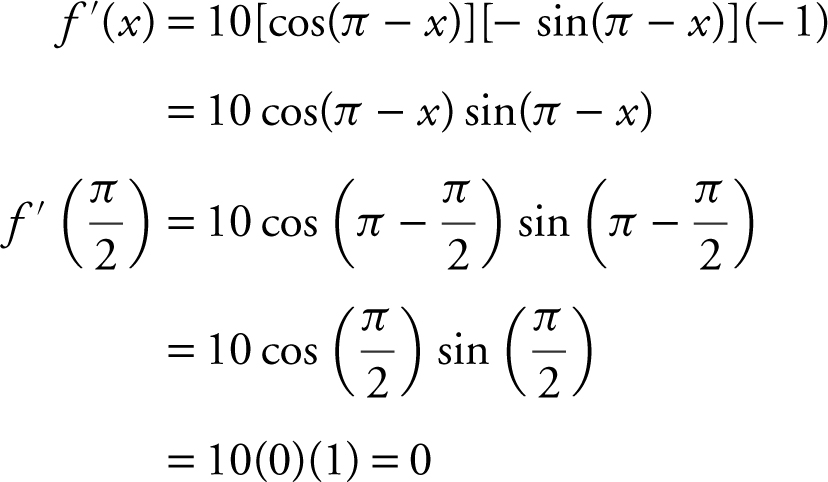
14 . If f (x ) = 5 cos2 (π – x ), then  is
is
(A) 0
(B) – 5
(C) 5
(D) – 10
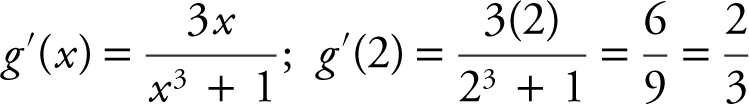
15 . 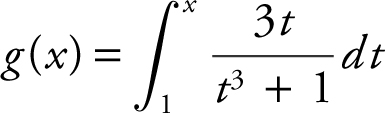 , then g ′(2) is
(A) 0
(B) 
(C) ![]()
(D) ![]()
16 . If  , a possible value of k is
(A) –2
(B) 0
(C) 1
(D) 3
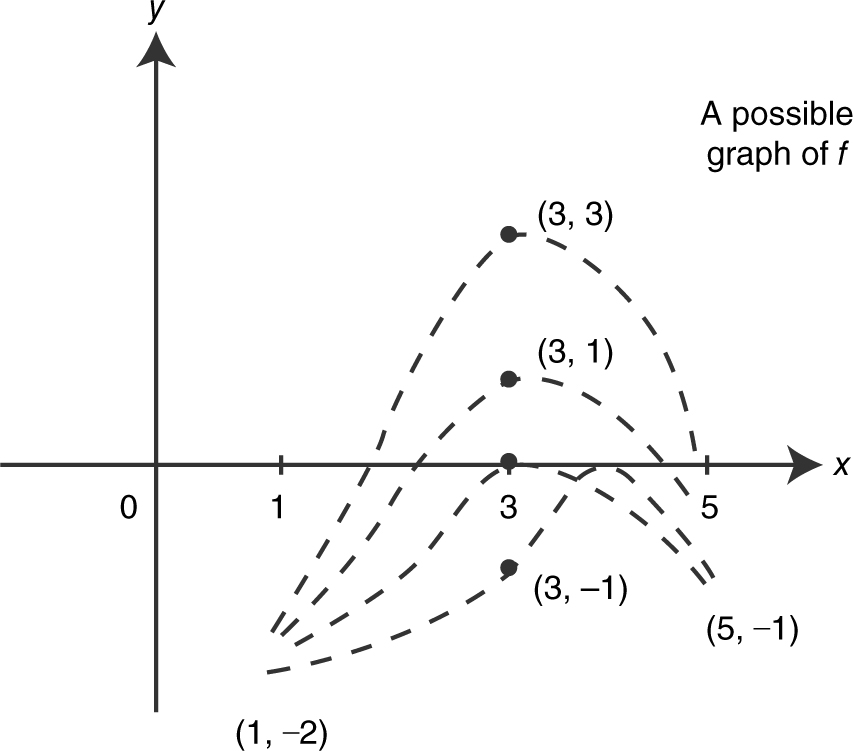
17 . If  for all positive values of a , then which of the following could be the graph of f ? (See below.)
(A) 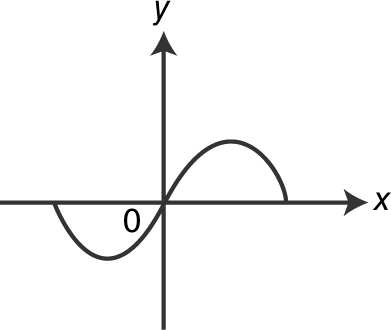
(B) 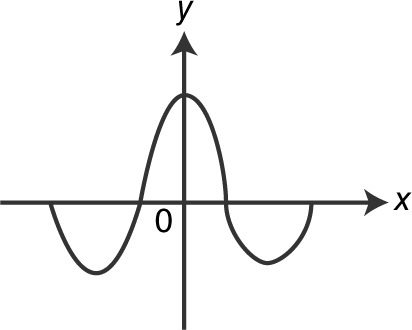
(C) 
(D) 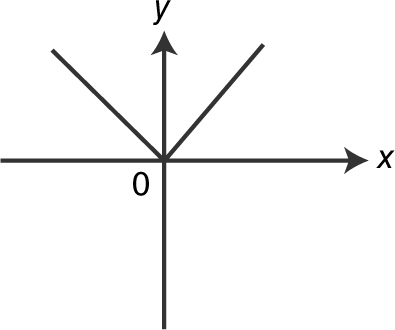
18 . A function f is continuous on [1, 5] and some of the values of f are shown below:
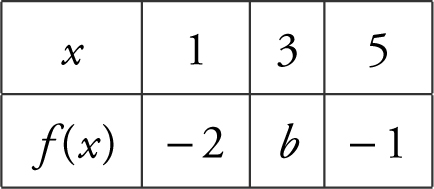
If f has only one root, r , on the closed interval [1, 5], and r ≠ 3, then a possible value of b is
(A) –1
(B) 0
(C) 1
(D) 3
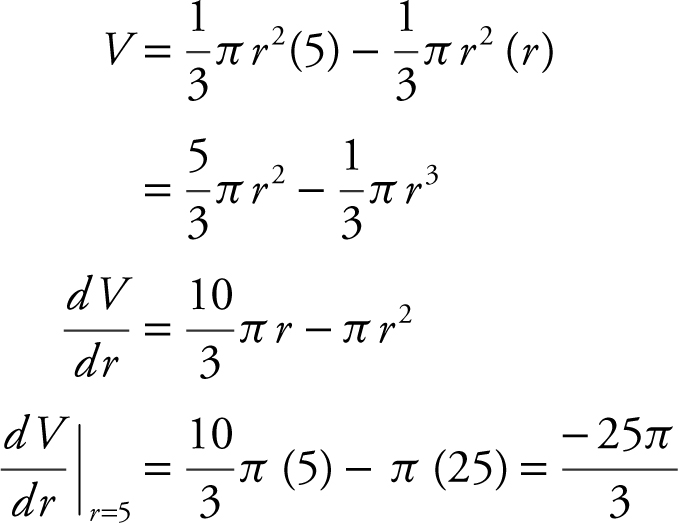
19 . Given the equation 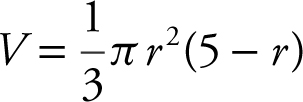 , what is the instantaneous rate of change of V with respect to r at r = 5?
(A) 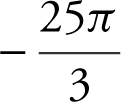
(B) 
(C) 
(D) 25π
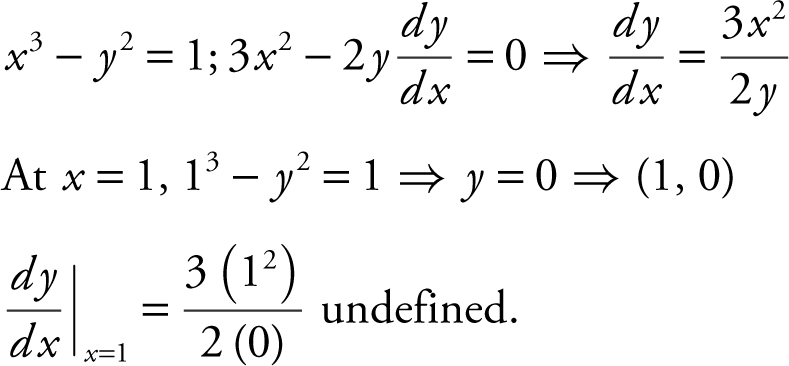
20 . What is the slope of the tangent to the curve x 3 – y 2 = 1 at x = 1?
(A) 0
(B) 
(C) ![]()
(D) Undefined
21 . The graph of function f is shown below. Which of the following is true for f on the interval (a , b )?
I. The function f is differentiable on (a , b ).
II. There exists a number k on (a , b ) such that f ′(k ) = 0.
III. f ″ > 0 on (a , b ).
(A) I only
(B) I and II only
(C) II only
(D) II and III only
22 . The velocity function of a moving particle on the x -axis is given as v (t ) = t 2 – 3t – 10. For what positive values of t is the particle’s speed increasing?
(A) 
(B) 
(C) t > 5 only
(D) 
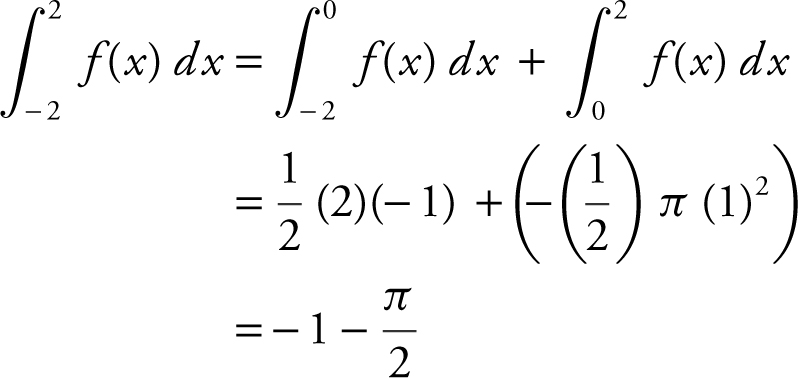
23 . The graph of f consists of two line segments and a semicircle for – 2 ≤ x ≤ 2 as shown below. What is the value of 
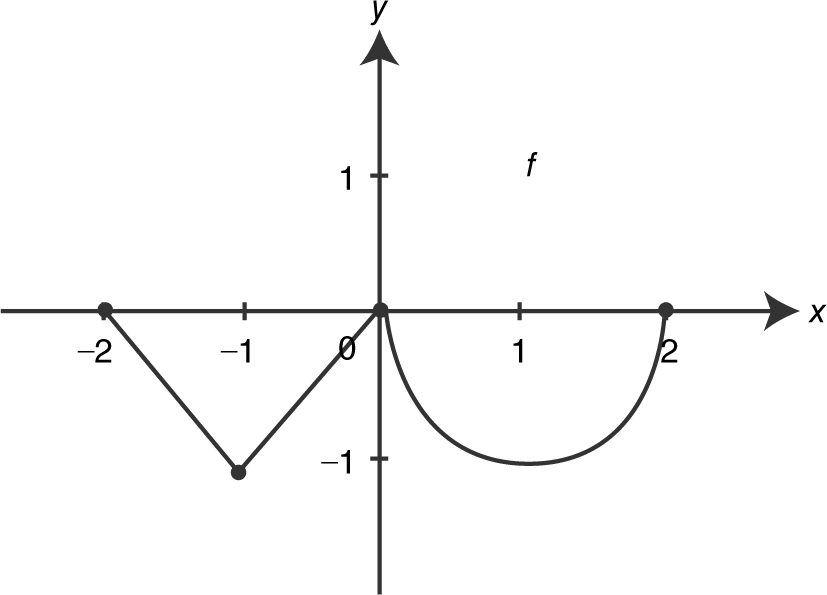
(A) – 2 – 2π
(B) – 2 – π
(C) 
(D) 
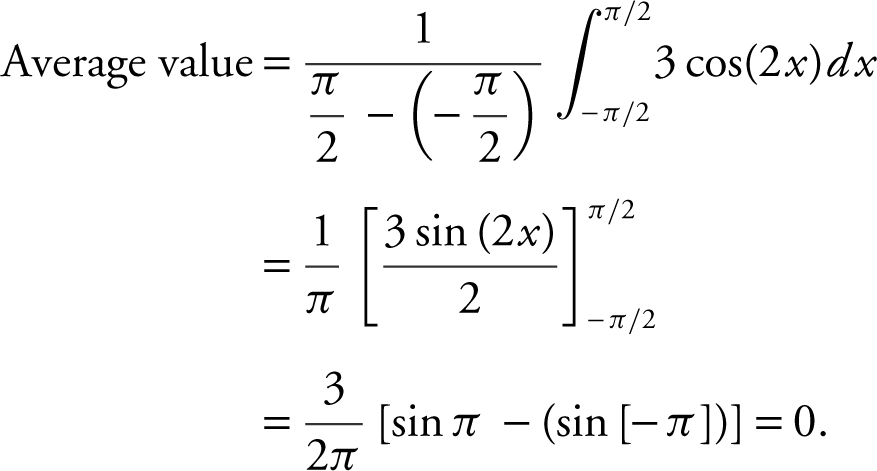
24 . What is the average value of the function y = 3 cos(2x ) on the interval 
(A) – 2
(B) 
(C) 0
(D) ![]()
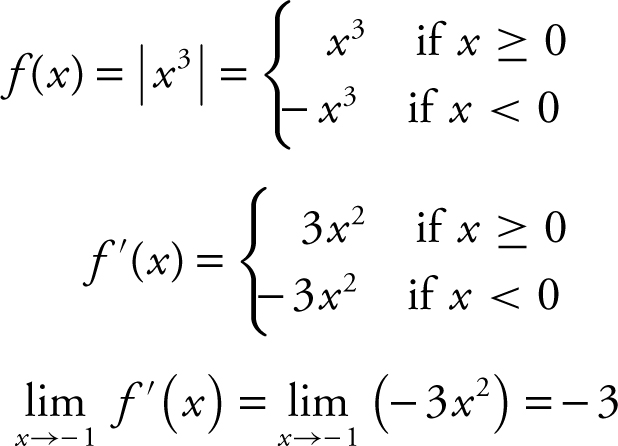
25 . If f (x ) = |x 3 |, what is the value of 
(A) – 3
(B) 0
(C) 1
(D) 3
26 . A spherical balloon is being inflated. At the instant when the rate of increase of the volume of the sphere is four times the rate of increase of the radius, the radius of the sphere is
(A) 
(B) 
(C) ![]()
(D) 
27 . If  and at x = 0, y = 4, a solution to the differential equation is
(A) 
(B) 
(C) 
(D) 
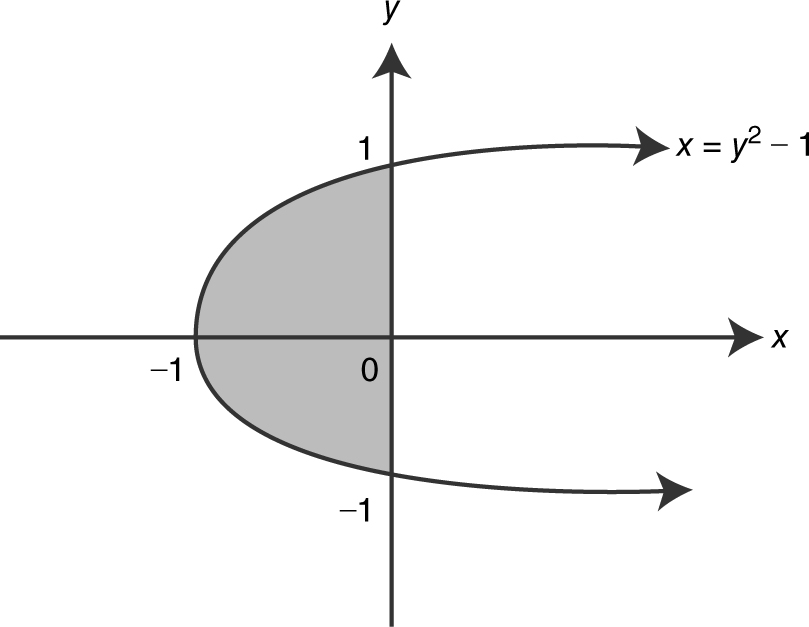
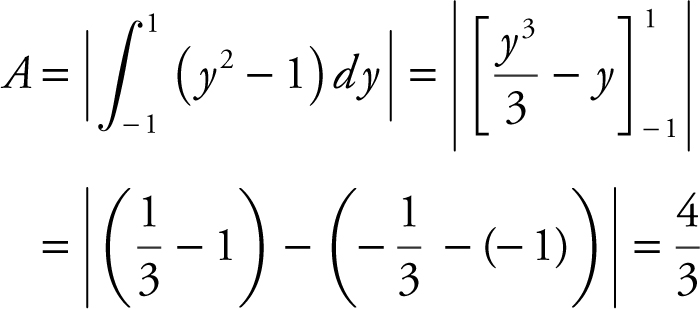
28 . The area of the region enclosed by the graph of x = y 2 – 1 and they -axis is
(A) 
(B) 0
(C) ![]()
(D) ![]()
29 . The graph off ′, the derivative of f , is shown below. At which value of x does the graph f have a horizontal tangent?
(A) x 1
(B) 0
(C) x 2
(D) x 3
30 . If f (x ) = – |x – 3|, which of the following statements about f is true?
I. f is differentiable at x = 3.
II. f has an absolute minimum at x = 3.
III. f has a point of inflection at x = 3.
(A) II only
(B) III only
(C) II and III only
(D) None
STOP. AP Calculus AB Practice Exam 2 Section I—Part A
Section I—Part B
Directions:
Use the same answer sheet from Part A. Please note that the questions begin with number 76. This is not an error. It is done to be consistent with the numbering system of the actual AP Calculus AB exam. All questions are given equal weight. Points will not be deducted for incorrect answers, and no points will be given to unanswered questions. Unless otherwise indicated, the domain of a function f is the set of all real numbers. If the exact numerical value does not appear among the given choices, select the best approximate value. The use of a calculator is permitted in this part of the exam.
76 . The position function of a moving particle is s (t ) = 5 + 4t – t 2 for 0 ≤ t ≤ 10 where s is in meters and t is measured in seconds. What is the maximum speed in m/sec of the particle on the interval 0 ≤ t ≤ 10?
(A) – 16
(B) 2
(C) 4
(D) 16
77 . How many points of inflection does the graph of y = cos (x 2 ) have on the interval (0, π)?
(A) 0
(B) 1
(C) 2
(D) 3
78 . Let f be a continuous function on [4, 10] and have selected values as shown below:
Using three right endpoint rectangles of equal length, what is the approximate value of 
(A) 8.4
(B) 9.6
(C) 14.4
(D) 16.8
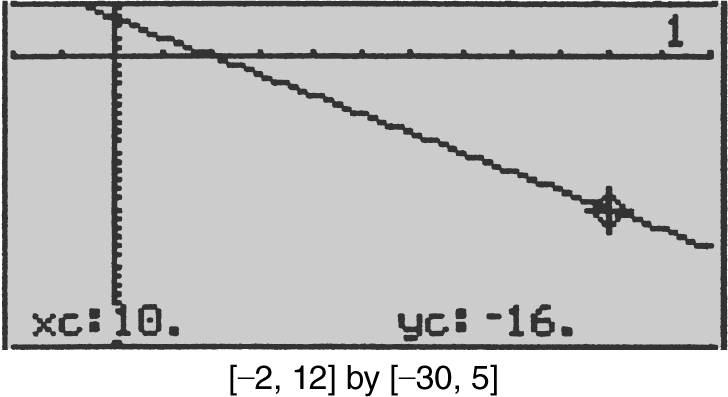
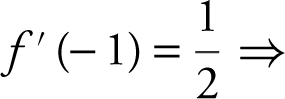
79 . Given a differentiable function f with f (– 1) = 2 and  . Using a tangent line to the graph of f at x = – 1 find an approximate value of f (– 1.1)?
(A) –3.05
(B) – 1.95
(C) 0.95
(D) 1.95
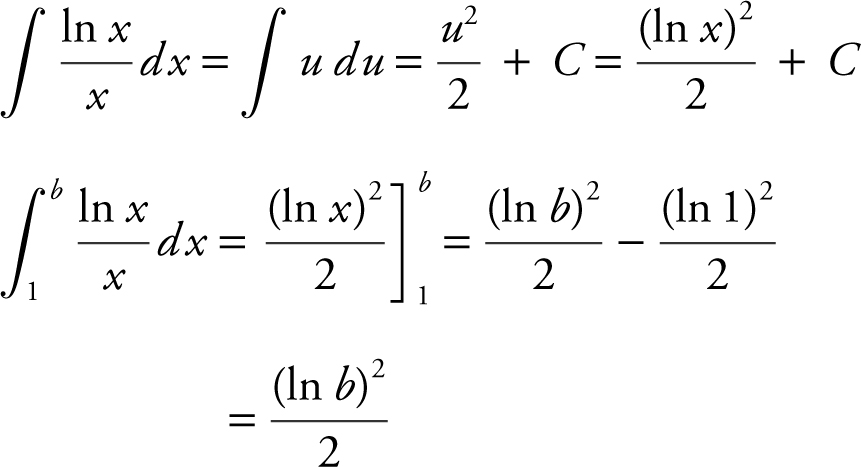
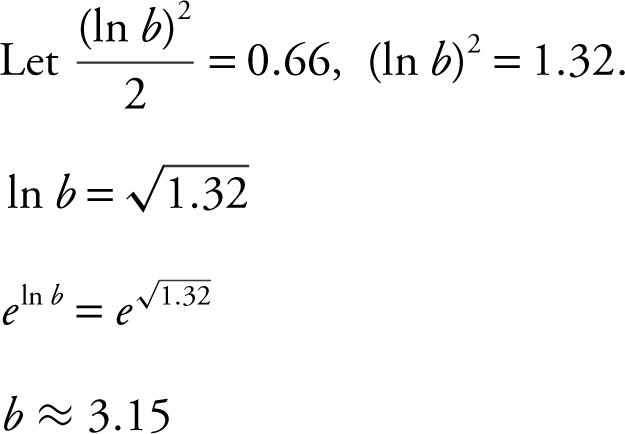
80 . If area under the curve of  is 0.66 from x = 1 to x = b , where b > 1, then the value of b is approximately,
(A) 1.93
(B) 2.25
(C) 3.15
(D) 3.74
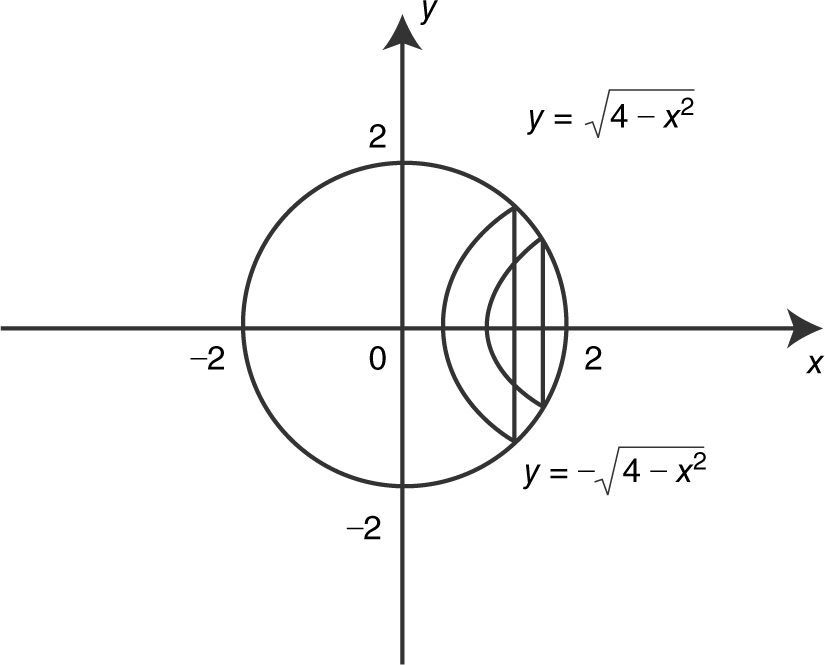
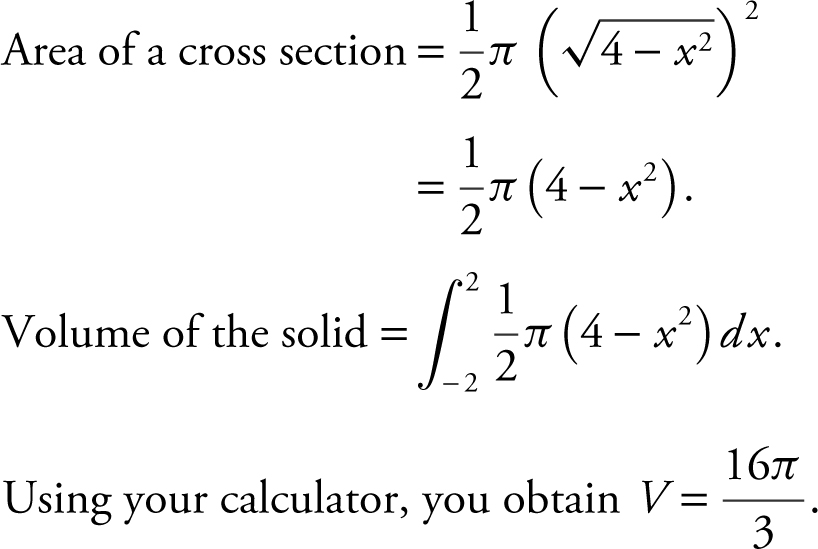
81 . The base of a solid is a region enclosed by the circle x 2 + y 2 = 4. What is the approximate volume of the solid if the cross sections of the solid perpendicular to the x -axis are semicircles?
(A) 8π
(B) 
(C) 
(D) 
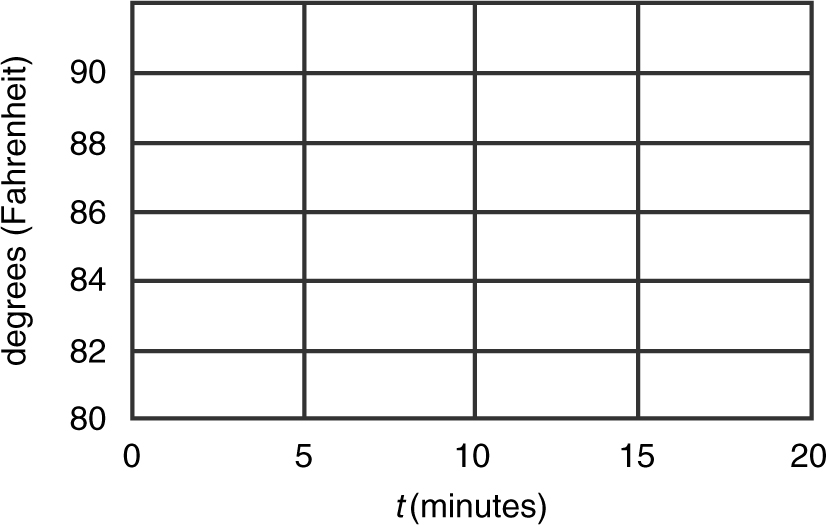
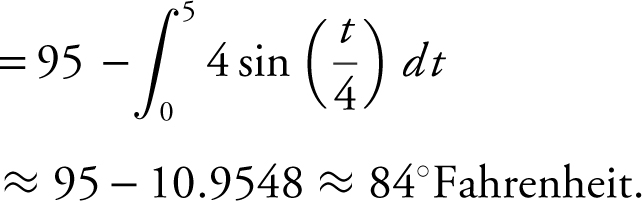
82 . The temperature of a cup of coffee is dropping at the rate of  degrees for 0 ≤ t ≤ 5, where f is measured in Fahrenheit and t in minutes. If initially, the coffee is 95°F, find its temperature to the nearest degree Fahrenheit 5 minutes later.
(A) 84
(B) 85
(C) 91
(D) 92
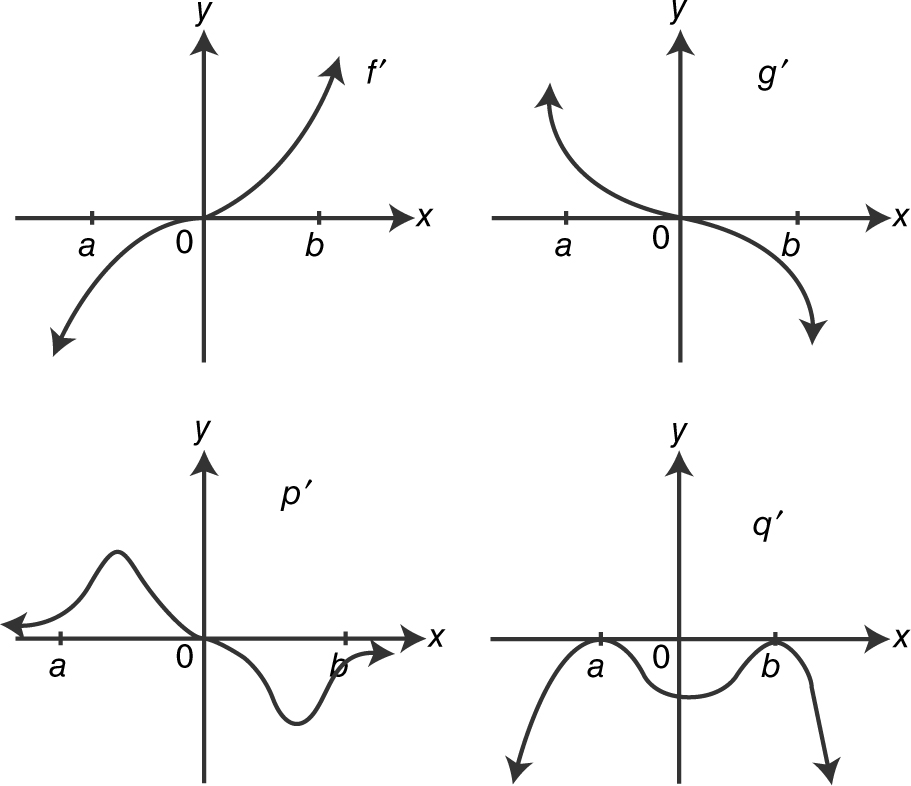
83 . The graphs of f ′, g ′, p ′, and q ′ are shown below. Which of the functions f , g , p , or q have a relative minimum on (a , b )?
(A) f only
(B) g only
(C) p only
(D) q only
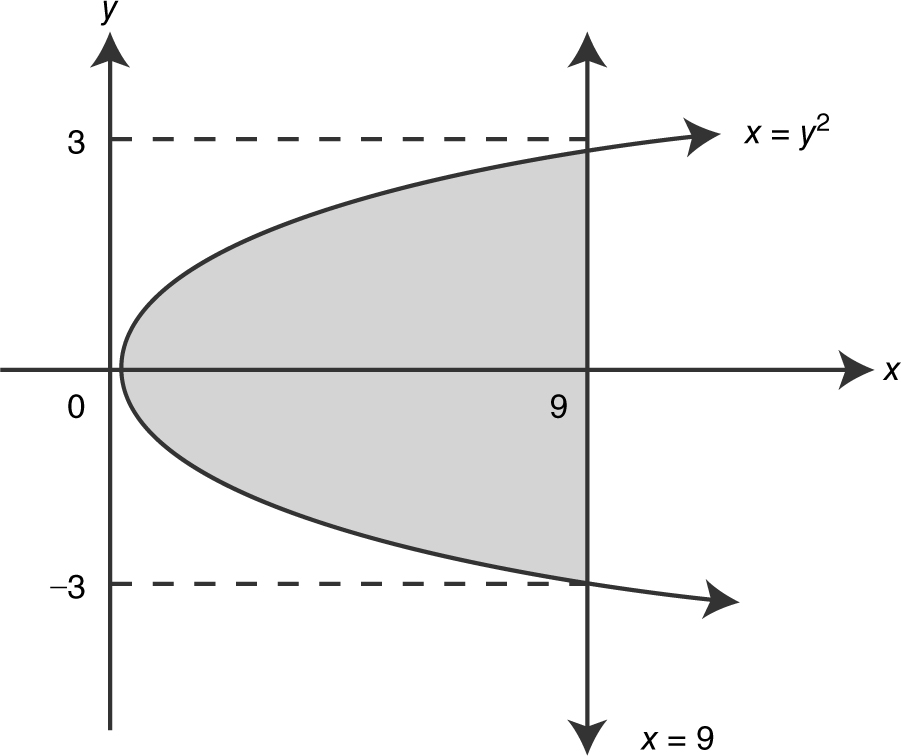
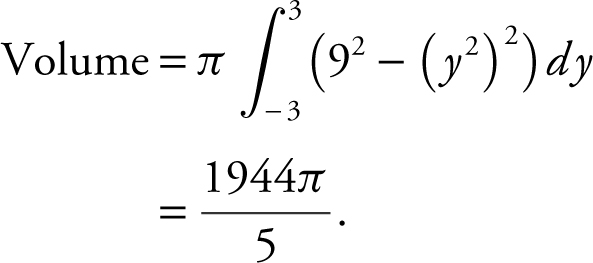
84 . What is the volume of the solid obtained by revolving the region enclosed by the graphs of x = y 2 and x = 9 about the y -axis?
(A) 36π
(B) 
(C) 
(D) 
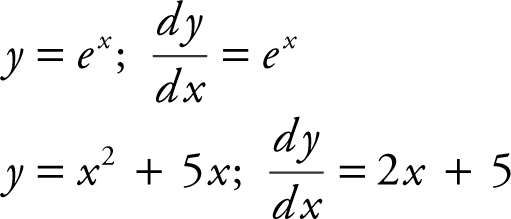
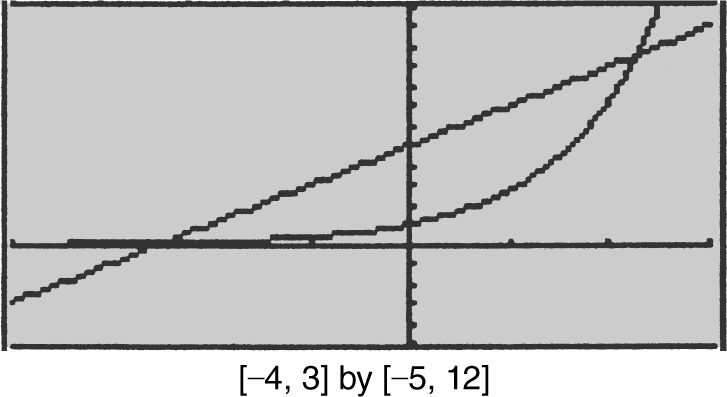
85 . At what value(s) of x do the graphs of y = ex and y = x 2 + 5x have parallel tangent lines?
(A) – 2.5
(B) 0
(C) 0 and 5
(D) – 2.45 and 2.25
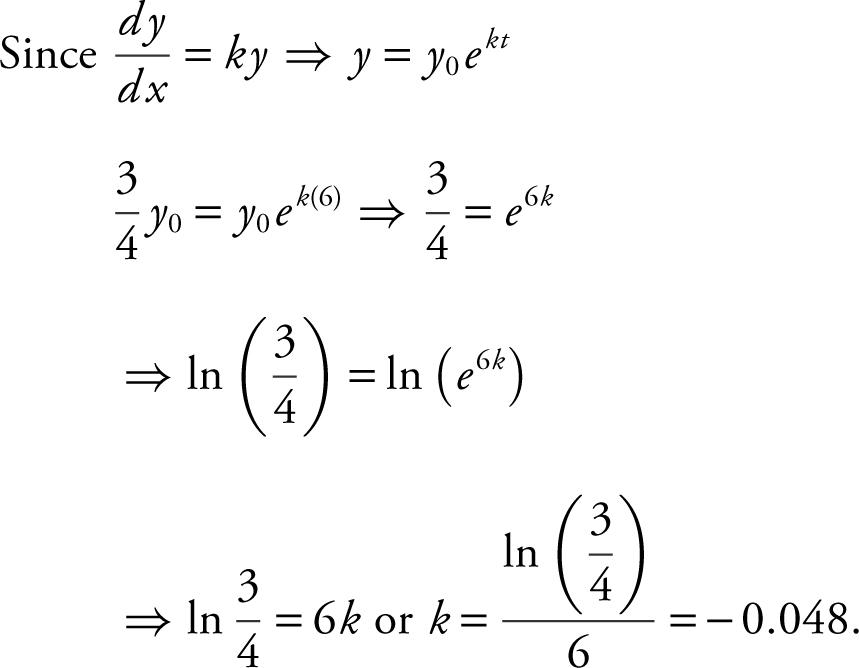
86 . Let y represent the population in a town. If y decreases according to the equation  , with t measured in years, and the population decreases by 25% in 6 years, then k =
(A) – 8.318
(B) – 1.726
(C) – 0.231
(D) – 0.048
87 . If  on [4, 8], then h has a local minimum at x =
(A) 4
(B) 5
(C) 6
(D) 7
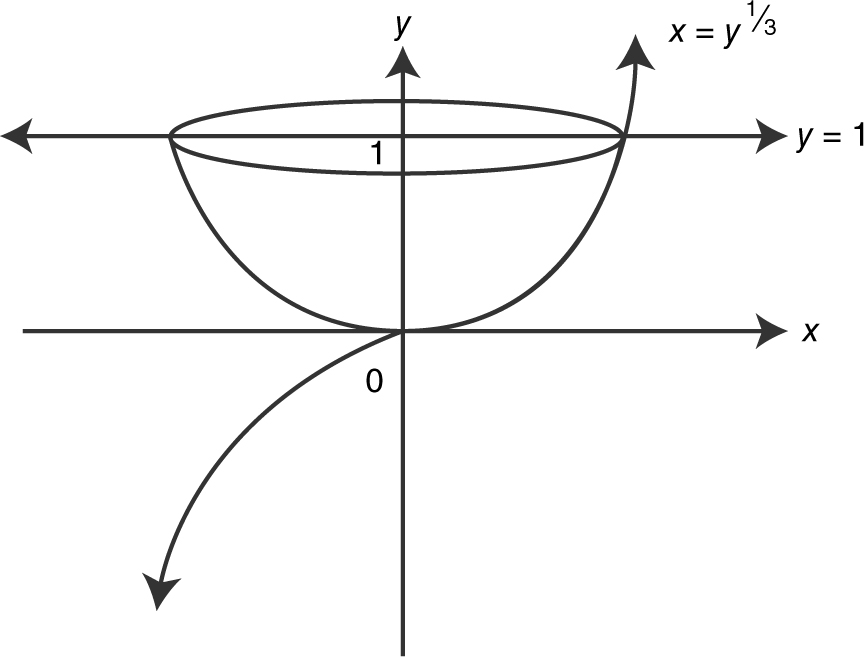
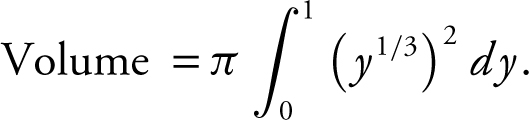
88 . The volume of the solid generated by revolving the region bounded by the graph of y = x 3 , the line y = 1, and the y -axis about the y -axis is
(A) ![]()
(B) 
(C) 
(D) 
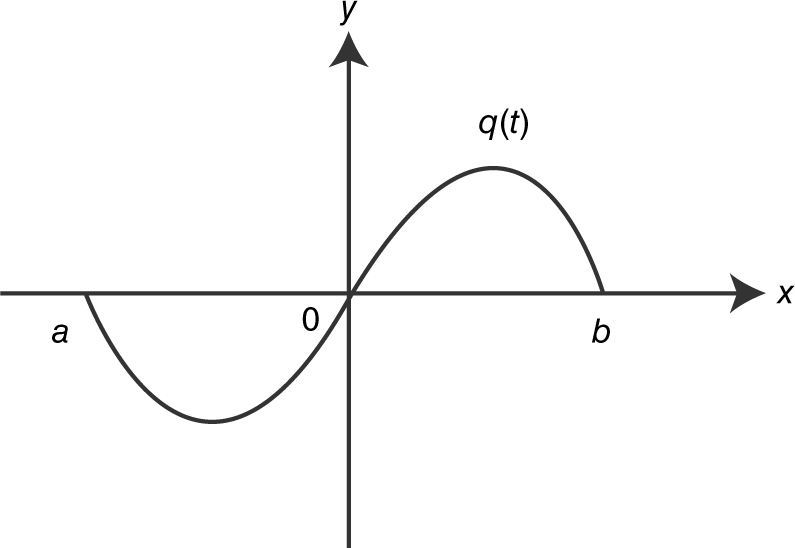
89 . If 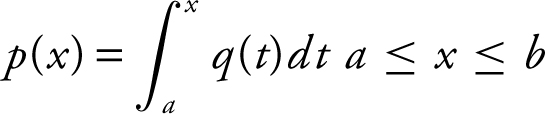 and the graph of q is shown above, which of the graphs shown below is a possible graph of p ?
(A) 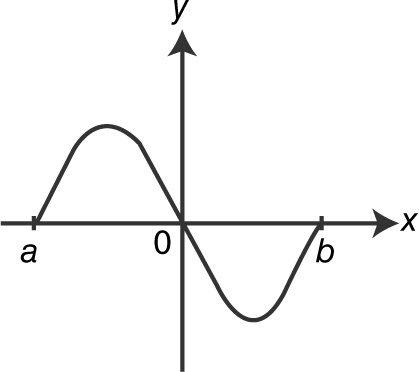
(B) 
(C) 
(D) 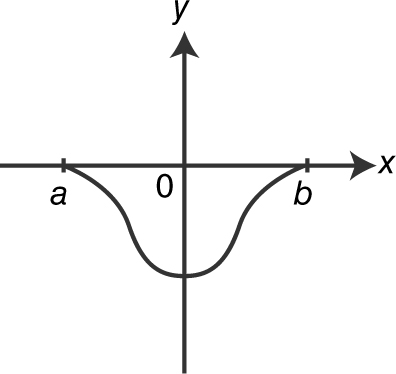
90 . The equation of the tangent line to the graph of y = sin x for 0 ≤ x ≤ π at the point where  is
is
(A) 
(B) 
(C) 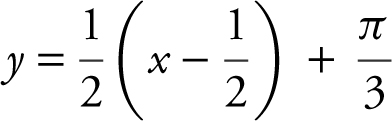
(D) 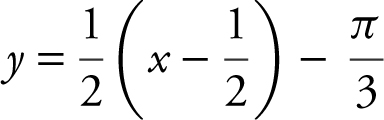
STOP. AP Calculus AB Practice Exam 2 Section I—Part B
Section II—Part A

Directions:
Show all work. You may not receive any credit for correct answers without supporting work. You may use an approved calculator to help solve a problem. However, you must clearly indicate the setup of your solution using mathematical notations and not calculator syntax. Calculators may be used to find the derivative of a function at a point, compute the numerical value of a definite integral, or solve an equation. Unless otherwise indicated, you may assume the following: (a) the numeric or algebraic answers need not be simplified; (b) your answer, if expressed in approximation, should be correct to 3 places after the decimal point; and (c) the domain of a function f is the set of all real numbers.
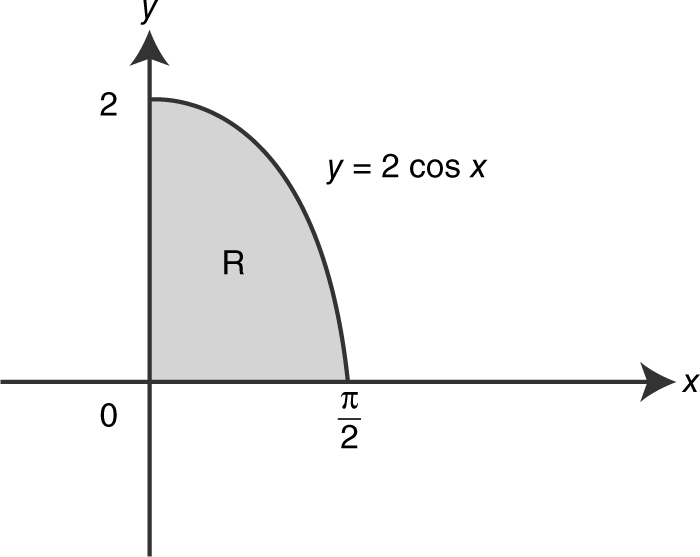
1 . Let R be the region in the first quadrant enclosed by the graph of y = 2 cos x , the x -axis, and the y -axis.
(A) Find the area of the region R .
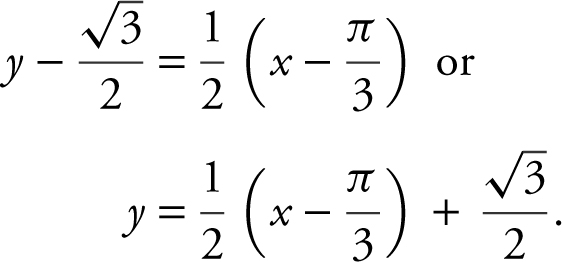
(B) If the line x = a divides the region R into two regions of equal area, find a .
(C) Find the volume of the solid obtained by revolving region R about the x -axis.
(D) If R is the base of a solid whose cross sections perpendicular to the x -axis are semicircles, find the volume of the solid.
2 . The temperature of a liquid at a chemical plant during a 20-minute period is given as  , where g (t ) is measured in degrees Fahrenheit, 0 ≤ t ≤ 20 and t is measured in minutes.
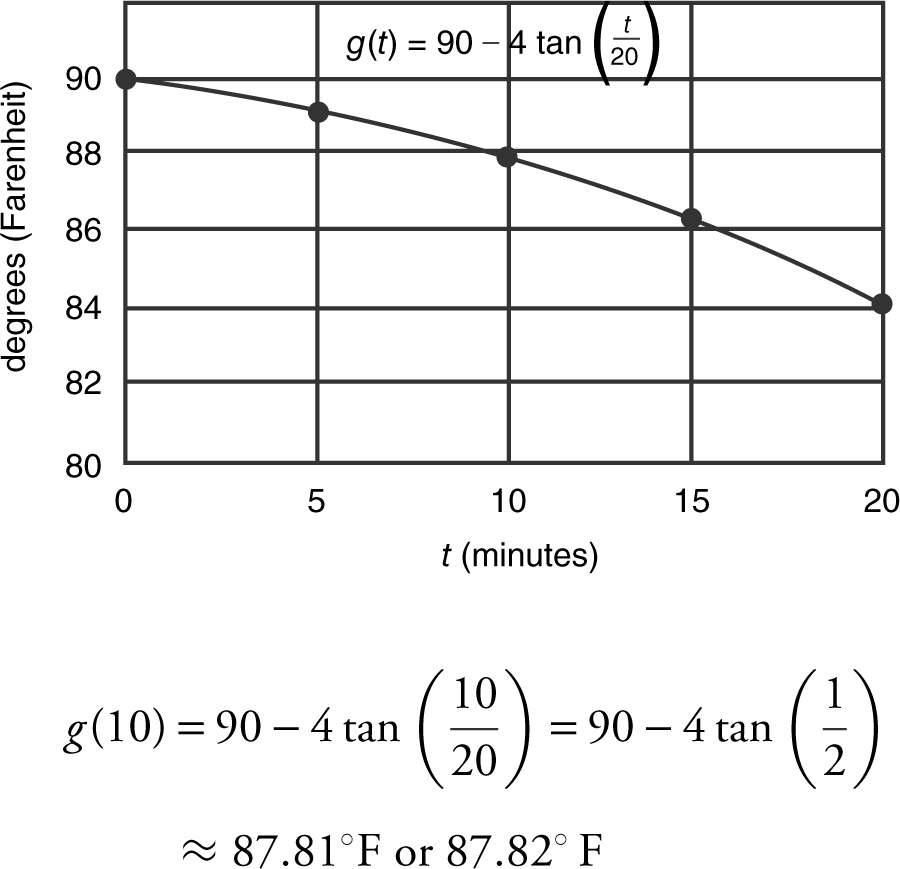
(A) Sketch the graph of g on the provided grid. What is the temperature of the liquid to the nearest hundredth of a degree Fahrenheit when t = 10? (See below.)
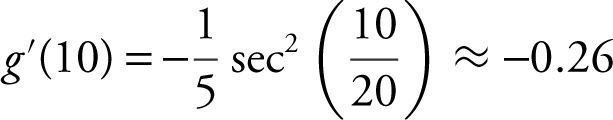
(B) What is the instantaneous rate of change of the temperature of the liquid to the nearest hundredth of a degree Fahrenheit at t = 10?
(C) At what values of t is the temperature of the liquid below 86°F?
(D) During the time within the 20-minute period when the temperature is below 86°F, what is the average temperature to the nearest hundredth of a degree Fahrenheit?
STOP. AP Calculus AB Practice Exam 2, Section II—Part A.
Section II—Part B
Directions:
The use of a calculator is not permitted in this part of the exam. When you have finished this part of the exam, you may return to the problems in Part A of Section II and continue to work on them. However, you may not use a calculator. You should show all work. You may not receive any credit for correct answers without supporting work. Unless otherwise indicated, the numeric or algebraic answers need not be simplified, and the domain of a function fis the set of all real numbers.
3 . A particle is moving on a coordinate line. The graph of its velocity function v (t ) for 0 ≤ t ≤ 24 seconds is shown below.
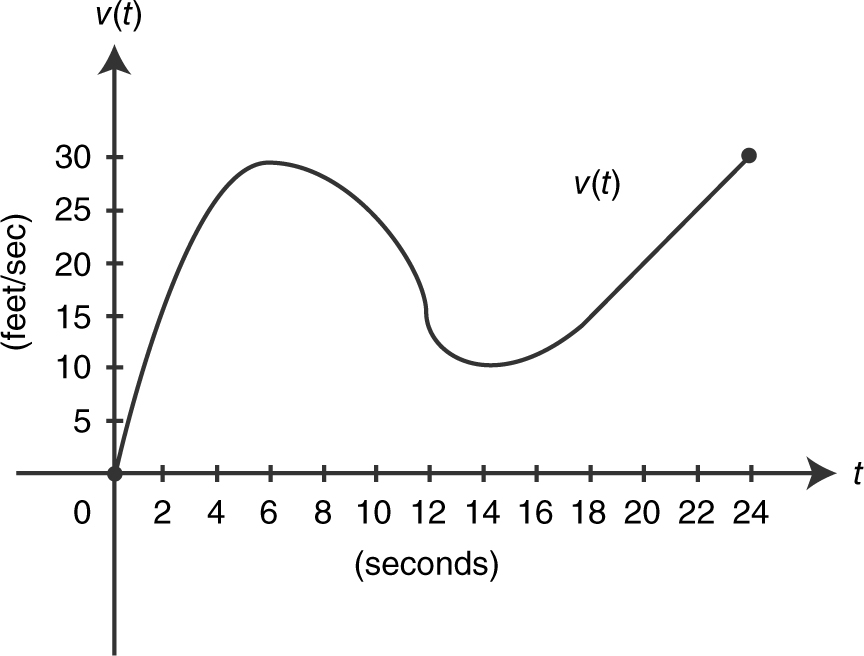
(A) Using midpoints of the three subintervals of equal length, find the approximate value  .
.
(B) Using the result in part (A), find the average velocity over the interval 0 ≤ t ≤ 24 seconds.
(C) Find the average acceleration over the interval 0 ≤ t ≤ 24 seconds.
(D) When is the acceleration of the particle equal to zero?
(E) Find the approximate acceleration at t = 20 seconds.
4 . Given the function f (x ) = 3e −2x ,
(A) at what value(s) of x , if any, is f ′(x ) = 0?
(B) at what value(s) of x , if any, is f ′(x ) = 0?
(C) find  and
and  .
.
(D) find the absolute maximum value of f and justify your answer.
(E) show that if f (x ) = ae −bx 2 where a > 0 and b > 0, the absolute maximum value of f is a .
5 . The function f is defined as 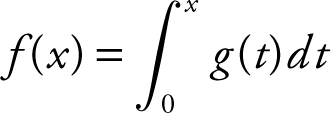 where the graph of g consists of five line segments as shown below.
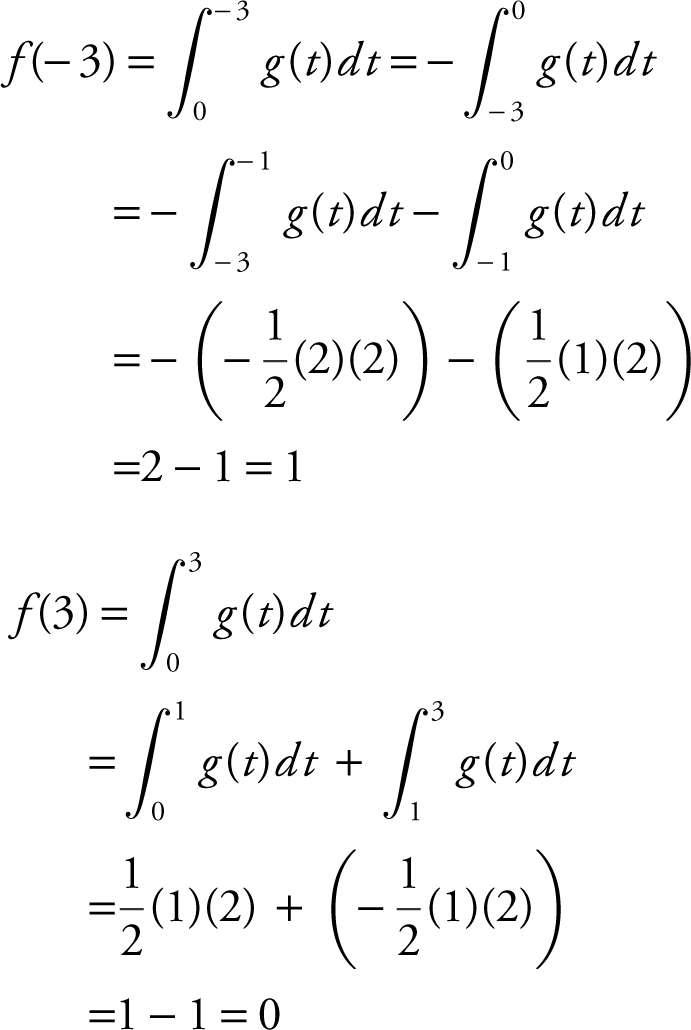
(A) Find f (− 3) and f (3).
(B) Find all values of x on (− 3, 3) such that f has a relative maximum or minimum. Justify your answer.
(C) Find all values of x on (− 3, 3) such that the graph f has a change of concavity. Justify your answer.
(D) Write an equation of the line tangent to the graph to f at x = 1.
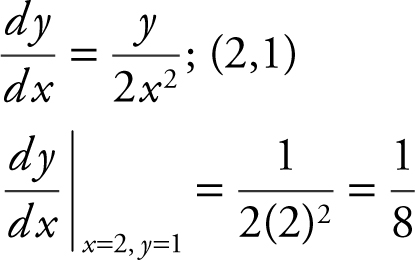
6 . The slope of a function f at any point (x , y ) is  . The point (2, 1) is on the graph of f .
(A) Write an equation of the tangent line to the graph of f at x = 2.
(B) Use the tangent line in part (A) to approximate f (2.5).
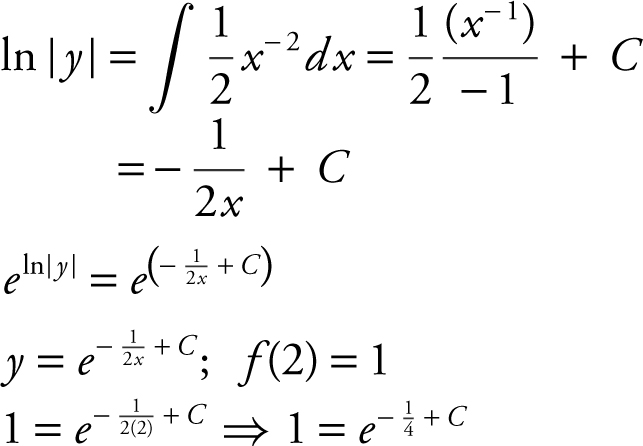
(C) Solve the differential equation 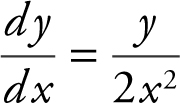 with the initial condition f (2) = 1.
(D) Use the solution in part (C) and find f (2.5).
STOP. AP Calculus AB Practice Exam 2, Section II—Part B.
Answers to AB Practice Exam 2—Section I
Part A
1 . B
2 . B
3 . C
4 . D
5 . D
6 . A
7 . B
8 . D
9 . C
10 . A
11 . D
12 . C
13 . C
14 . A
15 . C
16 . D
17 . A
18 . A
19 . A
20 . D
21 . C
22 . D
23 . C
24 . C
25 . A
26 . B
27 . D
28 . D
29 . D
30 . D
Part B
76 . D
77 . D
78 . D
79 . D
80 . C
81 . B
82 . A
83 . A
84 . D
85 . D
86 . D
87 . B
88 . C
89 . D
90 . B
Answers to AB Practice Exam 2—Section II
Part A
1 . 
2 . 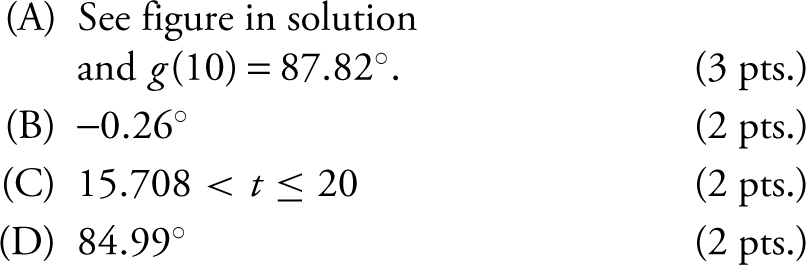
Part B
3 . 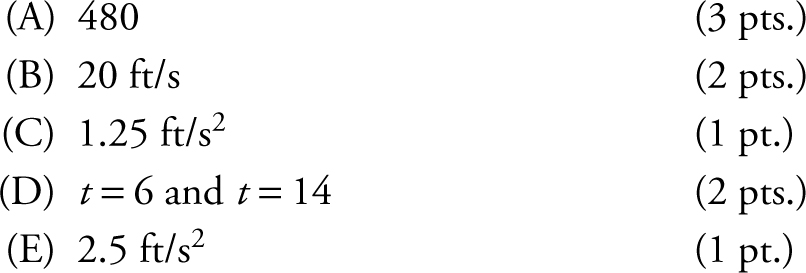
4 . 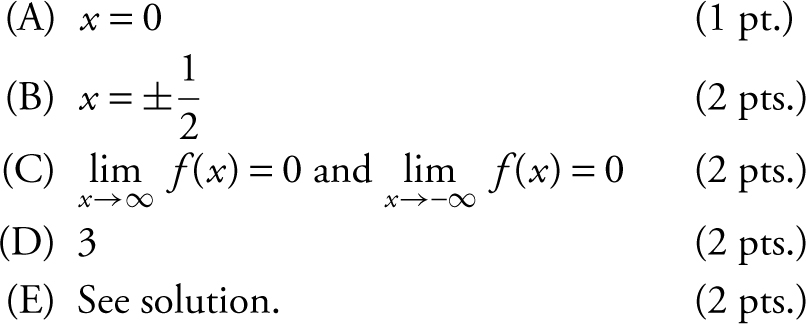
5 . 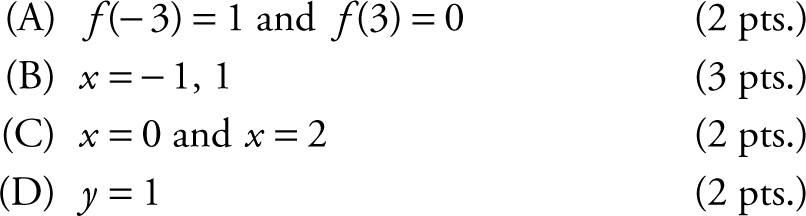
6 . 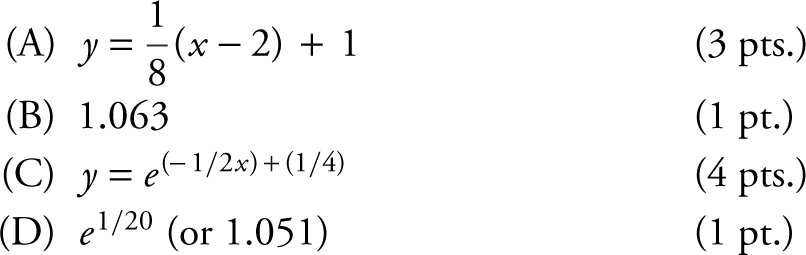
Solutions to AB Practice Exam 2—Section I
Section I—Part A
1 . The correct answer is (B).
2 . The correct answer is (B).
The  , and
, and  . Therefore,
 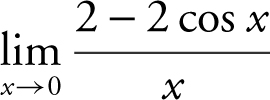 is an indeterminate form of
 ![]() . Applying L’Hôpital’s Rule, you have
. Applying L’Hôpital’s Rule, you have 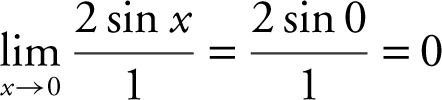 .
.
3 . The correct answer is (C).
4 . The correct answer is (D).
5 . The correct answer is (D).
6 . The correct answer is (A).
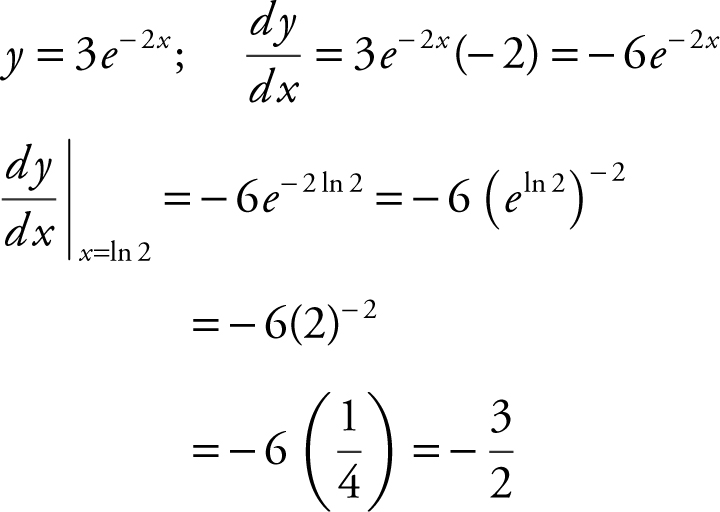
Slope of normal line at x = ln 2 is ![]() .
.
At x = ln 2, 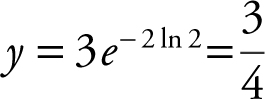 ; point
 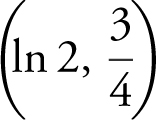 .
.
Equation of normal line:
 or
or  .
.
7 . The correct answer is (B).
8 . The correct answer is (D).
Let u = x 3 + 1, du = 3x 2 dx or  .
.
9 . The correct answer is (C).
Statement I is not true , e.g.,
 .
.
Statement II is always true since
 by properties of definite integrals.
Statement III is not true , e.g.,
 .
.
10 . The correct answer is (A).
f (0) = 0; f ′(0) < 0 since f is decreasing and f ″ < 0, f is concave downward. Thus, f (0) has the largest value.
11 . The correct answer is (D).
12 . The correct answer is (C).
Let u = 4x ; 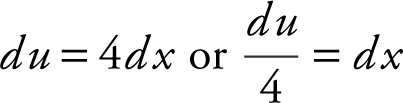 .
.
13 . The correct answer is (C).
The total amount of water leaked from the tank for
14 . The correct answer is (A).
15 . The correct answer is (C).
16 . The correct answer is (D).
17 . The correct answer is (A).
 is an odd function. The function whose graph is shown in (A) is the only odd function.
18 . The correct answer is (A).
If b = 0, then r = 3, but r cannot be 3. If b = 1, or 3, f would have more than one root. Thus, of all the choices, the only possible value for b is – 1.
19 . The correct answer is (A).
20 . The correct answer is (D).
21 . The correct answer is (C).
I. f is differentiable on (a , b ) since the graph is a smooth curve.
II. There exists a horizontal tangent to the graph on (a , b ); thus, f ′(k ) = 0 for some k on (a , b ).
III. The graph is concave downward; thus f ″< 0.
22 . The correct answer is (D).
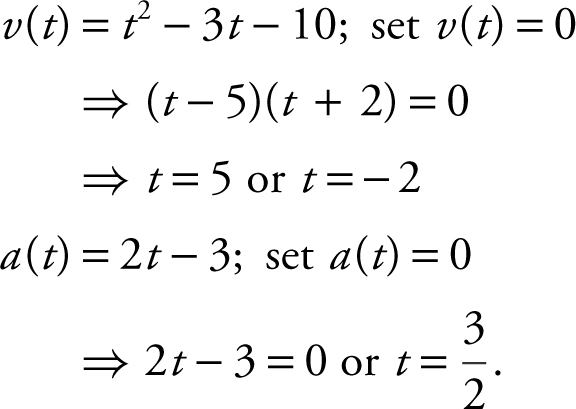
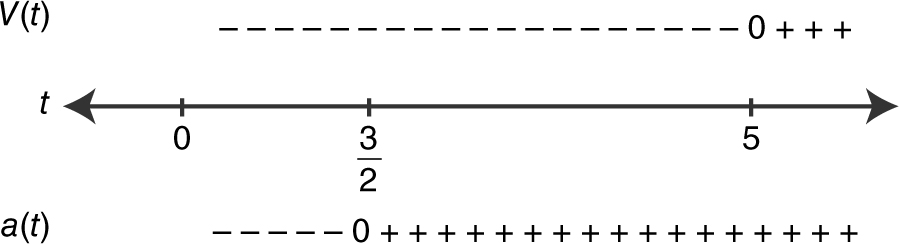
Since v (t ) and a (t ) are both negative on (0, 3/2), and are both positive on (5, ∞), the particle’s speed is increasing on these intervals.
23 . The correct answer is (C).
24 . The correct answer is (C).
25 . The correct answer is (A).
26 . The correct answer is (B).
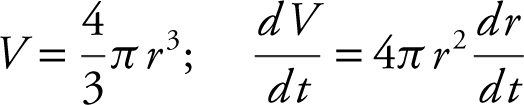
Since 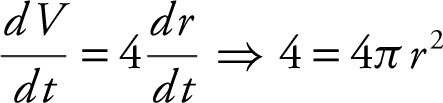 or
or
 .
.
27 . The correct answer is (D).
 . Substituting (0, 4)
 .
.
Thus, a solution is  .
.
28 . The correct answer is (D).
29 . The correct answer is (D).
At x = x 3 , f ′ = 0. Thus the tangent to the graph of f atx = x 3 is horizontal.
30 . The correct answer is (D).
The function f is not differentiable at x = 3, has an absolute maximum at x = 3, and has no point of inflection. Thus, all three statements are not true.
Section I—Part B
76 . The correct answer is (D).
s (t ) = 5 + 4t – t 2 ; v (t ) = s ′(t ) = 4 – 2t
Since v (t ) is a straight line with a negative slope, the maximum speed for 0 ≤ t ≤ 10 occurs at t = 10 where v (t ) = 4 – 2(10) = – 16. Thus maximum speed = 16.
77 . The correct answer is (D).
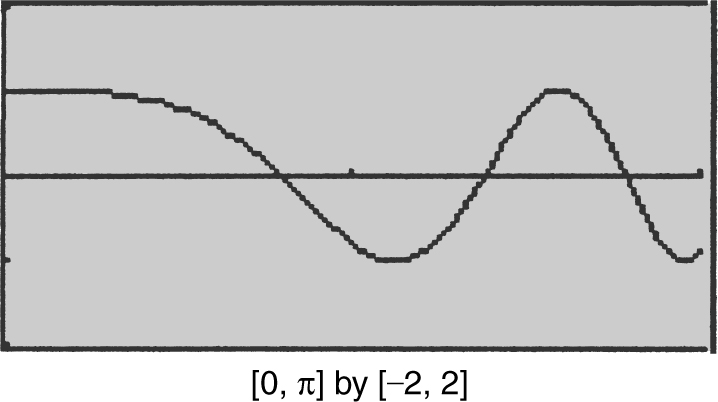
Using the [ Inflection ] function of your calculator, you will find three points of inflection. They occur at x = 1.335, 2.195, and 2.8.
78 . The correct answer is (D).
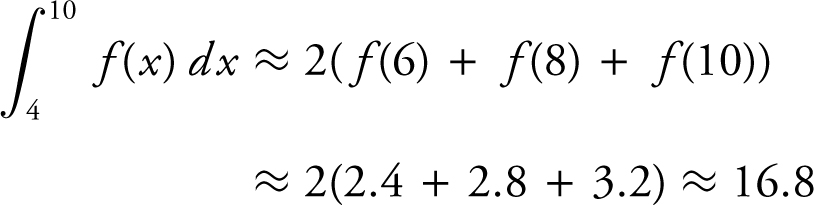 .
.
79 . The correct answer is (D).
f (– 1) = 2 ⇒ point (– 1, 2).
 the slope at x = – 1 is
 ![]() .
.
Equation of tangent at x = – 1 is  . Thus,
  .
.
80 . The correct answer is (C).
 .
.
Let u = ln x ;  .
.
81 . The correct answer is (B).
82 . The correct answer is (B).
Temperature of coffee
83 . The correct answer is (A).
Only f has a relative minimum on (a , b ).
84 . The correct answer is (D).
85 . The correct answer is (D).
If the graphs have parallel tangents at a point, then the slopes of the tangents are equal. Enter y 1 = e x and y 2 = 2x + 5. Using the [Intersection ] function on your calculator, you obtain x = – 2.45 and x = 2.25.
86 . The correct answer is (D).
87 . The correct answer is (B).
h ′(x ) = (x – 5)3
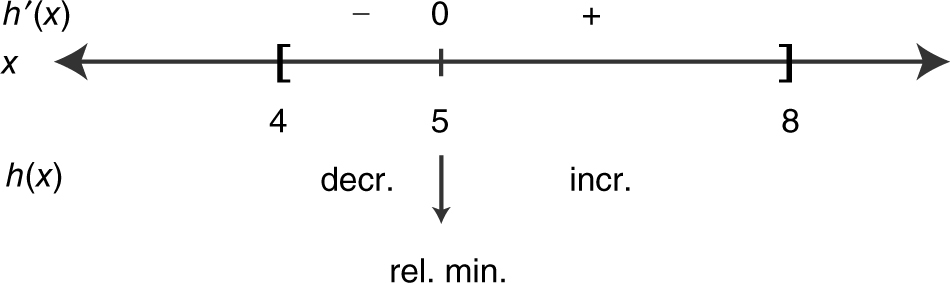
Thus, h has a relative minimum at x = 5.
88 . The correct answer is (C).
Using your calculator, you obtain V = 3π/5.
89 . The correct answer is (D).
The graph in choice (D) is the one that satisfies the behavior of p .
90 . The correct answer is (B).
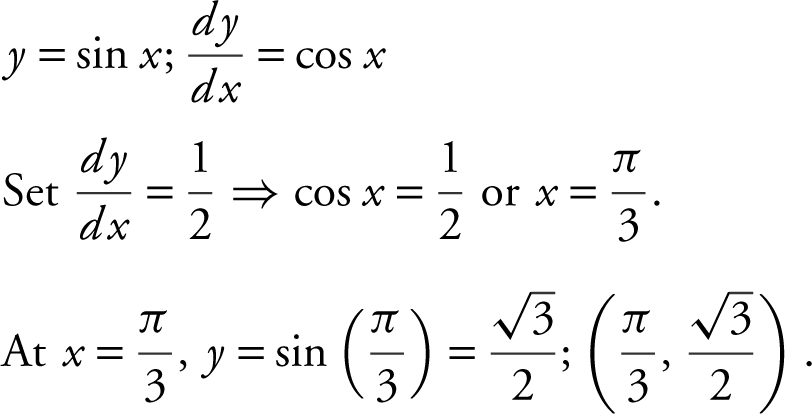
Equation of tangent line at  :
:
Solutions to AB Practice Exam 2—Section II
Section II—Part A
1 .
(A) 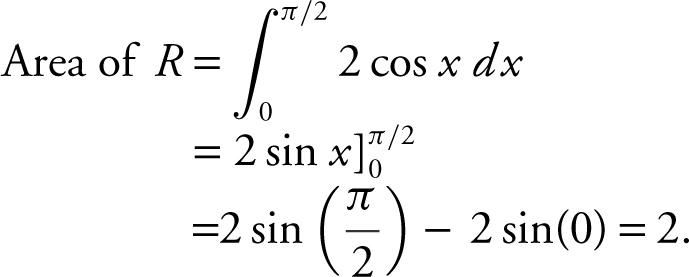
(B) 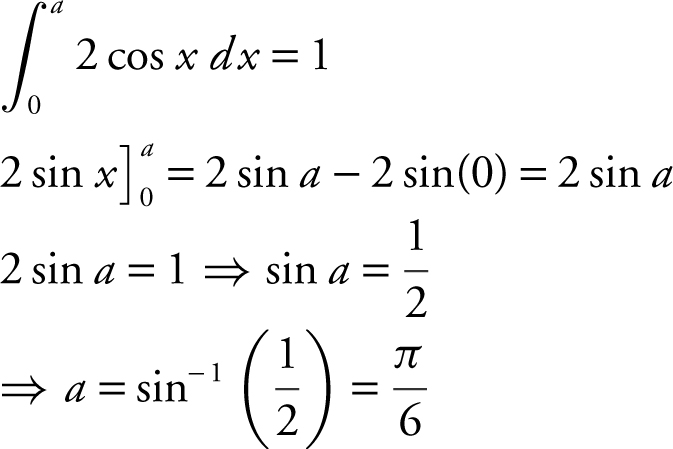
(C) 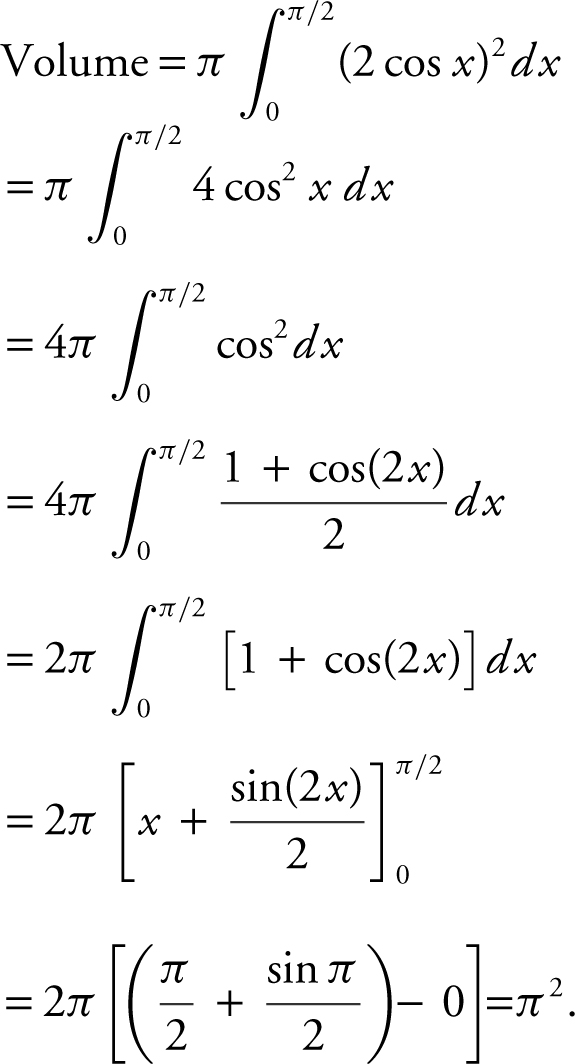
(D) 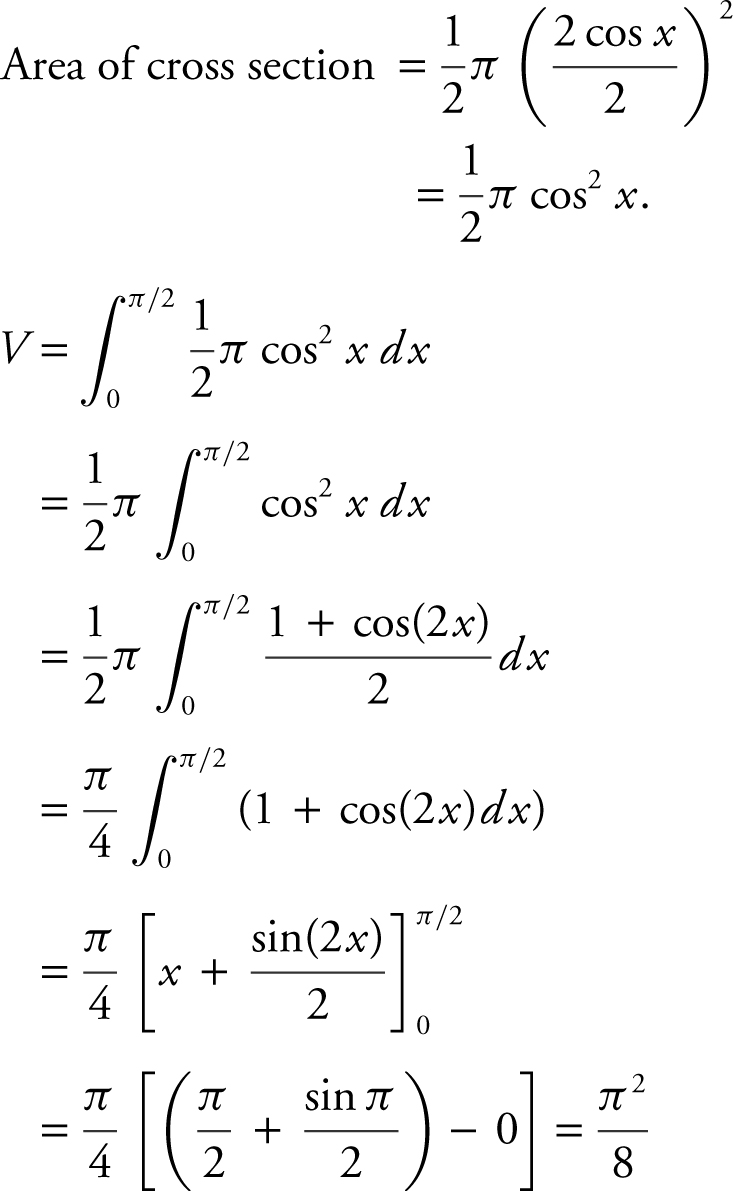
2 . (A)
(B) 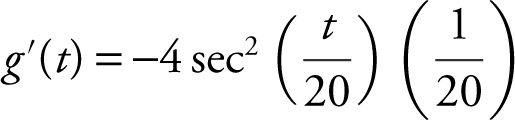
(C) Set the temperature of the liquid equal to 86°F. Using your calculator, let 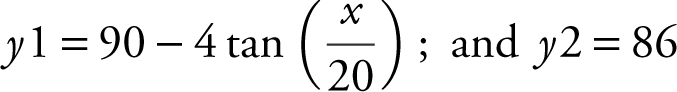 . To find the intersection point of y 1 and y 2 , let y 3 = y 2 and find the zeros of y 3 . Using the [Zero ] function of your calculator, you obtain x = 15.708. Since y 1 < y 2 on the interval 15.708 < x ≤ 20, the temperature of the liquid is below 86.°F when 15.708 < t ≤ 20.
(D) Average temperature below 86° 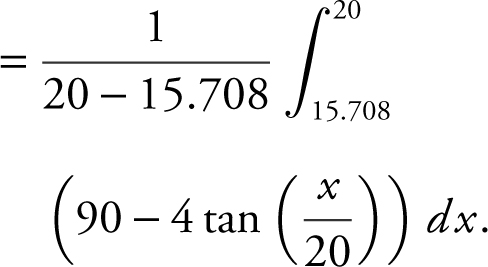 Using your calculator, you obtain:
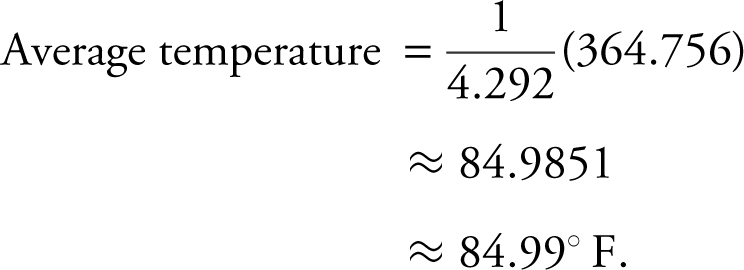
Section II—Part B
3 . (A) The midpoints of 3 subintervals of equal length are:
t = 4, 12, and 20.
The length of each interval is  .
.
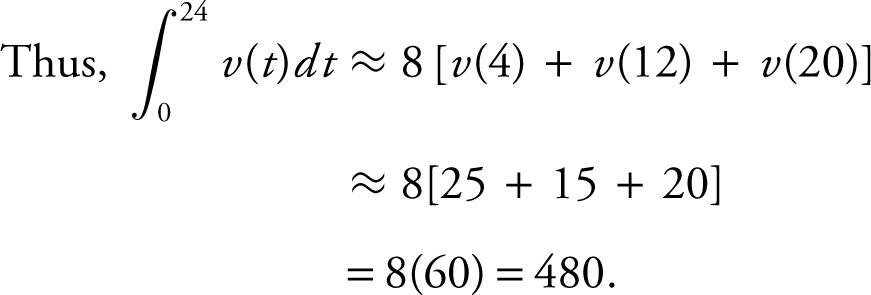
(B) 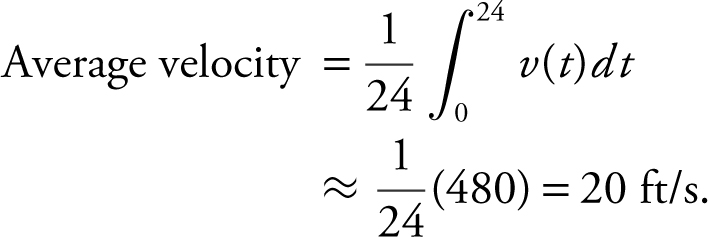
(C) 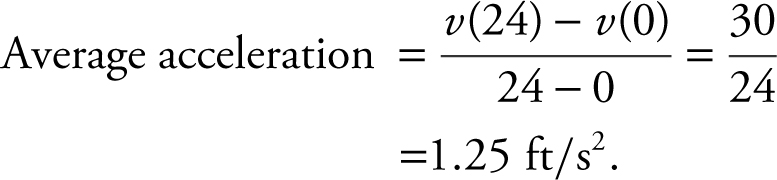
(D) a (t ) = 0 at t = 6 and t = 14, since the slopes of tangents at t = 6 and t = 14 are 0.
(E) 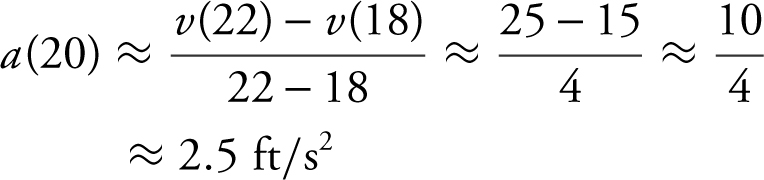
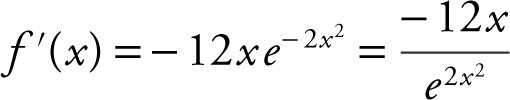
4 . (A) f ′(x ) = 3(e −2x 2 )(–4x ) = – 12xe −2x 2 Setting f ′(x ) = 0, – 12xe −2x 2 = 0 ⇒ x = 0.
(B) 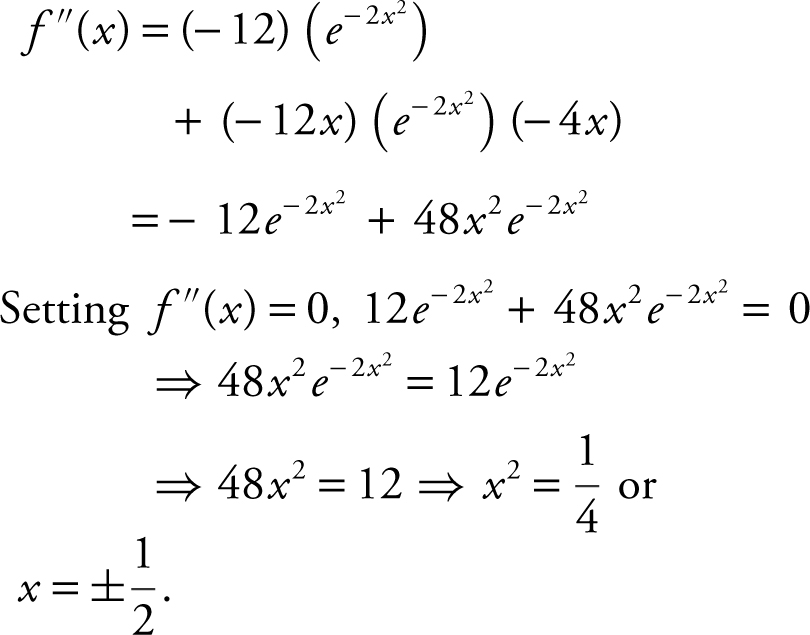
(C) 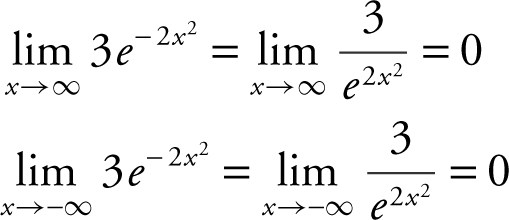
(D)
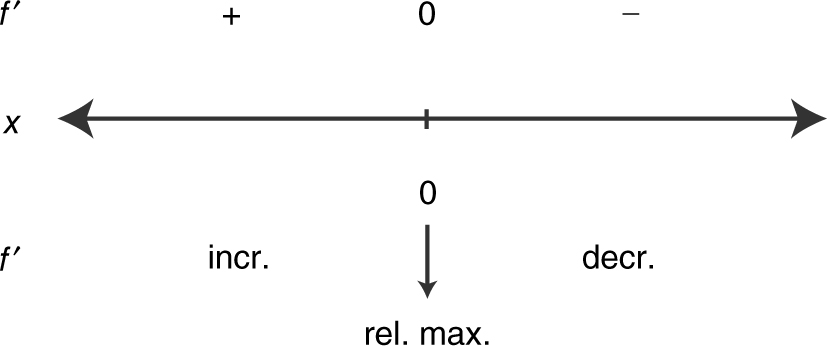
f (0) = 3, since f has only one critical point (at x = 0), thus at x = 0, f has an absolute maximum. The absolute maximum value is 3.
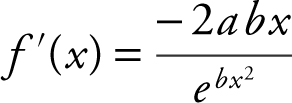
(E) f (x ) = ae −bx 2 , a > 0, b > 0
f ′(x ) = ae −bx 2 (–2bx ) = –2abxe −bx 2
Setting
f ′(x ) = 0, –2abxe −bx 2 = 0 ⇒ x = 0
 .
.
f ′(x ) > 0 if x < 0 and f ′(x ) < 0 if x > 0. Thus, f has a relative maximum at x = 0, and since it is the only critical point, f has an absolute maximum at x = 0. Since f (0) = a , the absolute maximum for f is a .
5 . (A)
(B) Note that f ′(x ) = g (x ), and g (x ) < 0 on (– 3, – 1) and (1, 3) and that g (x ) > 0 on (− 1, 1). The function f increases on (−1, 1) and decreases on (1, 3). Thus f has a relative maximum at x = 1. Also, f decreases on (− 3, – 1) and increases on (− 1, 1). Thus, f has a relative minimum at x = – 1.
(C) f ′(x ) = g (x ) and f ″(x ) = g ′(x )
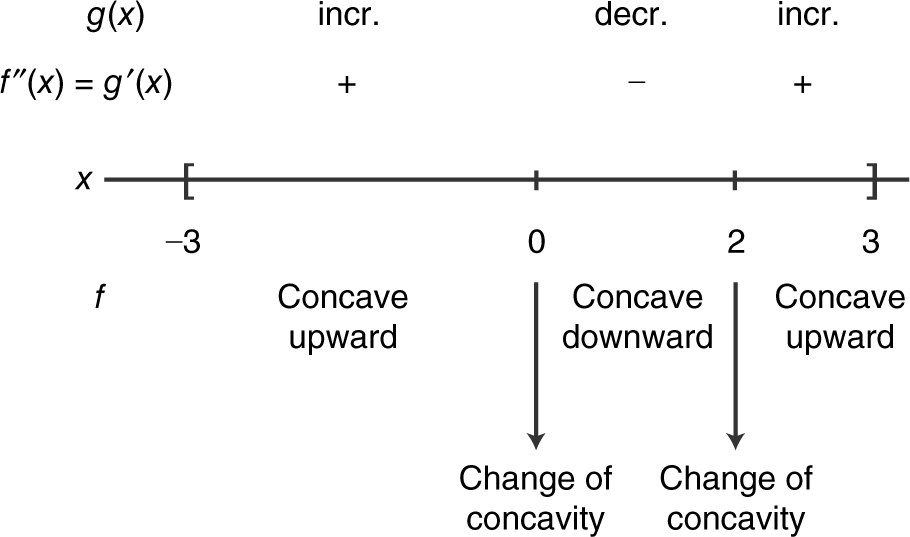
The function f has a change of concavity at x = 0 and x = 2.
(D) 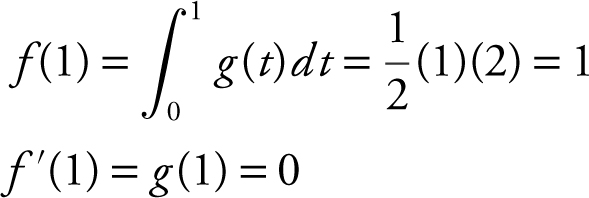
Thus, m = 0, point (1, 1); the equation of the tangent line to f (x ) at x = 1 is y = 1.
6 . (A)
Equation of tangent:
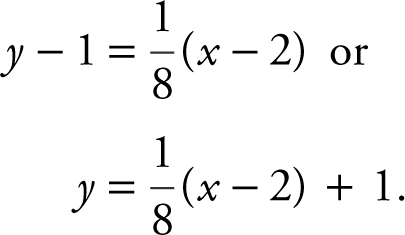
(B) 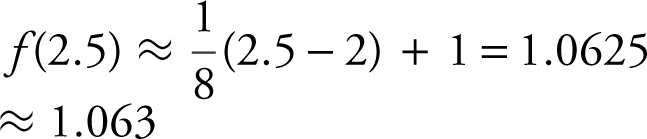
(C) 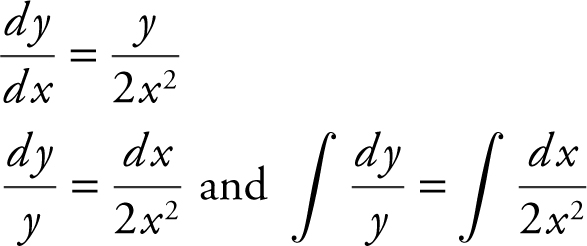
Since 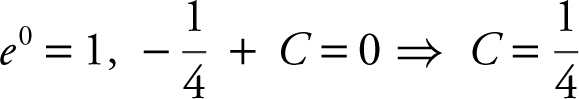 .
.
Thus,  .
.
(D) 
Scoring Sheet for AB Practice Exam 2
Section I—Part A

Section I—Part B

Section II—Part A (Each question is worth 9 points.)

Section II—Part B (Each question is worth 9 points.)

Total Raw Score (Subtotals A + B + C + D) =