5 Steps to a 5: AP Calculus AB 2017 (2016)
STEP 4
Review the Knowledge You Need to Score High
CHAPTER 5 Review of Precalculus
BIG IDEA 1: Limits
CHAPTER 6 Limits and Continuity
BIG IDEA 2: Derivatives
CHAPTER 7 Differentiation
CHAPTER 8 Graphs of Functions and Derivatives
CHAPTER 9 Applications of Derivatives
BIG IDEA 3: Integrals and the Fundamental Theorem of Calculus
CHAPTER 10 More Applications of Derivatives
CHAPTER 11 Integration
CHAPTER 12 Definite Integrals
CHAPTER 13 Areas and Volumes
CHAPTER 14 More Applications of Definite Integrals
CHAPTER 5
Review of Precalculus
IN THIS CHAPTER
Summary: Many questions on the AP Calculus exam require the application of precalculus concepts. In this chapter, you will be guided through a summary of these precalculus concepts including the properties of lines, inequalities, and absolute values, and the behavior of functions and inverse functions. It is important that you review this chapter thoroughly. Your ability to solve the problems here is a prerequisite to doing well on the AP Calculus AB exam.

Key Ideas
![]() Writing an equation of a line
Writing an equation of a line
![]() Solving inequalities
Solving inequalities
![]() Working with functions and inverse functions
Working with functions and inverse functions
![]() Properties of trigonometric and inverse trigonometric functions
Properties of trigonometric and inverse trigonometric functions
![]() Properties of exponential and logarithmic functions
Properties of exponential and logarithmic functions
![]() Properties of odd and even functions
Properties of odd and even functions
![]() Behaviors of increasing and decreasing functions
Behaviors of increasing and decreasing functions
5.1 Lines
Main Concepts: Slope of a Line, Equations of a Line, Parallel and Perpendicular Lines
Slope of a Line
Given two points A (x 1 , y 1 ) and B (x 2 , y 2 ), the slope of the line passing through the two given points is defined as
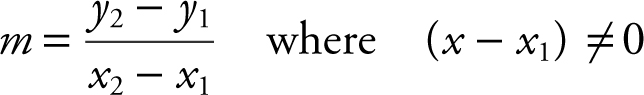
Note that if (x 2 – x 1 ) = 0, then x 2 = x 1 , which implies that points A and B are on a vertical line parallel to the y -axis, and thus, the slope is undefined .
Example 1
Find the slope of the line passing through the points (3, 2) and (5, –4).
Using the definition  , the slope of the line is
 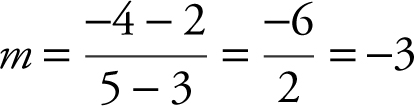 .
.
Example 2
Find the slope of the line passing through the points (–5, 3) and (2, 3).
The slope 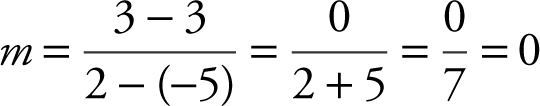 . This implies that the points (–5, 3) and (2, 3) are on a horizontal line parallel to the x -axis.
Example 3
Figure 5.1-1 is a summary of four different orientations of lines and their slopes:
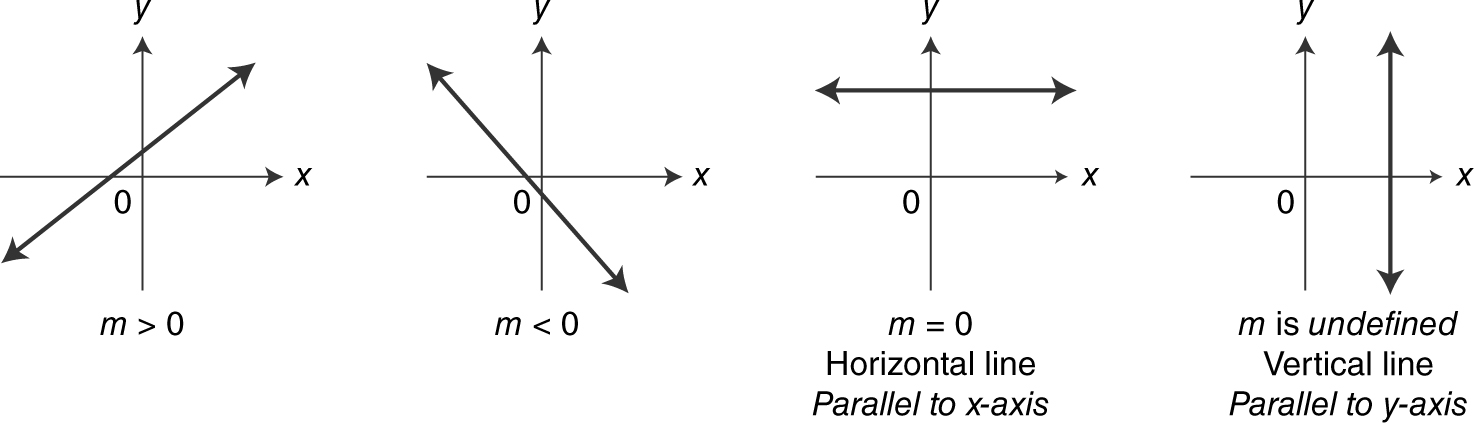
Figure 5.1-1
Equations of a Line
y = mx + b Slope-intercept form of a line where m is its slope and b is the y -intercept.
y – y∞ = m ⇐ x – x ∞ ⇒ Point-slope form of a line where m is the slope and (x 1 , y 1 ) is a point on the line.
Ax + By + C = ′ General form of a line where A , B , and C are constants and A and B are not both equal to 0.
Example 1
Write an equation of the line through the points (–2, 1) and (3, –9).
The slope of line passing through (–2, 1) and (3, –9) is 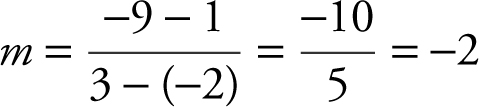 . Using the point-slope form and the point (–2, 1),
An equation of the line is y = –2x – 3.
Example 2
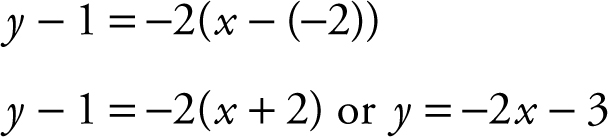
An equation of a line l is 2x + 3y = 12. Find the slope, the x -intercept, and the y -intercept of line l .
Begin by expressing the equation 2x + 3y = 12 in slope-intercept form .
Therefore, m , the slope of line l , is  and b , the y -intercept, is 4. To find the x -intercept, set y = 0 in the original equation 2x + 3y = 12. Thus, 2x + 0 = 12 and x = 6. The x -intercept of line l is 6.
Example 3
Equations of vertical and horizontal lines involve only a single variable. Figure 5.1-2 shows several examples:
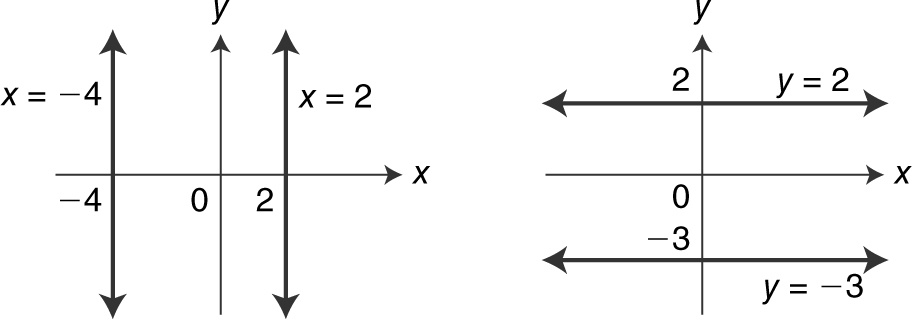
Figure 5.1-2
Parallel and Perpendicular Lines
Given two nonvertical lines l 1 and l 2 with slopes m 1 and m 2 , as shown in Figure 5.1-3 , respectively, they are parallel if and only if m 1 = m 2 .
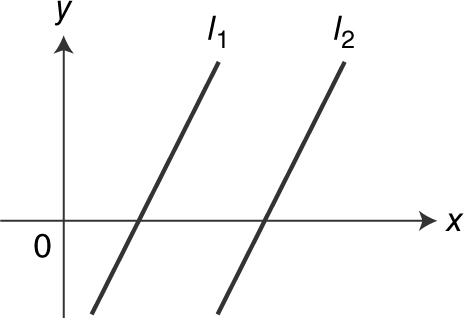
Figure 5.1-3
Lines l 1 and l 2 are perpendicular if and only if m 1 m 2 = –1. (See Figure 5.1-4 .)
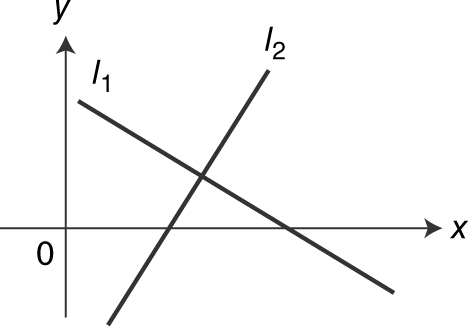
Figure 5.1-4
Example 1
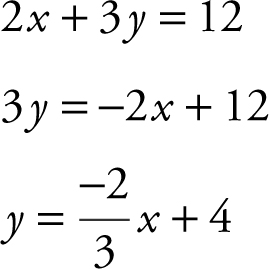
Write an equation of the line through the point (–1, 3) and parallel to the line 3x – 2y = 6. (See Figure 5.1-5 .)
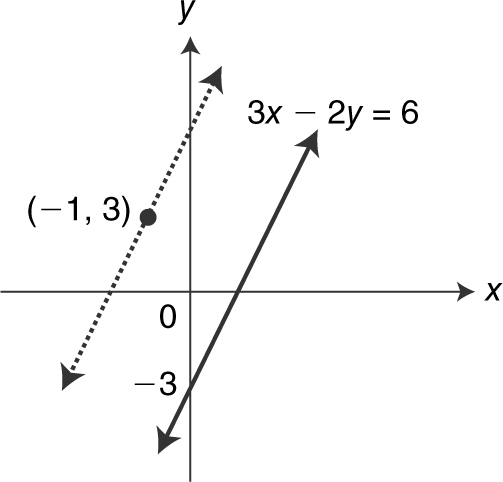
Figure 5.1-5
Begin by expressing 3x – 2y = 6 in slope-intercept form.
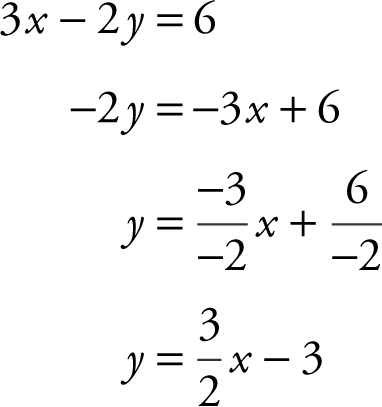
Therefore, the slope of the line 3x – 2y = 6 is 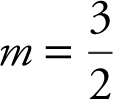 , and the slope of the line parallel to the line 3x – 2y = 6 is also
 ![]() . Since the line parallel to 3x – 2y = 6 passes through the point (–1, 3), you can use the point-slope form to obtain the equation
. Since the line parallel to 3x – 2y = 6 passes through the point (–1, 3), you can use the point-slope form to obtain the equation 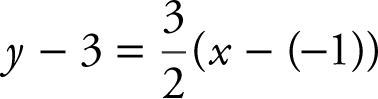 or
or 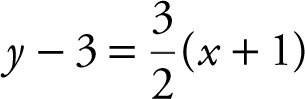 .
.
Example 2
Write an equation of the perpendicular bisector of the line segment joining the points A (3, 0) and B (–1, 4). (See Figure 5.1-6 .)
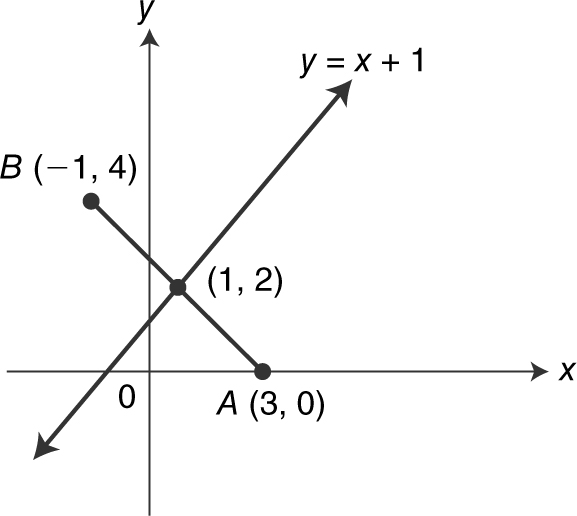
Figure 5.1-6
Begin by finding the midpoint of ![]() . Midpoint
. Midpoint 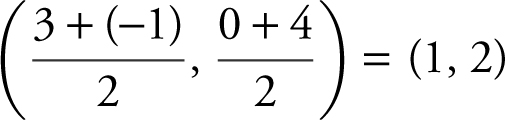 . The slope of
 ![]() is
is 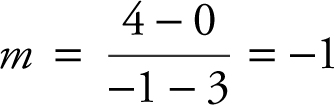 . Therefore, the perpendicular bisector of
 ![]() has a slope of 1. Since the perpendicular bisector of
has a slope of 1. Since the perpendicular bisector of ![]() passes through the midpoint, you could use the point-slope form to obtain y – 2 = 1(x – 1) or y – 2 = x – 1 or y = x + 1.
passes through the midpoint, you could use the point-slope form to obtain y – 2 = 1(x – 1) or y – 2 = x – 1 or y = x + 1.
Example 3
Write an equation of the circle with center at C (–2, 1) and tangent to line l having the equation x + y = 5. (See Figure 5.1-7 .)
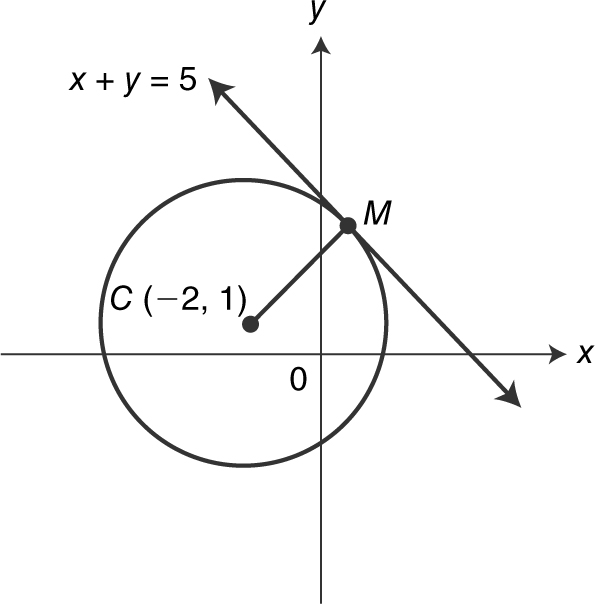
Figure 5.1-7
Let M be the point of tangency. Express the equation x + y = 5 in slope-intercept form to obtain y = –x + 5. Thus, the slope of line l is – 1. Since ![]() is a radius drawn to the point of tangency, it is perpendicular to line l , and the slope of
is a radius drawn to the point of tangency, it is perpendicular to line l , and the slope of ![]() is 1. Using the point-slope formula, the equation of
is 1. Using the point-slope formula, the equation of ![]() is y – 1 = 1(x – (–2)) or y = x + 3. To find the coordinates of point M , solve the two equations y = –x + 5 and y = x + 3 simultaneously. Thus, –x + 5 = x + 3 which is equivalent to 2 = 2x or x = 1.
is y – 1 = 1(x – (–2)) or y = x + 3. To find the coordinates of point M , solve the two equations y = –x + 5 and y = x + 3 simultaneously. Thus, –x + 5 = x + 3 which is equivalent to 2 = 2x or x = 1.
Substituting x = 1 into y = x + 3, you have y = 4. Therefore, the coordinates of M are (1, 4). Since ![]() is the radius of the circle, you should find the length of
is the radius of the circle, you should find the length of ![]() by using the distance formula
by using the distance formula  . Thus,
  . Now that you know both the radius of the circle
  and its center, (–2, 1), use the formula (x – h )2 + (y – k )2 = r 2 to find an equation of the circle. Thus, an equation of the circle is (x – (–2))2 + (y – 1)2 = 18 or (x + 2)2 + (y – 1)2 = 18.
5.2 Absolute Values and Inequalities
Main Concepts: Absolute Values, Inequalities and the Real Number Line, Solving Absolute Value Inequalities, Solving Polynomial Inequalities, and Solving Rational Inequalities
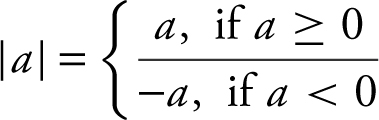
Absolute Values
Let a and b be real numbers.
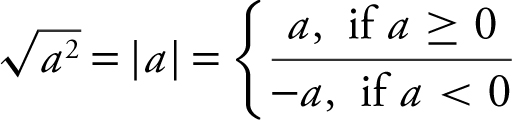
1. 
2. |ab | = |a ||b |
3. |a – b | = |b – a |
4. 
Example 1
Solve for x : |3x – 12| = 18.
Depending on whether the value of (3x – 12) is positive or negative, the equation |3x – 12| = 18 could be written as 3x – 12 = 18 or 3x – 12 = –18. Solving both equations, you have x = 10 and x = –2. (Be sure to check both answers in the original equation. ) The solution set for x is {–2, 10}.
Example 2
Solve for x : |2x – 12| = |4x + 24|.
The given equation implies that either 2x – 12 = 4x + 24 or 2x – 12 = –(4x + 24). Solving both equations, you have x = –18 and x = –2. Checking x = –18 with the original equation: |2(–18) – 12| = |4(–18) + 24| or |–36 – 12| = | – 72 + 24| or | – 48| = | – 48|. Checking x = –2 with the original equation, you have |– 16| = |16|. Thus, the solution set for x is {18, –2}.
Example 3
Solve for x : |11 – 3x | = 1 – x .
Depending on the value of (11 – 3x )—whether it is greater than or less than 0—the given equation could be written as 11 – 3x = 1 – x or 11 – 3x = –(1 – x ). Solving both equations, you have x = 5 and x = 3. Checking x = 5 with the original equation yields |11 – 3(5)| = 1 – 5 or | – 4| = –4, which is not possible. Checking x = 3 with the original equation shows that |11 – 3(3)| = 1 – 3 or | – 2| =–2 which is also not possible. Thus, the solution for x is the empty set { }. You could also solve the equation by using a graphing calculator.
Enter y 1 = |11 – 3x | and y 2 = 1 – x . The two graphs do not intersect, thus there is no common solution. (See Figure 5.2-1 .)
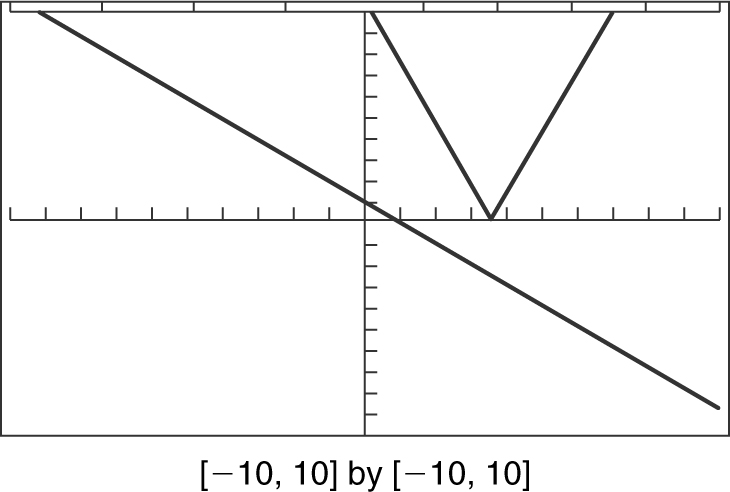
Figure 5.2-1
Inequalities and the Real Number Line
Properties of Inequalities
Let a , b , c , d , and k be real numbers:
1. If a < b and b < c , then a < c . For example, –7 < 2 and 2 < 5 ⇒ –7 < 5.
2. If a < b and c < d , then a + c < b + d . For example, 5 < 7 and 3 < 6 ⇒ 5 + 3 < 7 + 6.
3. If a < b and k > 0, then ak < bk . For example, 3 < 5 and 2 > 0 ⇒ 3(2) < 5(2).
4. If a < b and k < 0, then ak > bk . For example, 3 < 5 and –2 < 0 ⇒ 3(–2) > 5(–2).
Example 1
Solve the inequality 6 – 2x ≤ 18 and sketch the solution on the real number line.
Solving the inequality 6 – 2x ≤ 18 gives

Therefore, the solution set is the interval [–6, ∞) or, by expressing the solution set in set notation, {x |x ≥ –6}.
Example 2
Solve the double inequality –15 ≤ 3x + 6 < 9 and sketch the solution on the real number line.
Solving the double inequality –15 ≤ 3x + 6 < 9 gives

Therefore, the solution set is the interval [–7, 1) or, by expressing the solution in set notation: {x | – 7 ≤ x < 1}.
Example 3
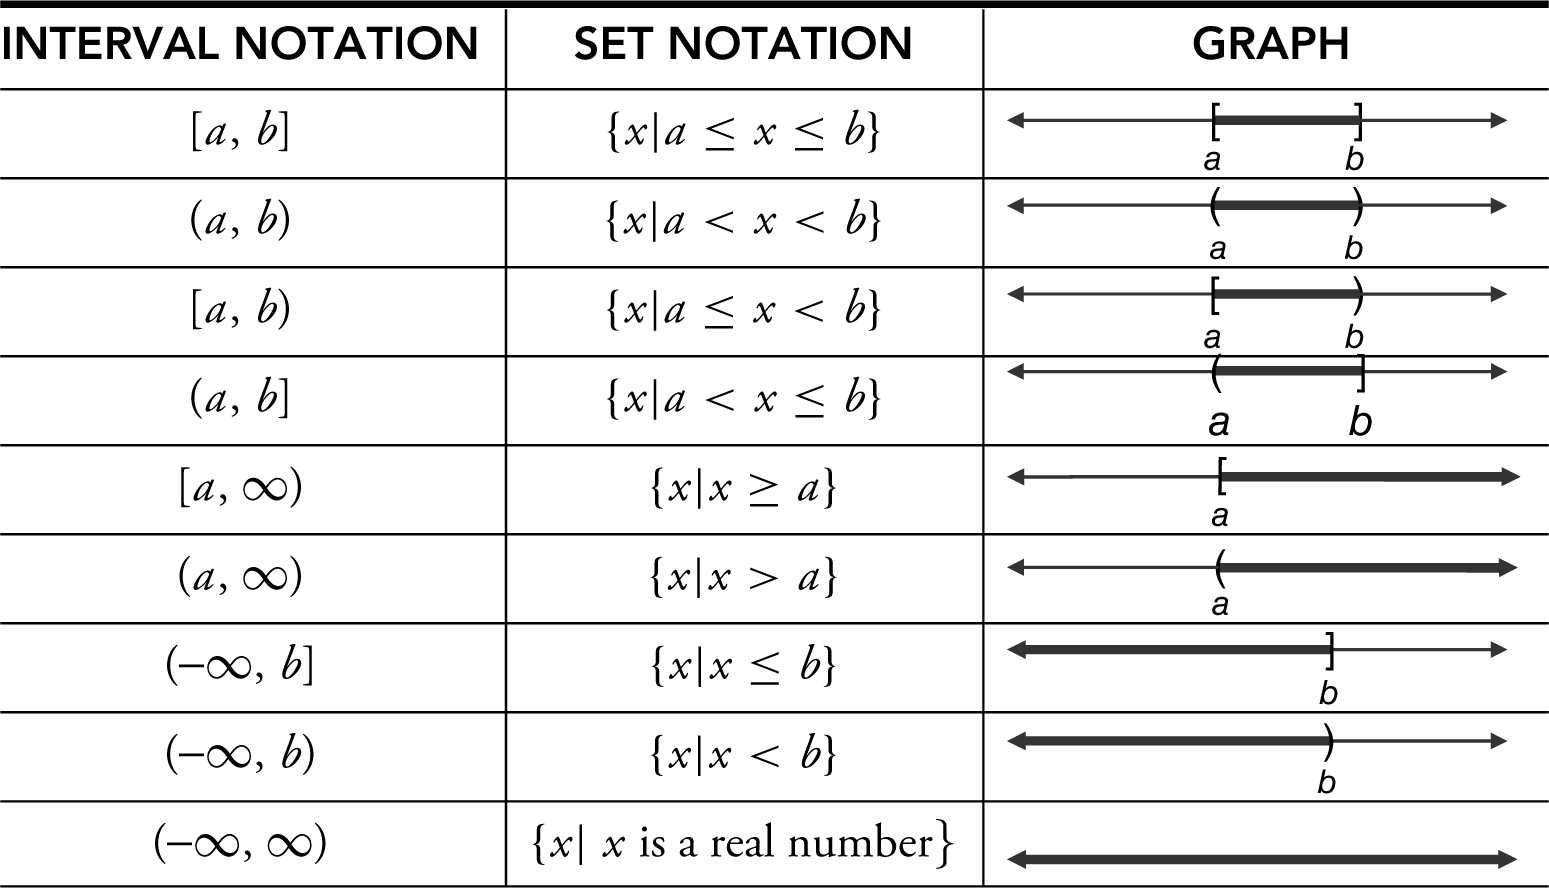
Here is a summary of the different types of intervals on a number line:
Solving Absolute Value Inequalities
Let a be a real number such that a ≥ 0.
|x | ≥ a ⇔ (x ≥ a or x ≤ – a ) and | x | > a ⇔ (x > a or x < a )
|x ≤ a ⇔ ( – a ≤ x ≤ a ) and | x | < a ⇔ ( – a < x < a )
Example 1
Solve the inequality |3x – 6| ≤ 15 and sketch the solution on the real number line.
The given inequality is equivalent to
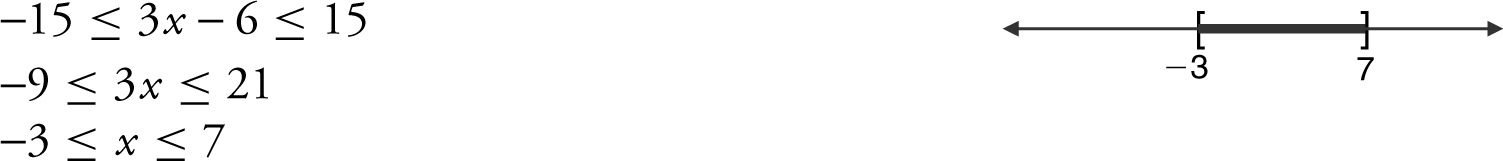
Therefore, the solution set is the interval [–3, 7] or, in set notation, {x | – 3 ≤ x ≤ 7}.
Example 2
Solve the inequality |2x + 1| > 9 and sketch the solution on the real number line.
The inequality |2x + 1| > 9 implies that

Solving the two inequalities in the above line, you have x > 4 or x < –5. Therefore, the solution set is the union of the two disjoint intervals (x > 4) ∪ (x < –5) or, by writing the solution in set notation, {x |(x > 4) or (x < –5)}.
Example 3
Solve the inequality |1 – 2x | ≤ 7 and sketch the solution on the real number line.
The inequality |1 – 2x | ≤ 7 implies that
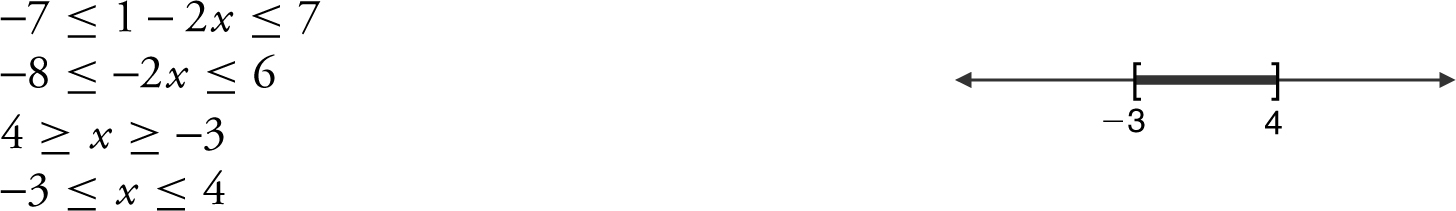
Therefore, the solution set is the interval [–3, 4] or, by writing the solution in set notation, {x | – 3 ≤ x ≤ 4}. (See Figure 5.2-2 .)
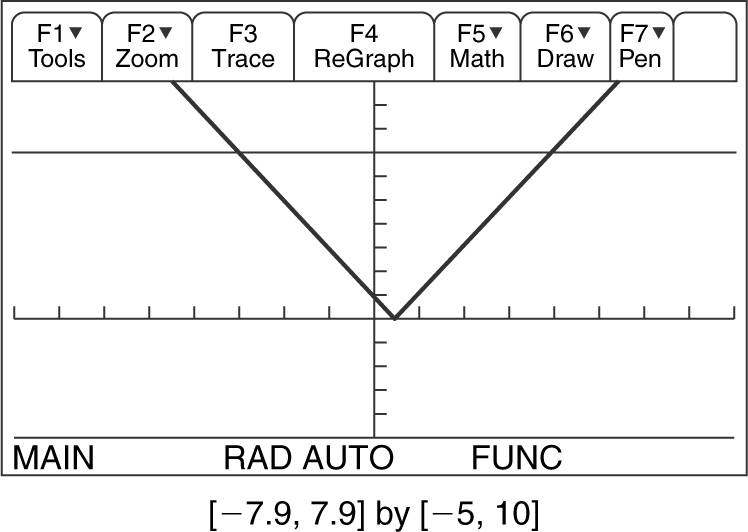
Figure 5.2-2
Note : You can solve an absolute value inequality by using a graphing calculator. For instance, in Example 3, enter y 1 = |1 – 2x | and y 2 = 7. The graphs intersect at x = –3 and 4, and y 1 is below y 2 on the interval (–3, 4). Since the inequality is ≤, the solution set is [–3, 4].
Solving Polynomial Inequalities
1. Write the given inequality in standard form with the polynomial on the left and zero on the right.
2. Factor the polynomial, if possible.
3. Find all zeros of the polynomials.
4. Using the zeros on a number line, determine the test intervals.
5. Select an x -value from each interval and substitute it in the polynomial.
6. Check the endpoints of each interval with the inequality.
7. Write the solution to the inequality.
Example 1
Solve the inequality x 2 – 3x ≥ 4.
1. Write in standard form: x 2 – 3x – 4 ≥ 0
2. Factor the polynomial: (x – 4)(x + 1)
3. Find zeros: (x – 4)(x + 1) = 0 implies that x = 4 and x = –1.
4. Determine intervals:

5. Select an x -value in each interval and evaluate the polynomial at that value:
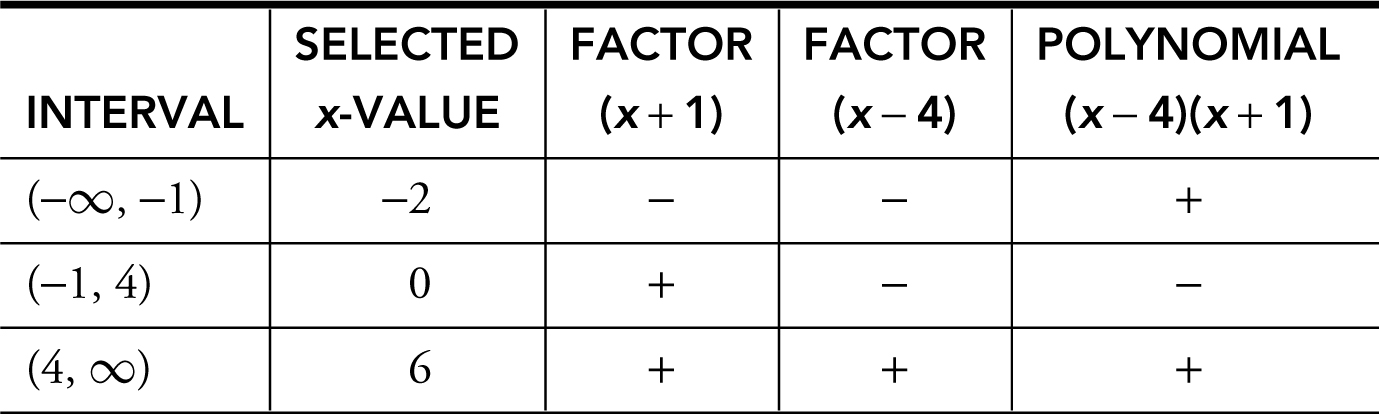
Therefore the intervals (–∞, –1) and (4, ∞) make (x – 4)(x + 1) > 0.
6. Check endpoints: Since the inequality x 2 – 3x – 4 ≥ 0 is greater than or equal to 0, both endpoints x = –1 and x = 4 are included in the solution.
7. Write the solution: The solution is (–∞, –1] ∪ [4, ∞). (See Figure 5.2-3 .)
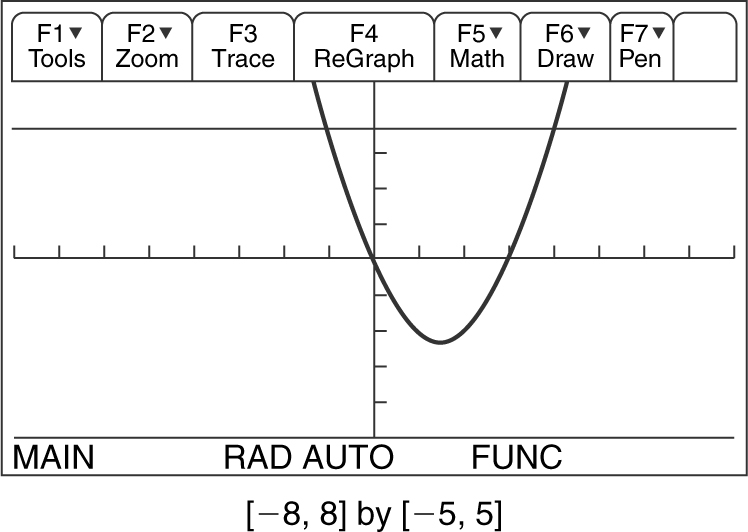
Figure 5.2-3
Note : The inequality x 2 – 3x ≥ 4 could have been solved by using a graphing calculator. Enter y 1 = x 2 – 3x and y 2 = 4. The graph of y 1 is above y 2 on (–∞, –1) and (4, ∞). Since the inequality is ≥, the solution set is (–∞, –1] and [4, ∞).
Example 2
Solve the inequality x 3 – 9x < 0, using a graphing calculator. (See Figure 5.2-4 .)
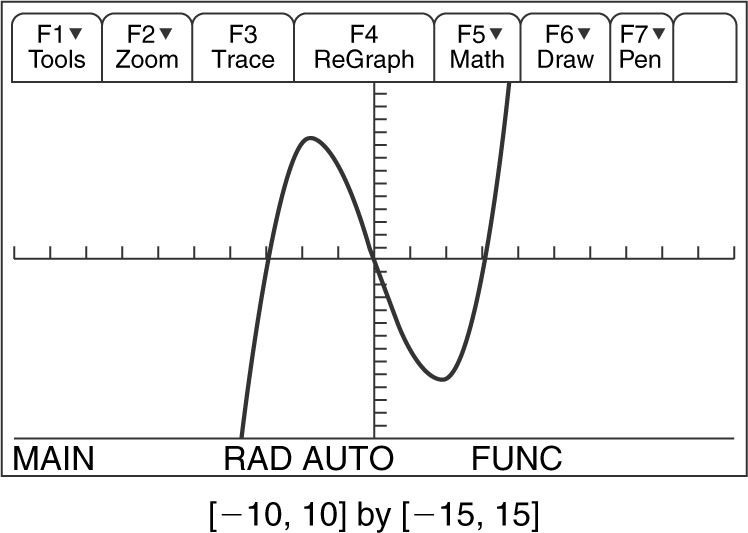
Figure 5.2-4
1. Enter y = x 3 – 8x into your graphing calculator.
2. Find the zeros of y : x = –3, 0, and 3.
3. Determine the intervals on which y < 0: (–∞, –3) and (0, 3).
4. Check whether the endpoints satisfy the inequality. Since the inequality is strictly less than 0, the endpoints are not included in the solution.
5. Write the solution to the inequality. The solution is (–∞, –3) ∪ (0, 3).
Example 3
Solve the inequality x 3 – 9x < 0 algebraically.
1. Write in standard form: x 3 – 9x < 0 is already in standard form.
2. Factor the polynomial: x (x – 3)(x + 3)
3. Find zeros: x (x – 3)(x + 3) = 0 implies that x = 0, x = 3, and x = –3.
4. Determine the intervals:

5. Select an x -value and evaluate the polynomial:
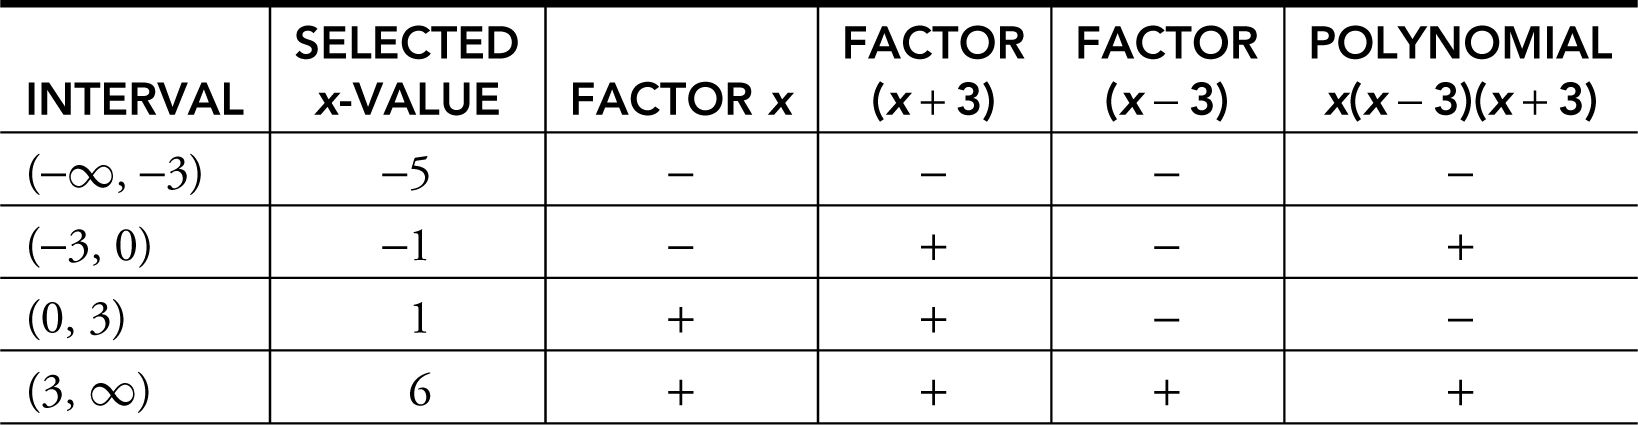
Therefore, the intervals (–∞, –3) and (0, 3) make x (x – 3)(x + 3) < 0.
6. Check the endpoints: Since the inequality x 3 – 9x < 0 is strictly less than 0, none of the endpoints x = –3, 0, and 3 are included in the solution.
7. Write the solution: The solution is (–∞, –3) ∪ (0, 3).
Solving Rational Inequalities
1. Rewrite the given inequality so that all the terms are on the left and only zero is on the right.
2. Find the least common denominator, and combine all the terms on the left into a single fraction .
3. Factor the numerator and the denominator, if possible.
4. Find all x -values for which the numerator or the denominator is zero.
5. Putting these x -values on a number line, determine the test intervals.
6. Select an x -value from each interval and substitute it in the fraction.
7. Check the endpoints of each interval with the inequality.
8. Write the solution to the inequality.
Example 1
Solve the inequality 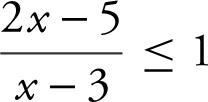 .
.
1. Rewrite: 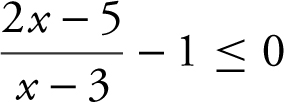
2. Combine: 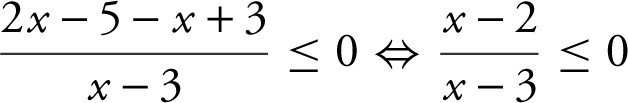
3. Set the numerator and denominator equal to 0 and solve for x : x = 2 and 3.
4. Determine intervals:

5. Select an x -value and evaluate the fraction:
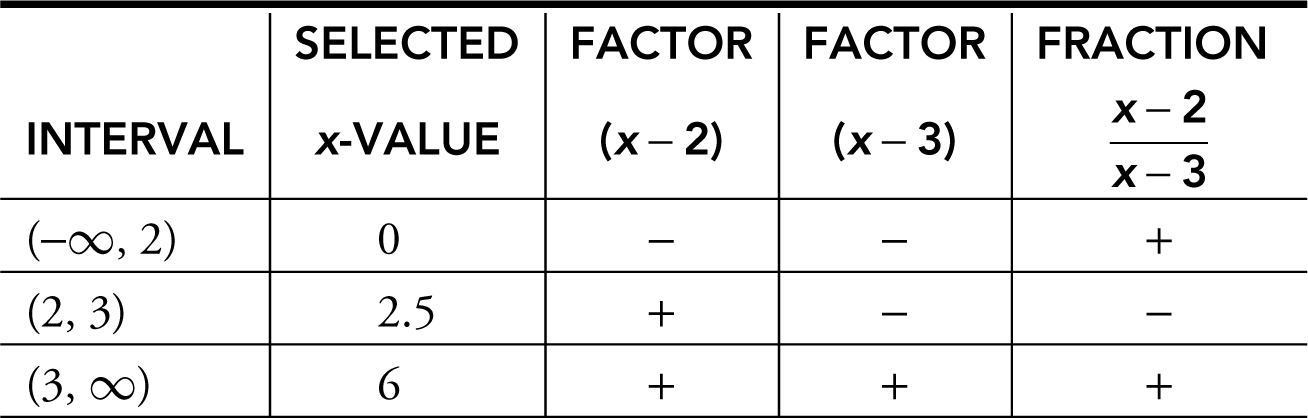
Therefore, the interval (2, 3) makes the fraction < 0.
6. Check the endpoints: At x = 3, the fraction is undefined. Thus the only endpoint is x = 2. Since the inequality is less than or equal to 0, x = 2 is included in the solution.
7. Write the solution: The solution is the interval [2, 3).
Example 2
Solve the inequality 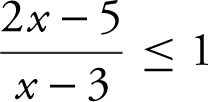 by using a graphing calculator. (See Figure 5.2-5 .)
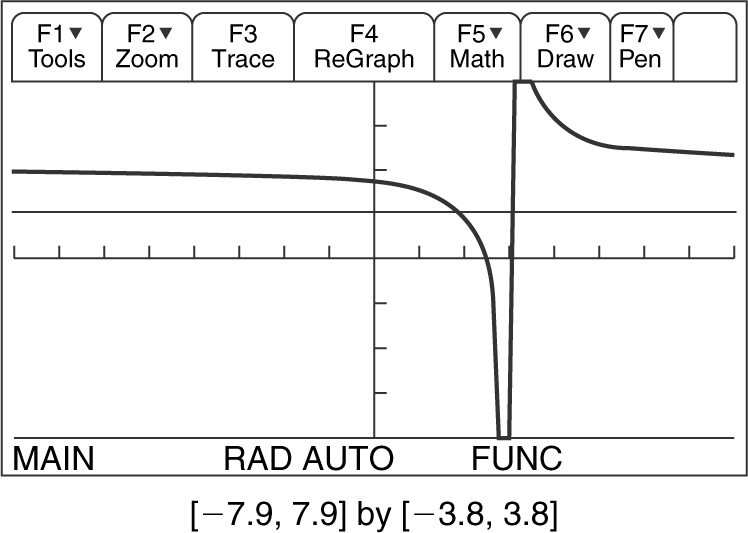
Figure 5.2-5
1. Enter  and y 2 = 1.
2. Find the intersection points: x = 2. (Note that at x = 3, y 1 is undefined.)
3. Determine the intervals on which y 1 is below y 2 : The interval is (2, 3).
4. Check whether the endpoints satisfy the inequality. Since the inequality is less than or equal to 1, the endpoint at x = 2 is included in the solution.
5. Write the solution to the inequality. The solution is the interval [2, 3).
Example 3
Solve the inequality  by using a graphing calculator. (See Figure 5.2-6 .)
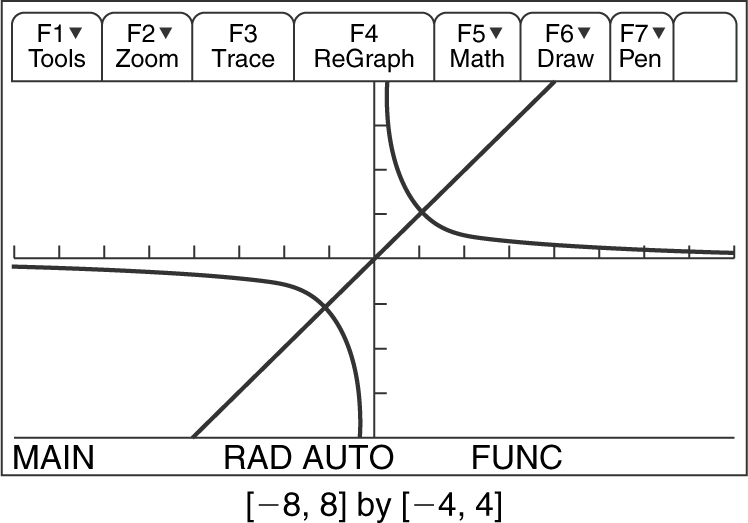
Figure 5.2-6
1. Enter  and y 2 = x .
2. Find the intersection points: x = –1 and x = 1. (Note that at x = 0, y 1 is undefined.)
3. Determine the intervals on which y 1 ≥ y 2 . The intervals are (–∞, –1) and (0, 1).
4. Check whether the endpoints satisfy the inequality: Since the inequality is greater than or equal to x , the endpoints at x = –1 and x = 1 are included in the solution.
5. Write the solution to the inequality. The solution is the interval (–∞, –1] ∪ (0, 1].
5.3 Functions
Main Concepts: Definition of a Function, Operations on Functions, Inverse Functions, Trigonometric and Inverse Trigonometric Functions, Exponential and Logarithmic Functions
Definition of a Function
A function f is a set of ordered pairs (x , y ) in which for every x coordinate there is one and only one corresponding y coordinate. We write f (x ) = y . The domain of f is the set of all possible values of x , and the range of f is the set of all values of y .
The Vertical Line Test
If all vertical lines pass through the graph of an equation at no more than one point, then the equation is a function.
Example 1
Given 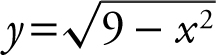 , sketch the graph of the equation, determine if the equation is a function, and find the domain and range of the equation. (See Figure 5.3-1 .)
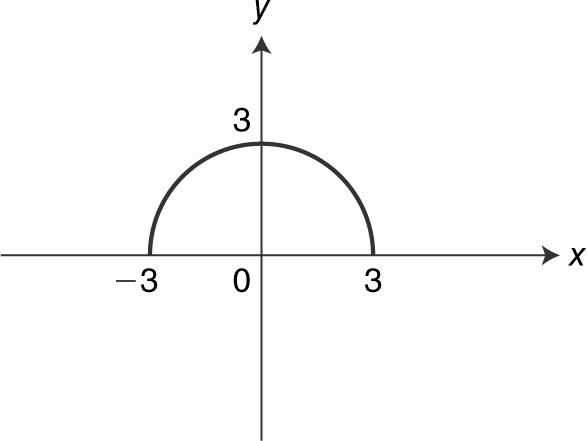
Figure 5.3-1
Since the graph of  passes the vertical line test, the equation is a function. Let y = f (x ). The expression
 ![]() implies that 9 – x 2 ≥ 0. By inspection, note that –3 ≤ x ≤ 3. Thus the domain is [–3, 3]. Since f (x ) is defined for all values of x ∈ [–3, 3] and f (–3) = 0 is the minimum value and f (0) = 3 is the maximum value, the range of f (x ) is [0, 3].
implies that 9 – x 2 ≥ 0. By inspection, note that –3 ≤ x ≤ 3. Thus the domain is [–3, 3]. Since f (x ) is defined for all values of x ∈ [–3, 3] and f (–3) = 0 is the minimum value and f (0) = 3 is the maximum value, the range of f (x ) is [0, 3].
Example 2
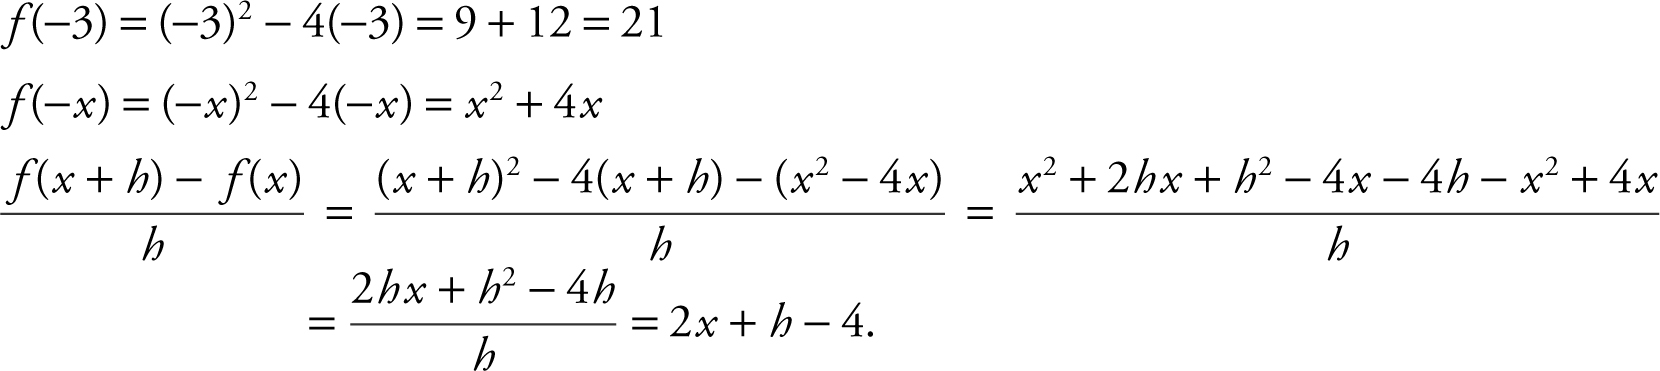
Given f (x ) = x 2 – 4x , find f (–3), f (–x ), and  .
.
Operations on Functions
Let f and g be two given functions. Then for all x in the intersection of the domains of f and g , the sum , difference , product , and quotient of f and g , respectively, are defined as follows:
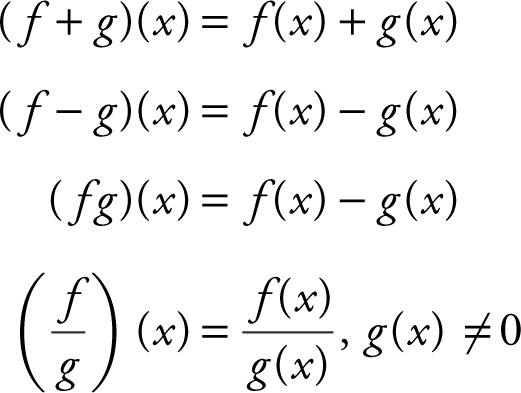
The composition of f with g is (f ∘ g )(x ) = f (g (x )), where the domain of f ∘ g is the set containing all x in the domain of g for which g (x ) is in the domain of f .
Example 1
Given f (x ) = x 2 – 4 and g (x ) = x – 5, find
(a) (f ∘ g )(–1)
(b) (g ∘ f )(–1)
(c) (f + g )(–3)
(d) (f – g )(1)
(e) (fg )(2)
(f) 
(g) 
(h) 
(a) (f ∘ g )(x ) = f (g (x )) = f (x – 5) = (x – 5)2 – 4 = x 2 – 10x + 21.
Thus (f ∘ g )(–1) = (–1)2 – 10(–1) + 21 = 1 + 10 + 21 = 32.
Or (f ∘ g )(–1) = f (g (–1)) = f (–6) = 32.
(b) (g ∘ f )(x ) = g (f (x )) = g (x 2 – 4) = (x 2 – 4) – 5 = x 2 – 9.
Thus (g ∘ f )(–1) = (–1)2 – 9 = 1 – 9 = –8.
(c) (f + g )(x ) = (x 2 – 4) + (x – 5) = x 2 + x – 9. Thus (f + g )(–3) = –3.
(d) (f – g )(x ) = (x 2 – 4) – (x – 5) = x 2 – x + 1. Thus (f – g )(1) = 1.
(e) (fg )(x ) = (x 2 – 4)(x – 5) = x 3 – 5x 2 – 4x + 20. Thus (fg )(2) = 0.
(f) 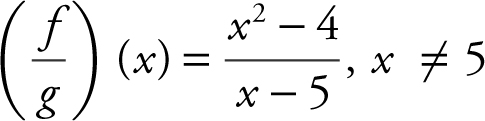 . Thus
 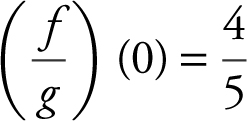 .
.
(g) Since g (5) = 0, x = 5 is not in the domain of  and is undefined .
(h) 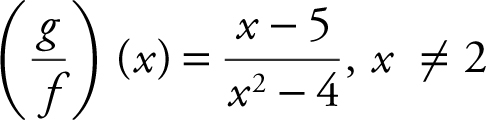 or –2. Thus
  .
.
Example 2
Given ![]() and
and 
(a) find  and indicate its domain and
(b) find  and indicate its domain.
(a) 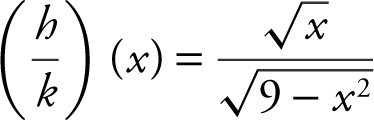
The domain of h (x ) is [0, ∞), and the domain of k (x ) is [–3, 3].
The intersection of the two domains is [0, 3]. However, k (3) = 0.
Therefore the domain of  is [0, 3).
Note that  is not equivalent to
  outside of the domain [0, 3).
(b) 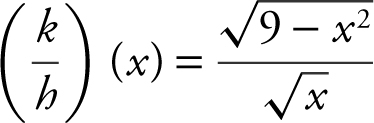
The intersection of the two domains is [0, 3]. However, h (0) = 0.
Therefore the domain of  is (0, 3].
Example 3
Given the graphs of functions f (x ) and g (x ) in Figures 5.3-2 and 5.3-3 ,
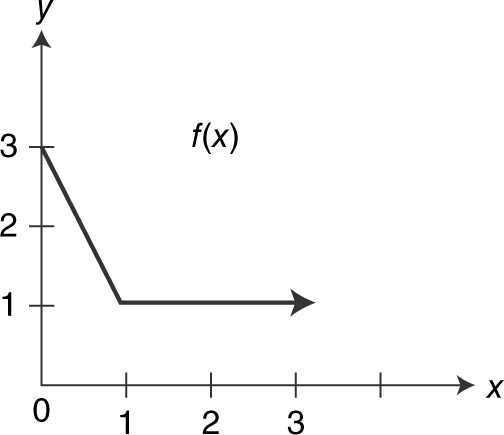
Figure 5.3-2
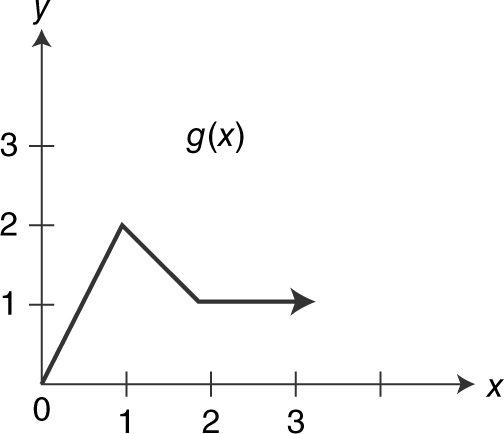
Figure 5.3-3
find:
(a) (f + g )(1)
(b) (fg )(0)
(c) 
(d) f (g (3))
(a) (f + g )(1) = f (1) + g (1) = 3
(b) (fg )(0) = f (0)g (0) = 3(0) = 0
(c) 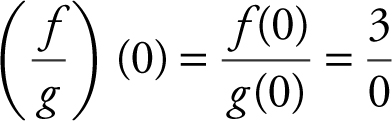 undefined
(d) f (g (3)) = f (1) = 1
Inverse Functions
Given a function f , the inverse of f (if it exists) is a function g such that f (g (x )) = x for every x in the domain of g and g (f (x )) = x for every x in the domain of f . The function g is written as f –1 . Thus, f (f –1 (x )) = x and f –1 (f (x )) = x . The graphs of f and f –1 in Figure 5.3-4 are reflections of each other in the line y = x . The point (a , b ) is on the graph of f if and only if the point (b , a ) is on the graph of f –1 .
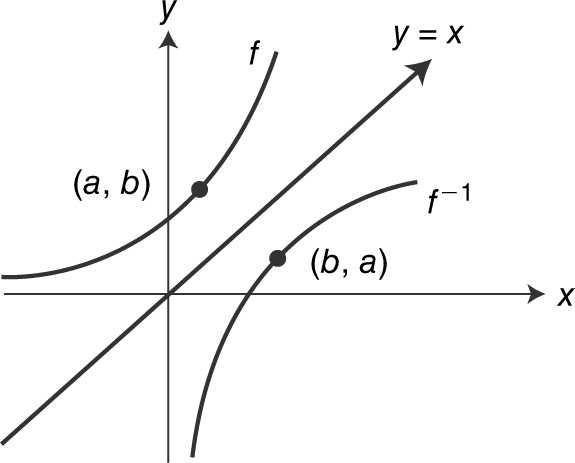
Figure 5.3-4
A function f is one-to-one if for any two points x 1 and x 2 in the domain such that x 1 ≠ x 2 , then f (x 1 ) ≠ f (x 2 ).
Equivalent Statements
Given a function f :
1. The function f has an inverse.
2. The function f is one-to-one.
3. Every horizontal line passes through the graph of f no more than once.
4. The function f is monotonic—strictly increasing or decreasing.
To find the inverse of a function f :
1. Check if f has an inverse, that is, if f is one-to-one or passes the horizontal line test.
2. Replace f (x ) by y .
3. Interchange the variables x and y .
4. Solve for y .
5. Replace y by f –1 (x ).
6. Indicate the domain of f –1 (x ) as the range of f (x ).
7. Verify f –1 (x ) by checking if f (f –1 (x )) = f –1 (f (x )) = x .
Example 1
Given the graph of f (x ) in Figure 5.3-5 , find:
(a) f –1 (0)
(b) f –1 (1)
(c) f –1 (3)
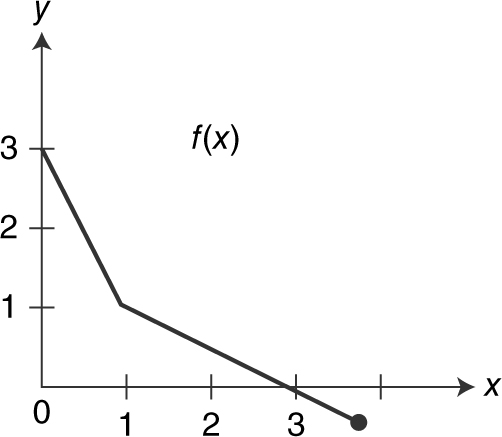
Figure 5.3-5
(a) By inspection, f (3) = 0. Thus, f –1 (0) = 3.
(b) Since f (1) = 1, thus, f –1 (1) = 1.
(c) Since f (0) = 3, therefore f –1 (3) = 0.
Example 2
Determine if the given functions have an inverse:
(a) f (x ) = x 3 + x – 2
(b) f (x ) = x 3 – 2x + 1
(a) By inspection, the graph of f (x ) = x 3 + x – 2 in Figure 5.3-6 is strictly increasing, which implies that f (x ) is one-to-one. (You could also use the horizontal line test.) Therefore, f (x ) has an inverse function.
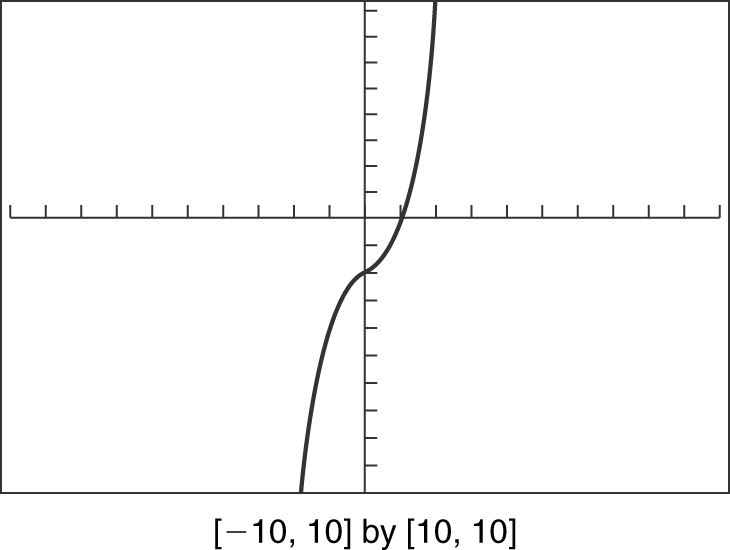
Figure 5.3-6
(b) By inspection, the graph of f (x ) = x 3 – 2x + 1 in Figure 5.3-7 fails the horizontal line test. Thus, f (x ) has no inverse function.
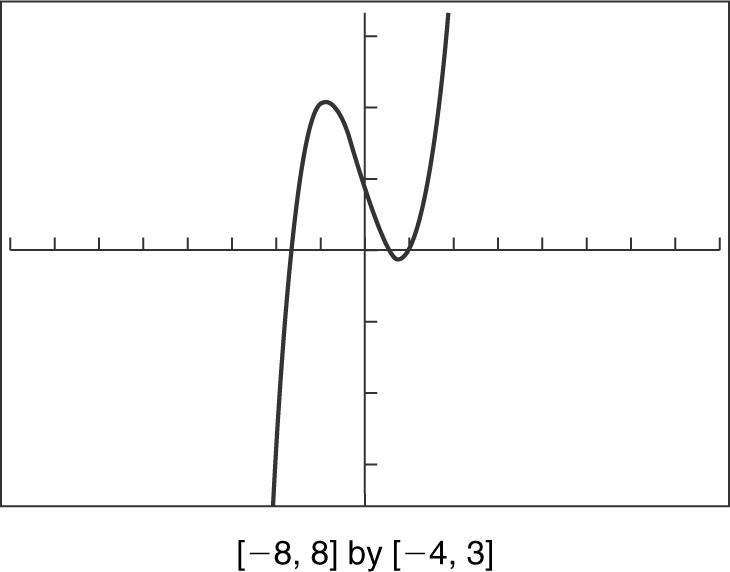
Figure 5.3-7
Example 3
Find the inverse function of 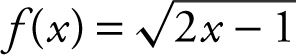 . (See Figure 5.3-8 .)
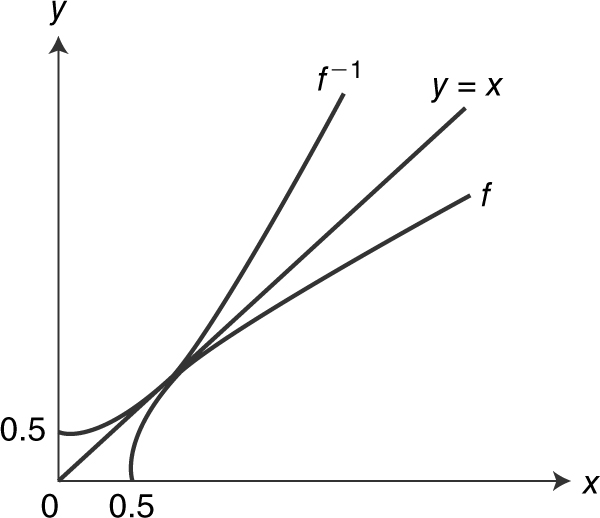
Figure 5.3-8
1. Since f (x ) is a strictly increasing function, the inverse function exists.
2. Let y = f (x ). Thus,  .
.
3. Interchange x and y . You have  .
.
4. Solve for y . Thus,  .
.
5. Replace y by f –1 (x ). You have  .
.
6. Since the range of f (x ) is [0, ∞), the domain of f –1 (x ) is [0, ∞).
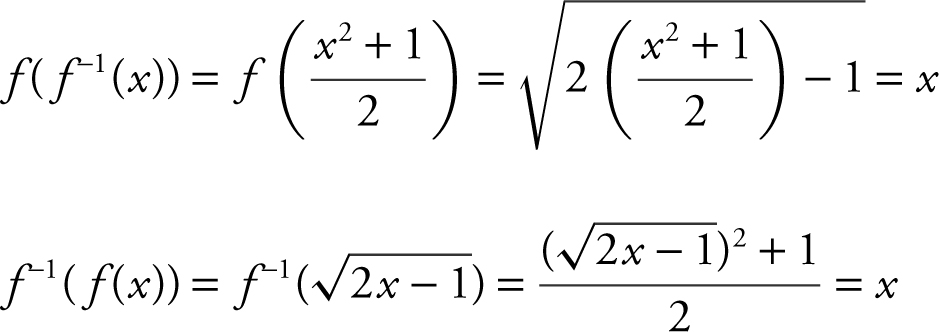
7. Verify f –1 (x ) by checking:
Since x > 0, ![]() ,
,
Trigonometric and Inverse Trigonometric Functions
There are six basic trigonometric functions and six inverse trigonometric functions. Their graphs are illustrated in Figures 5.3-9 to 5.3-20 .
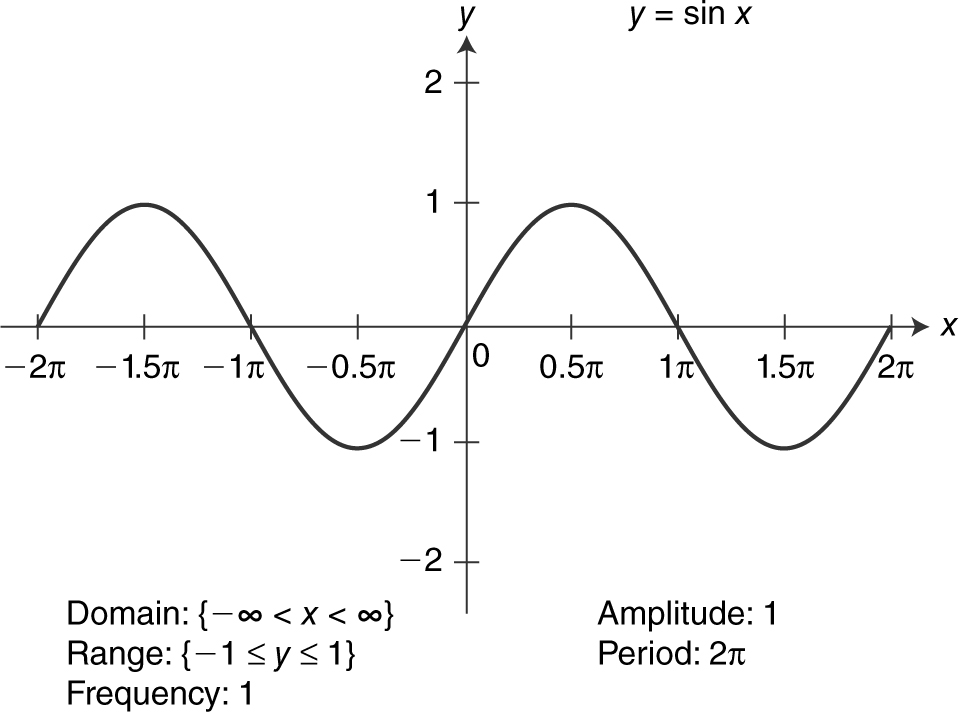
Figure 5.3-9
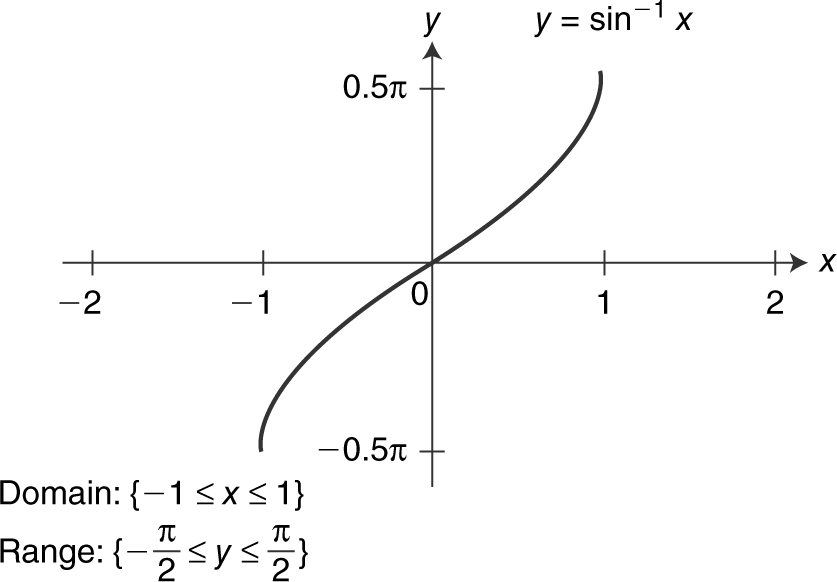
Figure 5.3-10
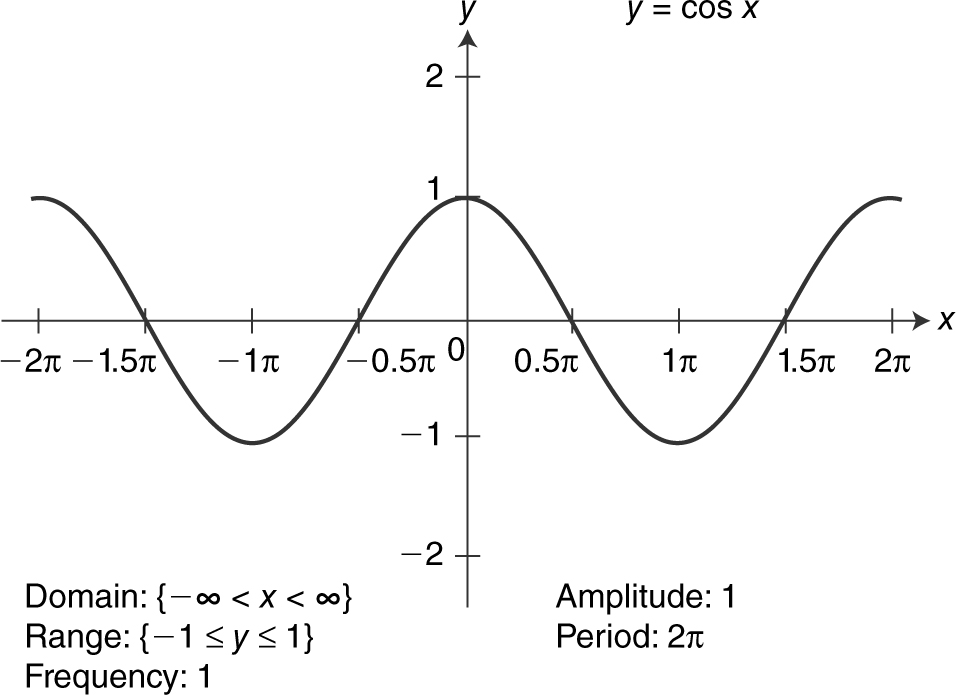
Figure 5.3-11
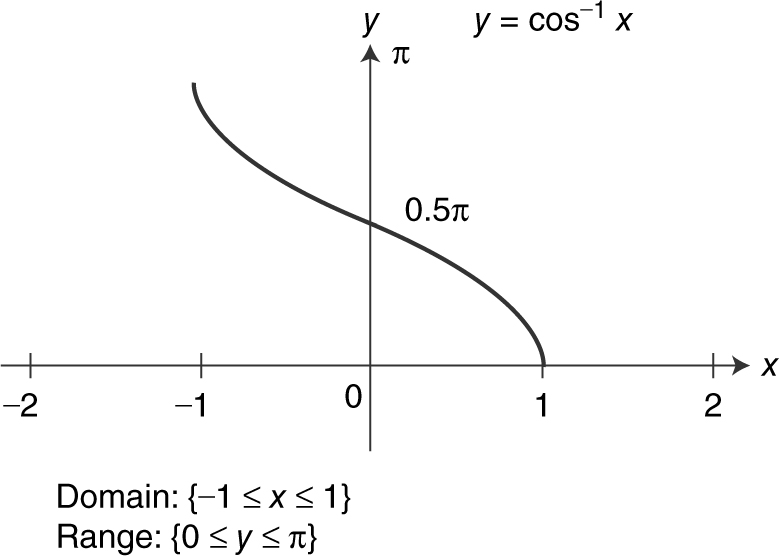
Figure 5.3-12
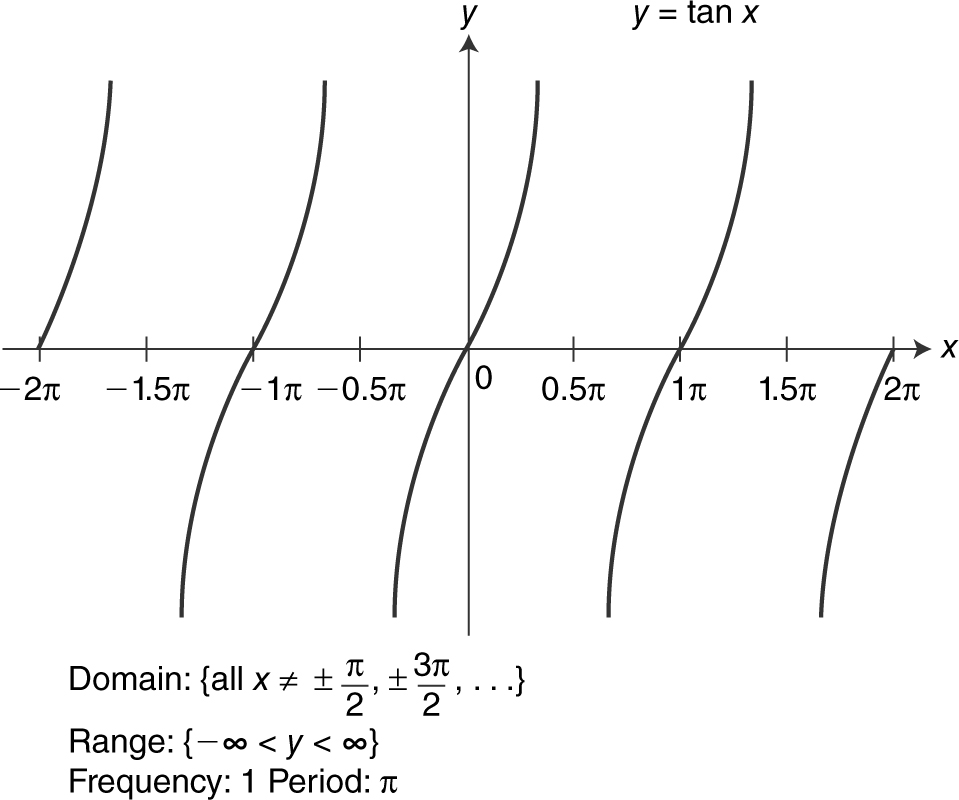
Figure 5.3-13
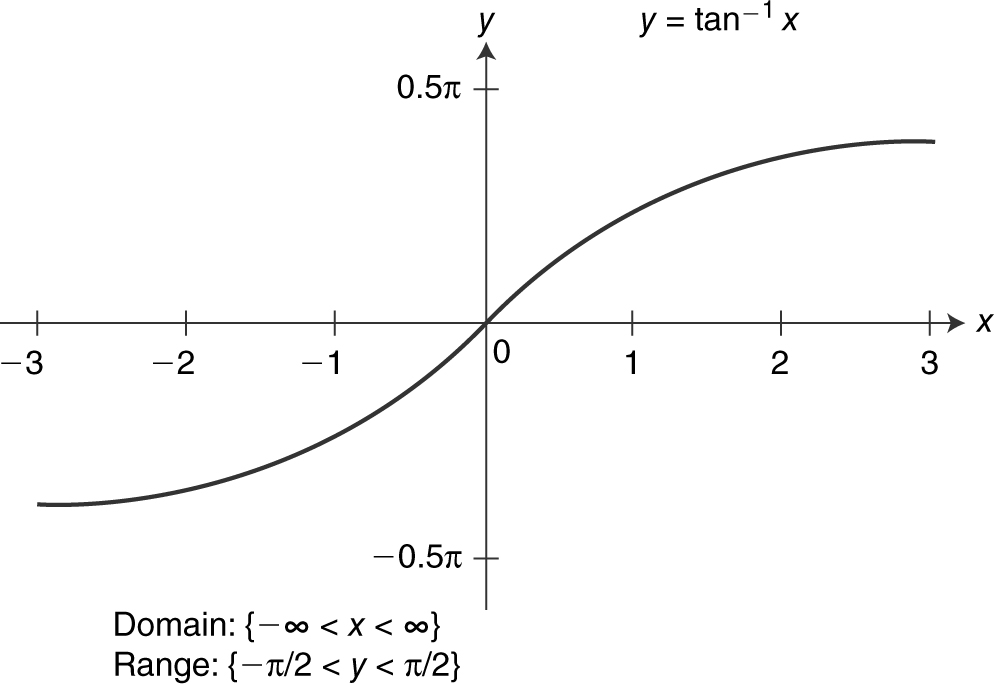
Figure 5.3-14
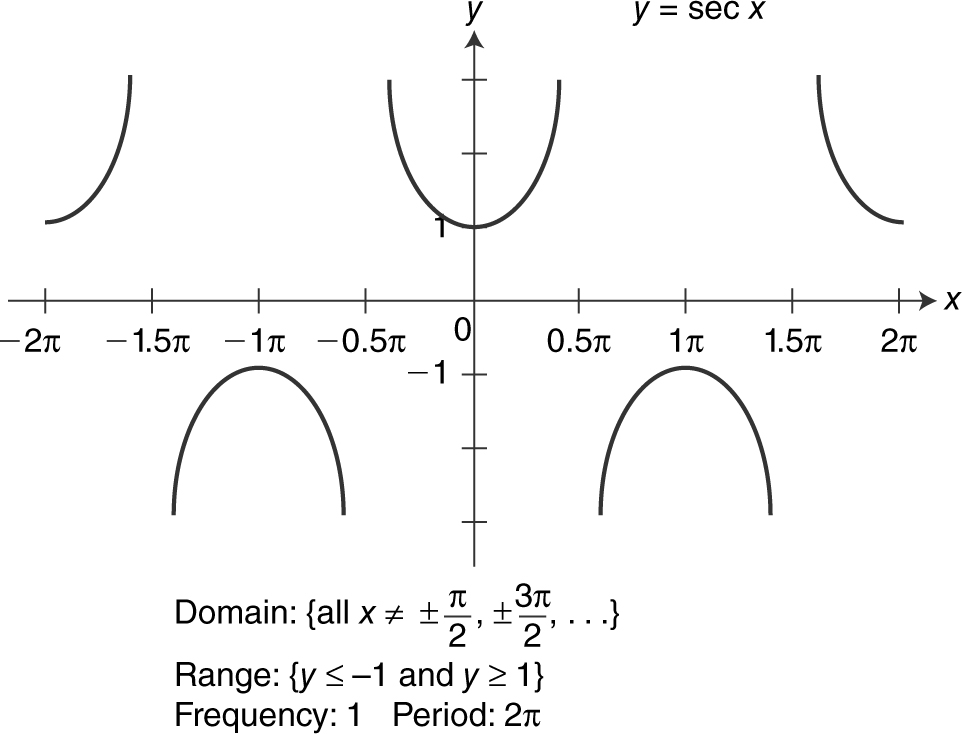
Figure 5.3-15
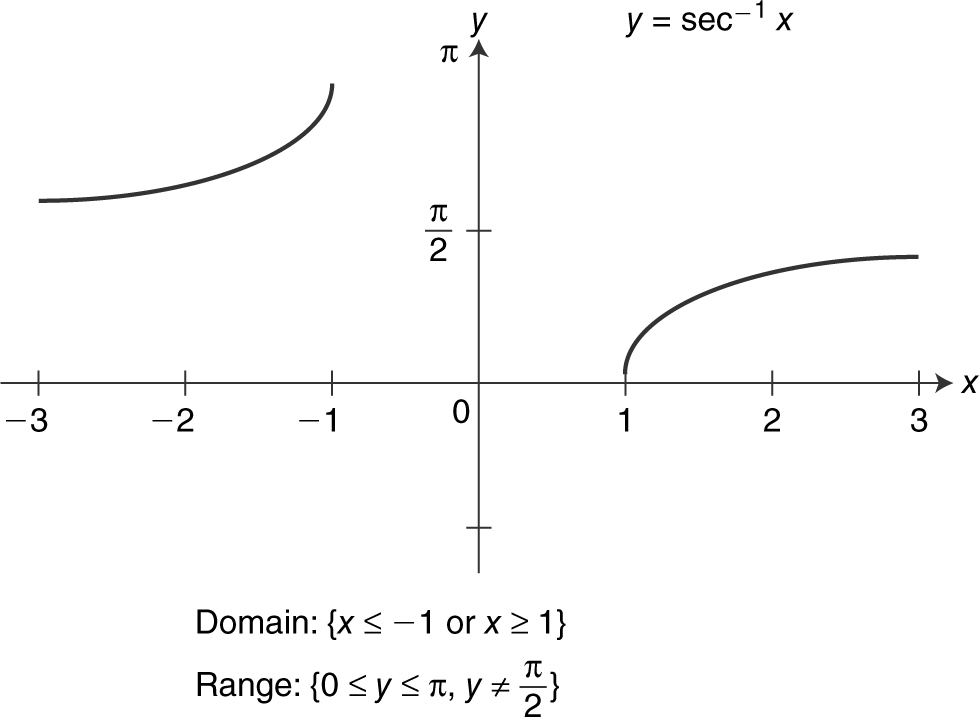
Figure 5.3-16
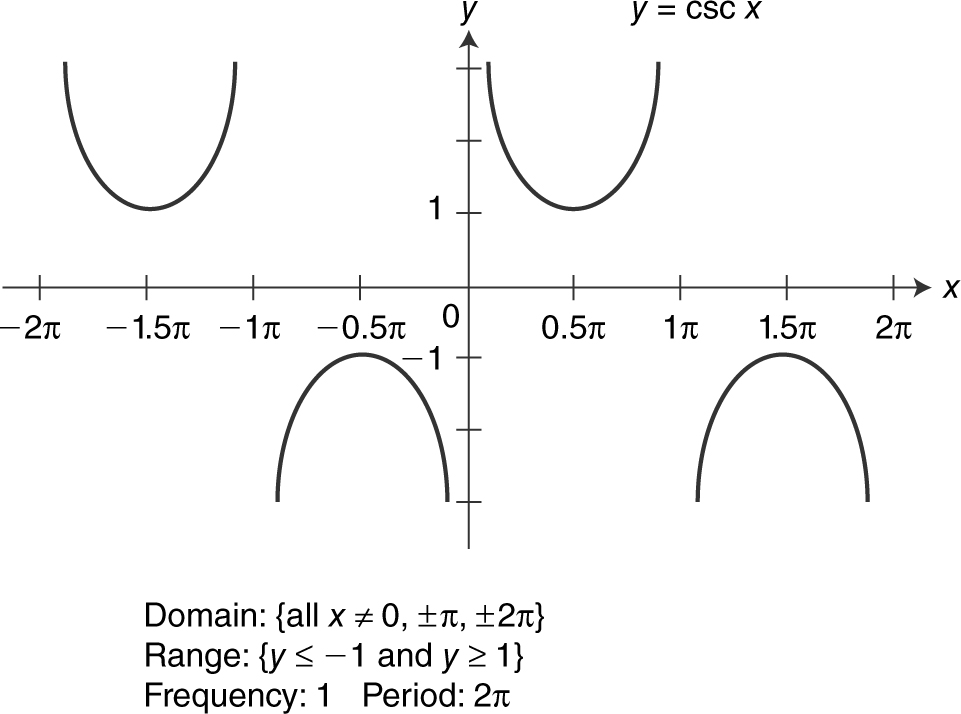
Figure 5.3-17
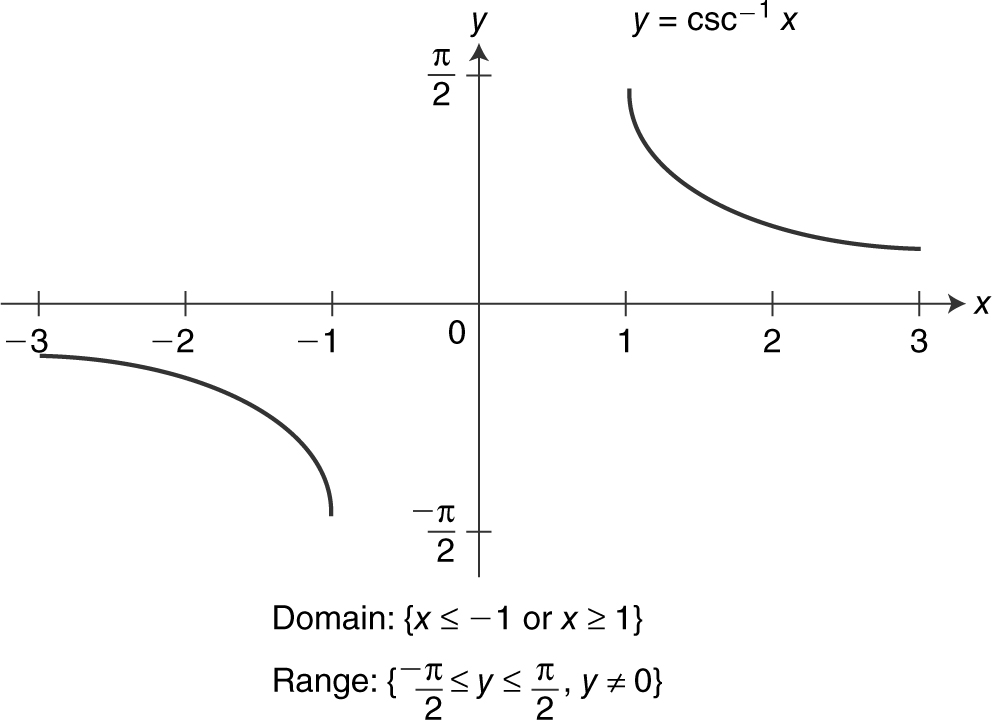
Figure 5.3-18
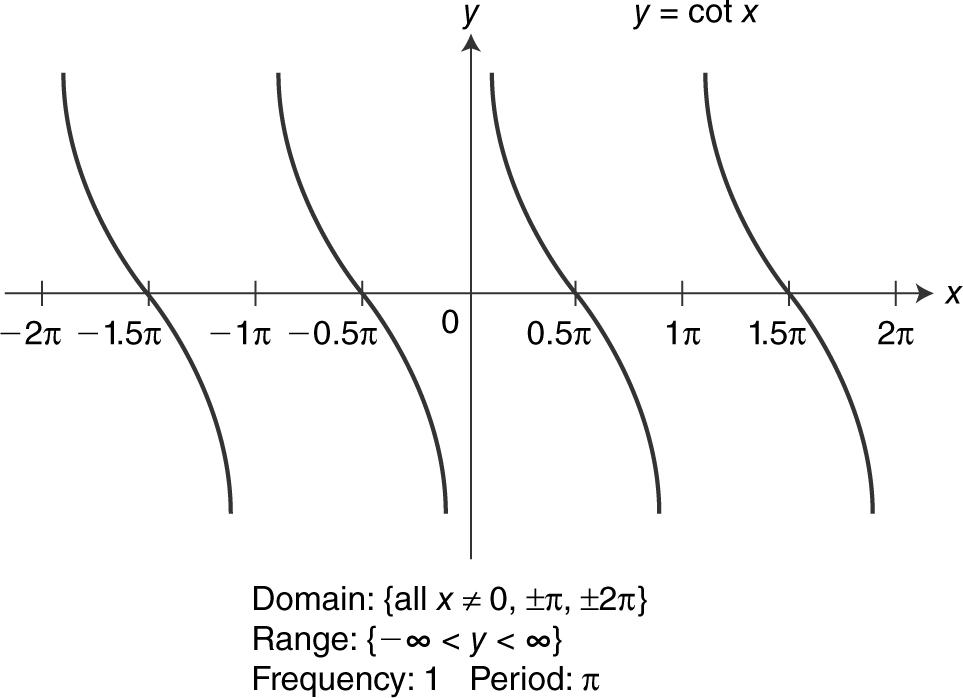
Figure 5.3-19
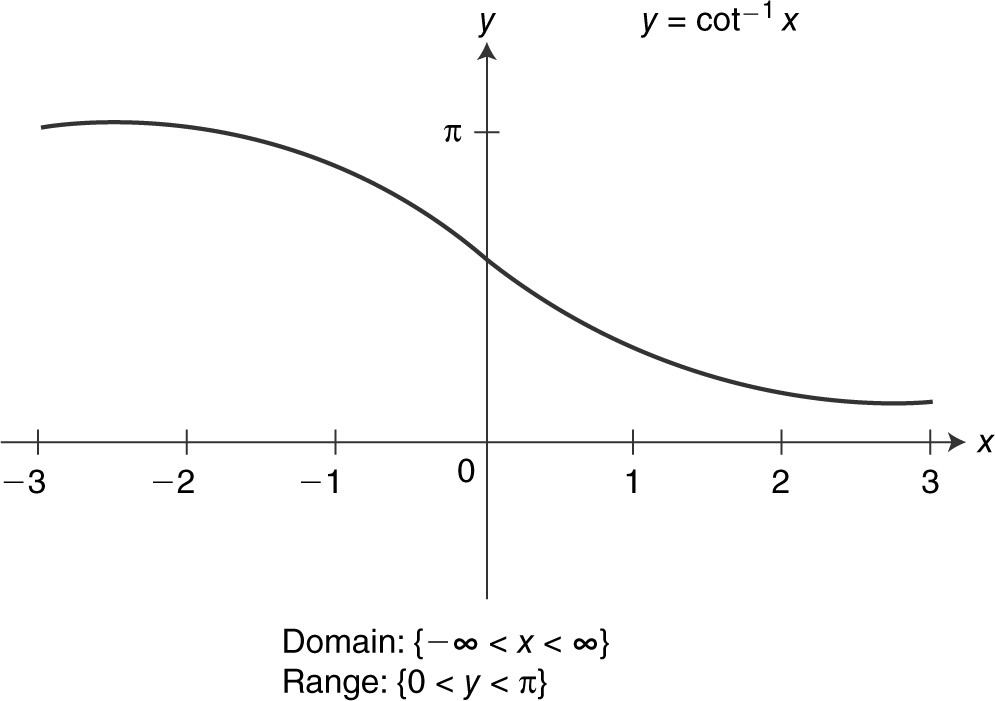
Figure 5.3-20
Formulas for using a calculator to get sec–1 x , csc–1 x , and cot–1 x :
sec–1 x = cos–1 (1/x )
csc–1 x = sin–1 (1/x )
cot–1 x = π /2 – tan–1 x
Example 1
Sketch the graph of the function y = 3 sin 2x . Indicate its domain, range, amplitude, period, and frequency.
The domain is all real numbers. The range is [–3, 3]. The amplitude is 3, which is the coefficient of sin 2x . The frequency is 2, the coefficient of x , and the period is (2π )÷ (the frequency), thus 2π ÷ 2 = π . See Figure 5.3-21 .
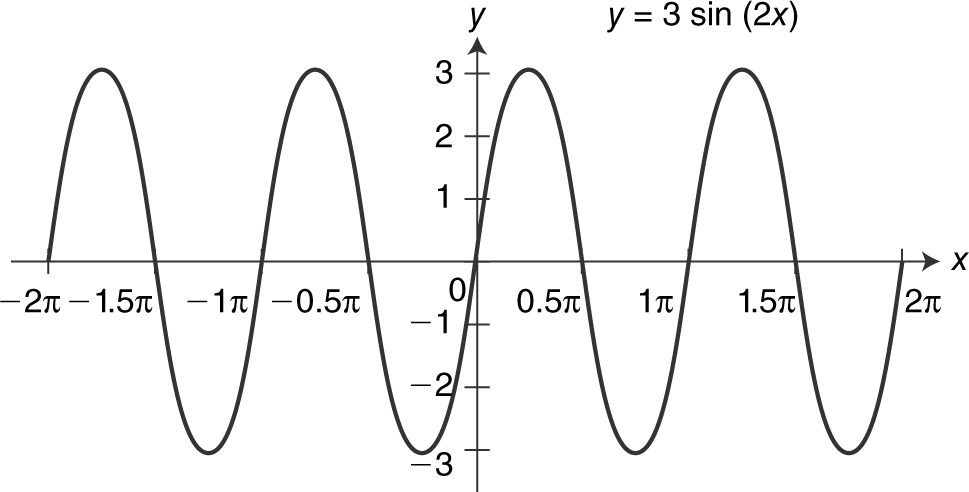
Figure 5.3-21
Example 2
Solve the equation cos x = –0.5 if 0 ≤ x ≤ 2π .
Note that cos (π /3) = 0.5 and that the cosine is negative in the second and third quadrants. Since cos x = –0.5, x must be in the second or third quadrant with a reference angle of π /3. In the second quadrant, x =π –(π /3)=2π /3 and in the third quadrant, x =π + (π /3)=4π /3. Thus x = 2π /3 or 4π /3. See Figure 5.3-22 .
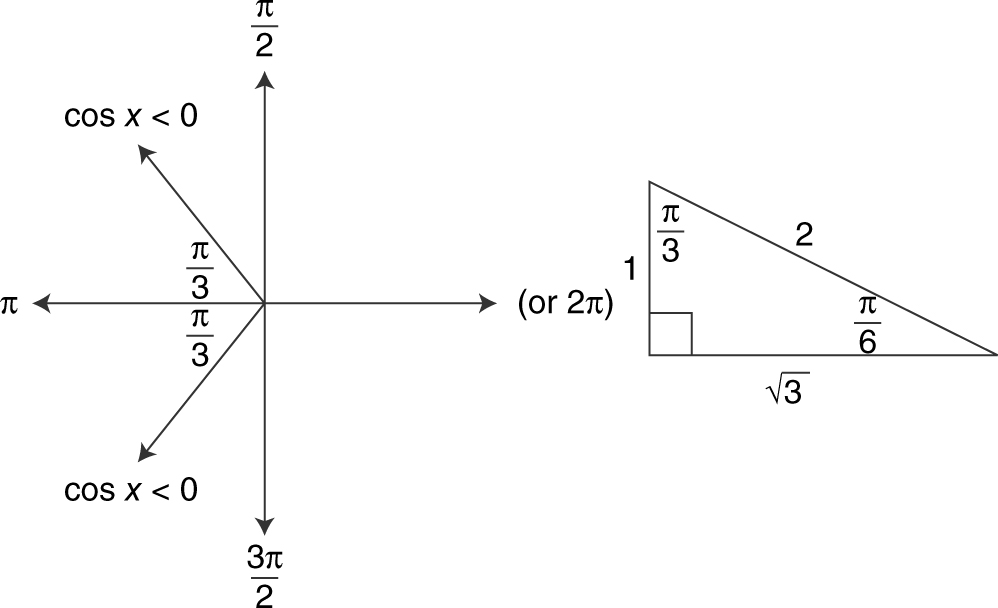
Figure 5.3-22
Example 3
Evaluate tan–1 (3).
Using your graphing calculator, enter tan–1 (3). The result is 1.2490457724. Note that the range of tan–1 x is (–π /2, π /2) and –π /2 ≤ 1.2490457724 ≤ π /2. Thus tan–1 (3) ≈ 1.2490457724.
Example 4
Evaluate sin 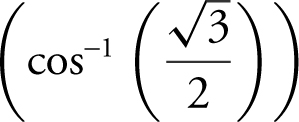 .
.
Note that  , and thus,
  Or you could use a calculator and
enter  and get 0.5.
Exponential and Logarithmic Functions
Exponential function with base a : f (x ) = a x where a > 0 and a ≠ 1.
Domain: {all real numbers}. Range: {y |y > 0}. y -Intercept: (0, 1). Horizontal asymptote: x -axis. Behavior: strictly increasing. See Figure 5.3-23 .
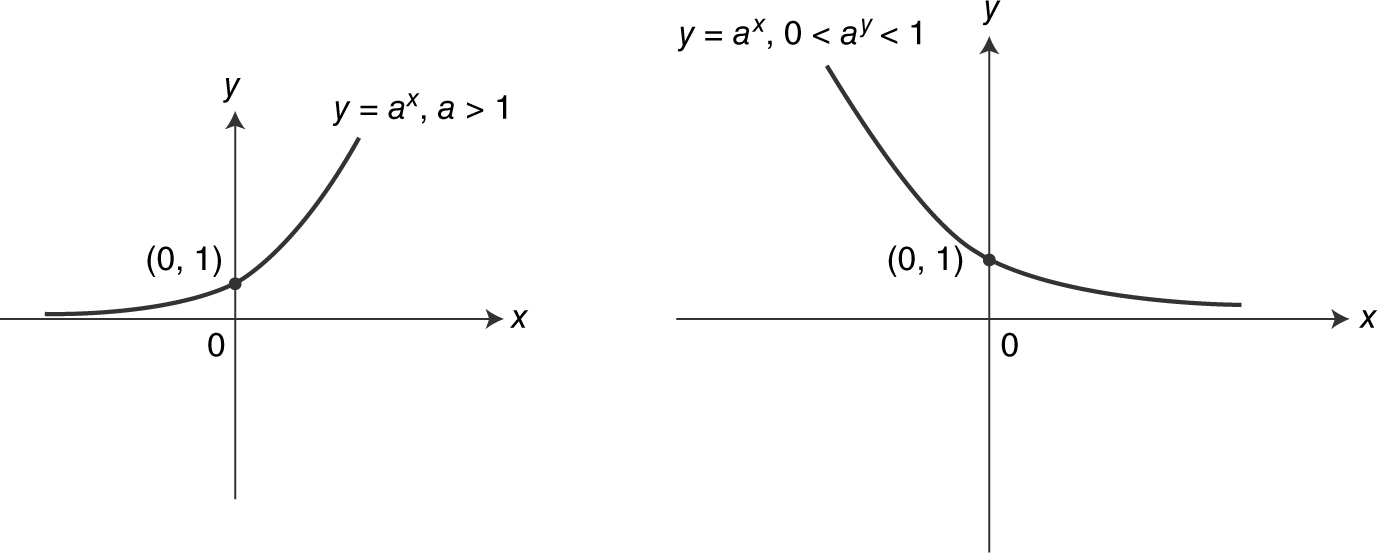
Figure 5.3-23
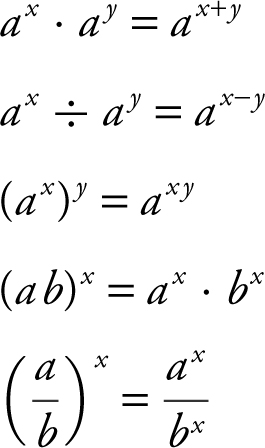
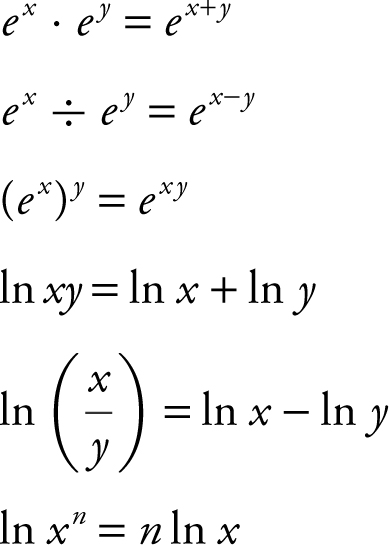
Properties of Exponents
Given a > 0, b > 0, and x and y are real numbers, then
Logarithmic function with base a : y = log a x if and only if a y = x where x > 0, a > 0, and a ≠ 1. See Figure 5.3-24 .
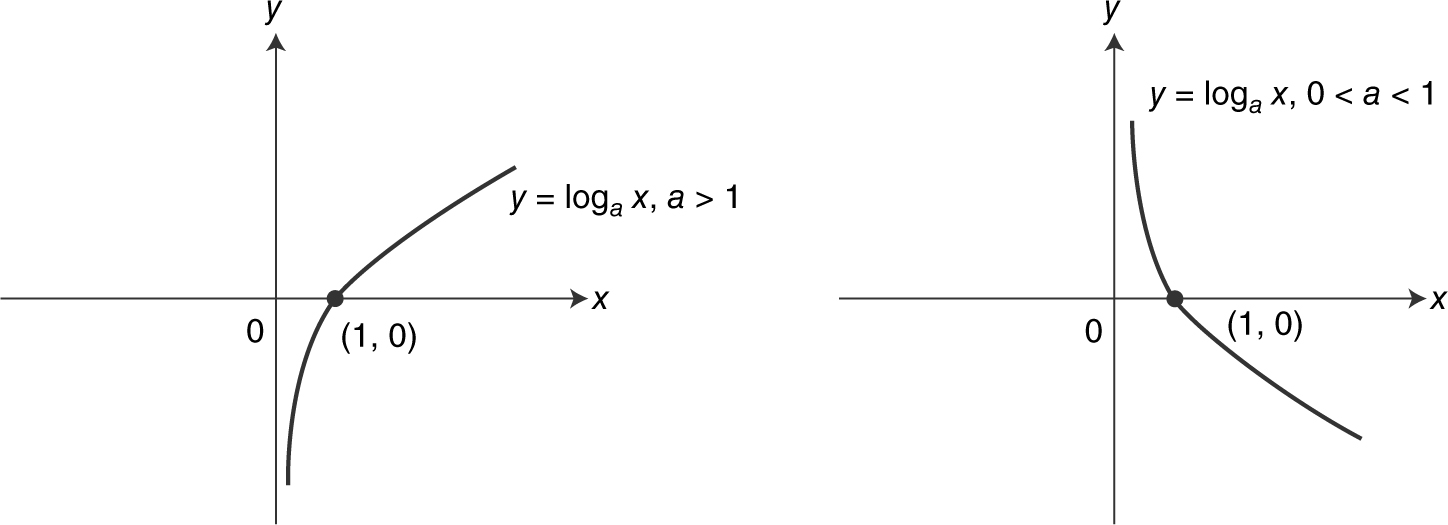
Figure 5.3-24
Domain: {x |x > 0}. Range: {all real numbers}. x -Intercept: (1, 0). Vertical asymptote: y -axis. Behavior: strictly increasing.
Note that y = log a x and y = a x are inverse functions (that is, log a (a x ) = a log a x = x ). See Figure 5.3-25 .
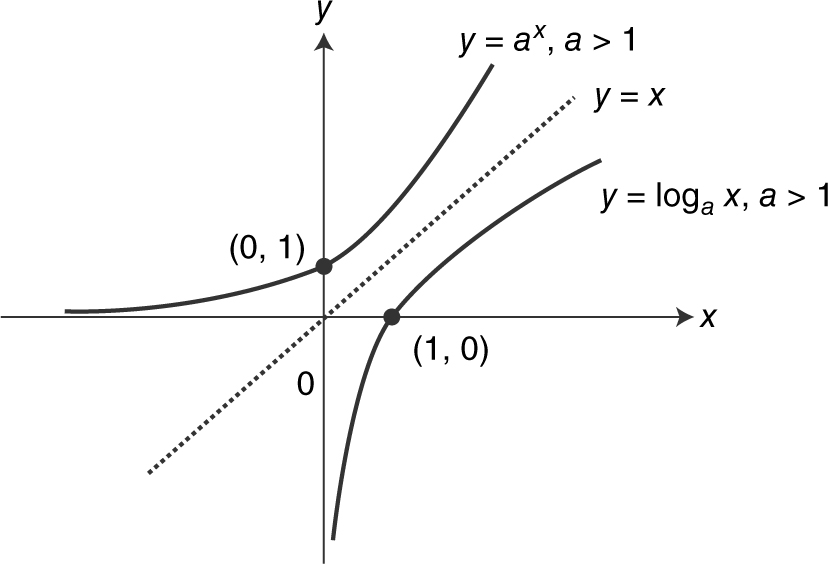
Figure 5.3-25
Properties of Logarithms
Given that x , y , and a are positive numbers with a ≠ 1 and n is a real number, then
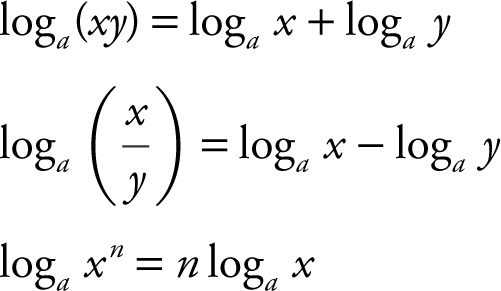
Note that log a 1 = 0, log a a = 1, and log a a x = x .
The Natural Base e
e ≈ 2.71828182846 …
The expression 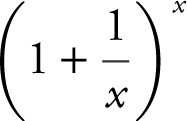 approaches the number e as x gets larger and larger. An equivalent expression is (1 + h )1/h . The expression (1 + h )1/h also approaches e as h approaches 0.
Exponential Function with Base e : f(x) = ex
The Natural Logarithmic Function: f (x ) = ln x = log e x where x > 0.
Note that y = e x and y = ln x are inverse functions: e ln x = ln e x = x . Also note that e 0 = 1, ln 1 = 0, and ln e = 1. See Figure 5.3-26 .
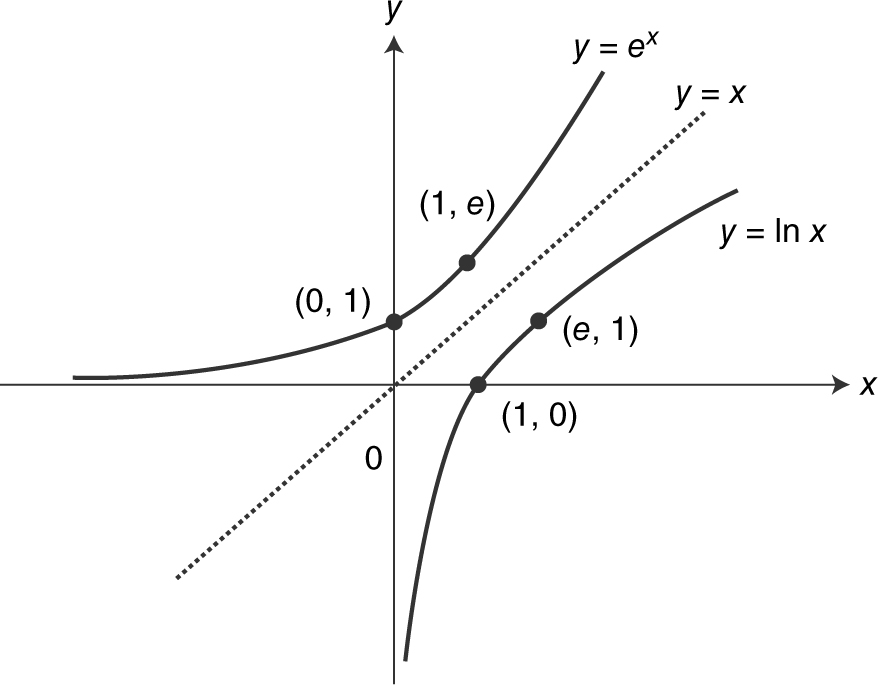
Figure 5.3-26
Properties of the Natural Logarithmic and Exponential Functions
Given x and y are real numbers, then
Change of Base Formula
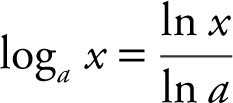 where a > 0 and a ≠ 1
Example 1
Sketch the graph of f (x ) = ln(x – 2). Note that the domain of f (x ) is {x |x > 2} and that f (3) = ln(1) = 0; thus, the x -intercept is 3. See Figure 5.3-27 .
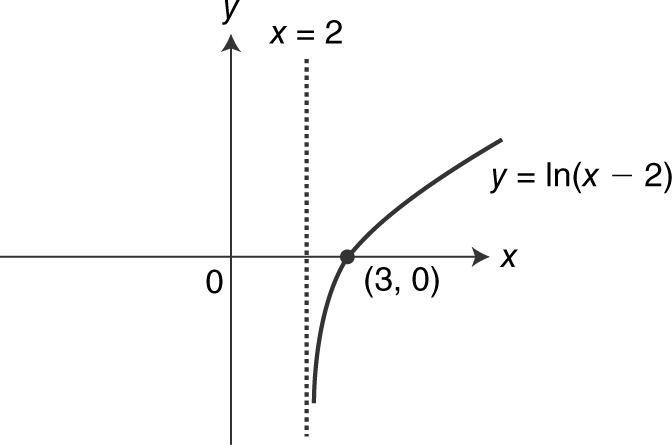
Figure 5.3-27
Example 2
Evaluate:
(a) log2 8
(b) 
(c) ln e 5
(a) Let n = log2 8 and thus 2 n = 8 = 23 . Therefore n = 3.
(b) Let n = , and thus  . Therefore, n = –2.
(c) You know that y = e x and y = ln x are inverse functions. Thus, ln e 5 = 5.
Example 3
Express ln(x (2x + 5)3 ) as the sum and multiplication of logarithms.
ln(x (2x + 5)3 ) = ln x + ln(2x + 5)3 = ln x + 3 ln(2x + 5)
Example 4
Solve 2e x +1 = 18 to the nearest thousandth.
2e x +1 = 18
e x +1 = 9
ln(e x +1 ) = ln 9
x + 1 = ln 9
x = 1.197
Example 5
Solve 3 ln 2x = 12 to the nearest thousandth.
3 ln 2x = 12
ln 2x = 4
e ln 2x = e 4
2x = e 4
5.4 Graphs of Functions
Main Concepts: Increasing and Decreasing Functions; Intercepts and Zeros; Odd and Even Functions; Shifting, Reflecting, and Stretching Graphs
Increasing and Decreasing Functions
Given a function f defined on an interval:
• f is increasing on an interval if f (x 1 ) < f (x 2 ) whenever x 1 < x 2 for any x 1 and x 2 in the interval.
• f is decreasing on an interval if f (x 1 ) > f (x 2 ) whenever x 1 < x 2 for any x 1 and x 2 in the interval.
• f is constant on an interval if f (x 1 ) = f (x 2 ) for any x 1 and x 2 in the interval.
A function value f (c ) is called a relative minimum of f if there exists an interval (a , b ) in the domain of f containing c such that f (c ) ≤ f (x ) for all x ∈ (a , b ).
A function value f (c ) is called a relative maximum of f if there exists an interval (a , b ) in the domain of f containing c such that f (c ) ≥ f (x ) for all x ∈ (a , b ).
See Figure 5.4-1 .
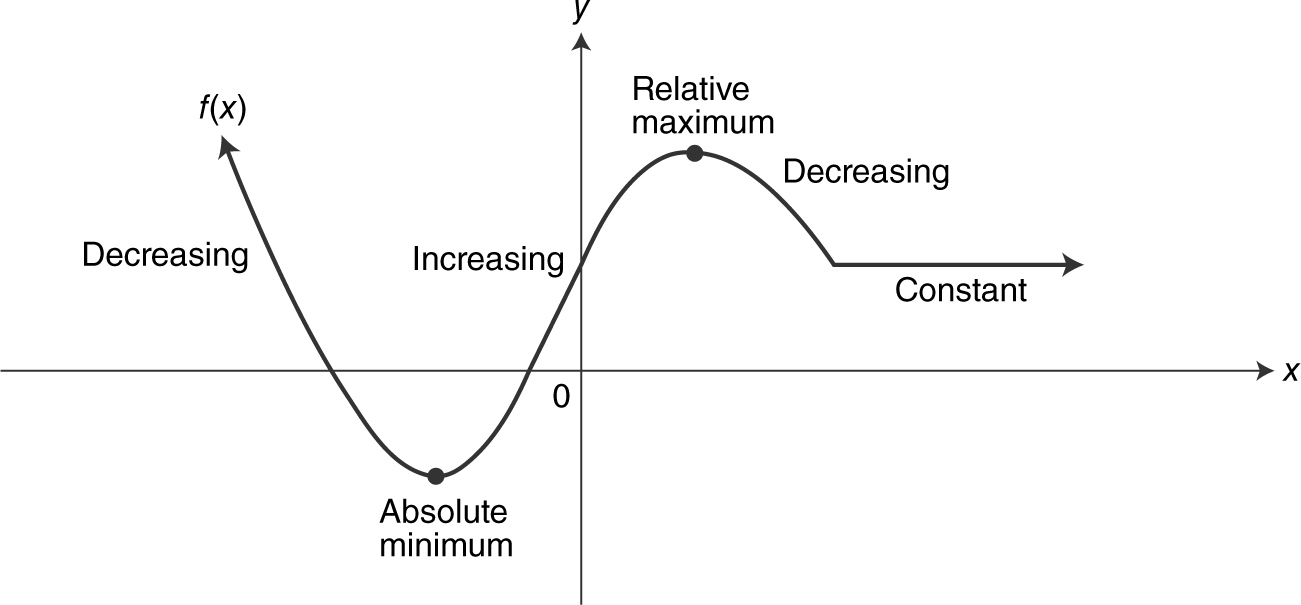
Figure 5.4-1
See the following examples. Using your graphing calculator, determine the intervals over which the given function is increasing, decreasing, or constant. Indicate any relative minimum and maximum values of the function.
Example 1
f (x ) = x 3 – 3x + 2
The function f (x ) = x 3 – 3x + 2 is increasing on (–∞, –1) and (1, ∞) and decreasing on (–1, 1). A relative minimum value of the function is 0, occurring at the point (1, 0), and a relative maximum value of 4 is located at the point (–1, 4). See Figure 5.4-2 .
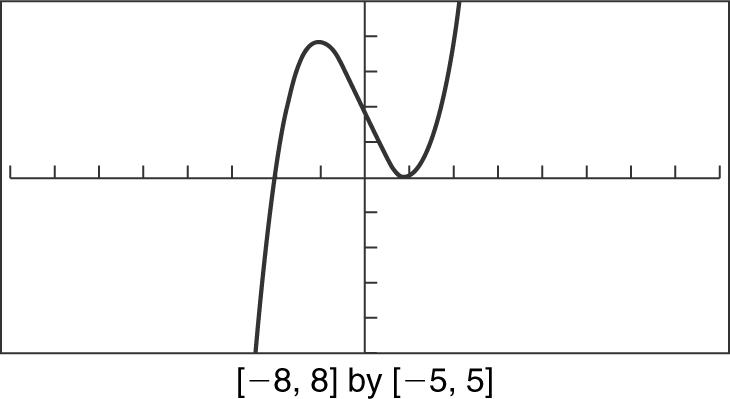
Figure 5.4-2
Example 2
g (x ) = (x – 1)3
Note that g (x ) = (x – 1)3 is increasing for the entire domain (–∞, ∞) and it has no relative minimum or relative maximum values. See Figure 5.4-3 .
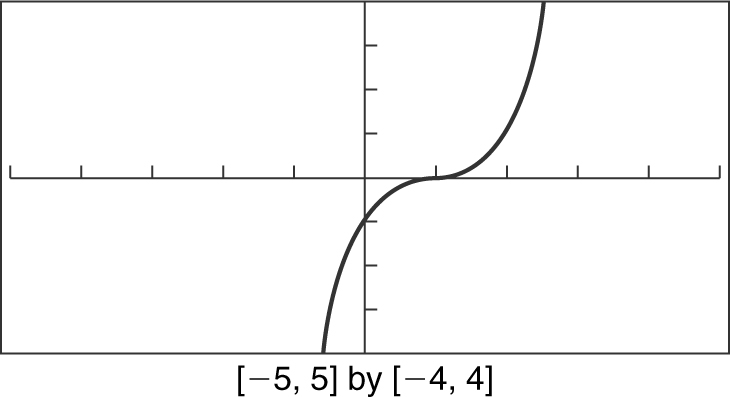
Figure 5.4-3
Example 3
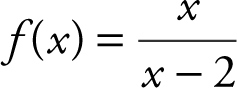
The function f is decreasing on the intervals (–∞,2) and (2, ∞), and it has no relative minimum or relative maximum values. See Figure 5.4-4 .
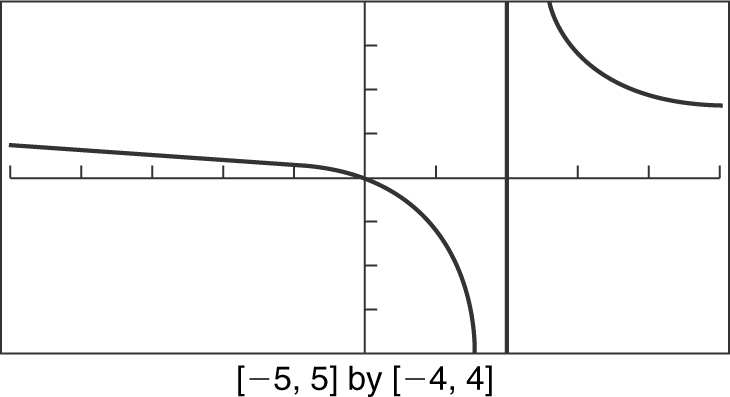
Figure 5.4-4
Intercepts and Zeros
Given a function f , if f (a ) = 0, then the point (a ,0) is an x -intercept of the graph of the function, and the number a is called a zero of the function.
If f (0) = b , then b is the y -intercept of the graph of the function. See Figure 5.4-5 .
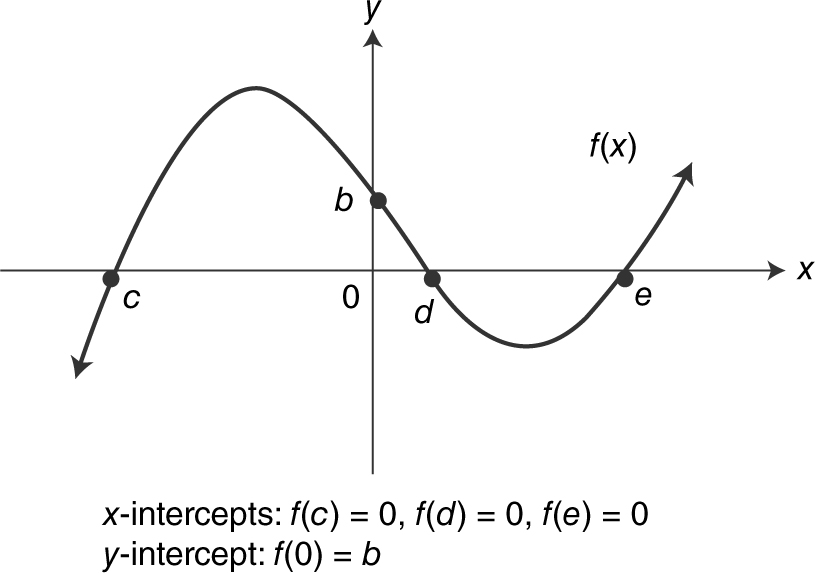
Figure 5.4-5
Note that to find the x -intercepts or zeros of a function, you should set f (x ) = 0; and to find the y -intercept, let x be 0 (i.e., find f (0)).
In the examples below, find the x -intercepts, y -intercept, and zeros of the given function if they exist.
Example 1
f (x ) = x 3 – 4x
Using your graphing calculator, note that the x -intercepts are –2, 0, and 2, and the y -intercept is 0. The zeros of f are –2, 0, and 2. See Figure 5.4-6 .
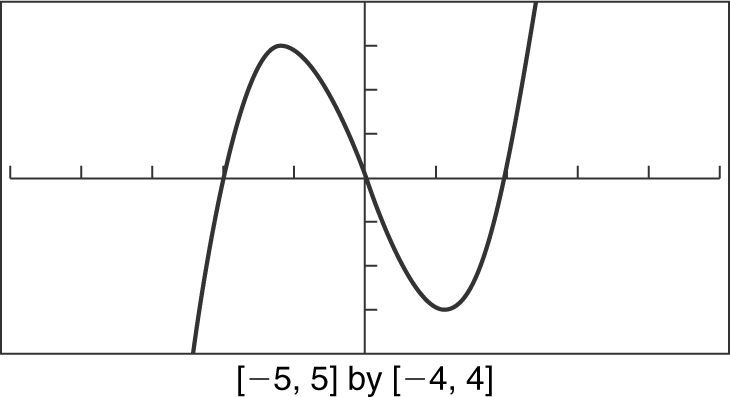
Figure 5.4-6
Example 2
f (x ) = x 2 – 2x + 4
Using your calculator, you see that the y -intercept is (0, 4) and the function f has no x -intercept or zeros. See Figure 5.4-7 .
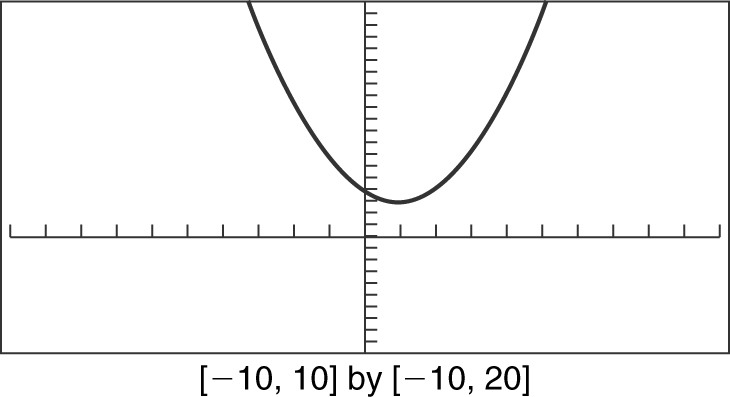
Figure 5.4-7
Odd and Even Functions
A function f is an even function if f (–x ) = f (x ) for all x in the domain. The graph of an even function is symmetrical with respect to the y -axis. If a point (a , b ) is on the graph, so is the point (–a , b ). If a function is a polynomial with only even powers, then it is an even function. See Figure 5.4-8 .
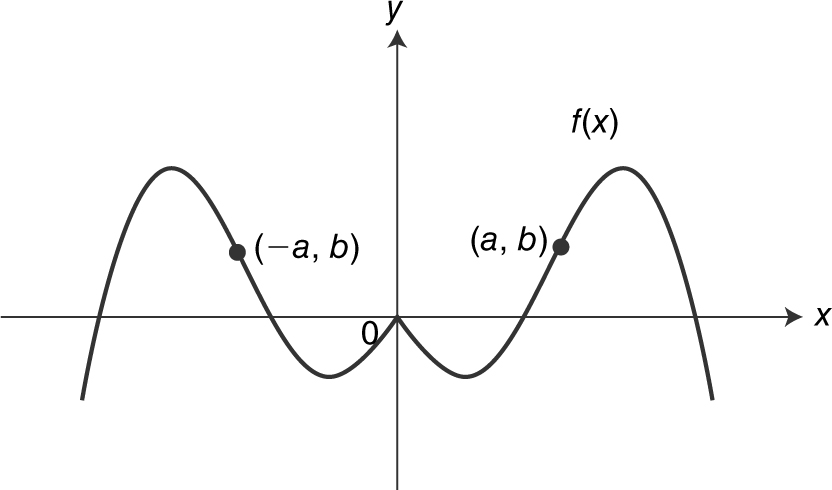
Figure 5.4-8
A function f is an odd function if f (–x ) = – f (x ) for all x in the domain. The graph of an odd function is symmetrical with respect to the origin. If a point (a , b ) is on the graph, so is the point (–a , –b ). If a function is a polynomial with only odd powers and a zero constant, then it is an odd function. See Figure 5.4-9 .
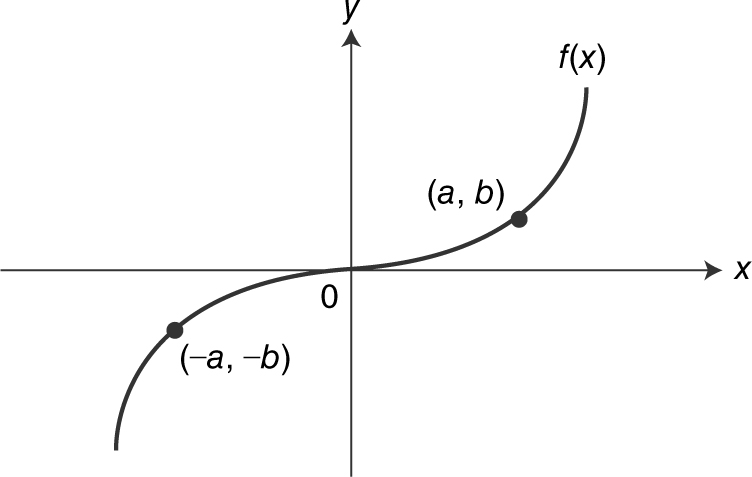
Figure 5.4-9
For the following examples, determine if the given functions are even, odd, or neither.
Example 1
f (x ) = x 4 – x 2
Begin by examining f (–x ). Since f (–x ) = (–x )4 – (–x )2 = x 4 – x 2 , f (–x ) = f (x ). Therefore, f (x ) = x 4 – x 2 is an even function. Or, using your graphing calculator, you see that the graph of f (x ) is symmetrical with respect to the y-axis. Thus, f (x ) is an even function. Or, since f has only even powers, it is an even function. See Figure 5.4-10 .
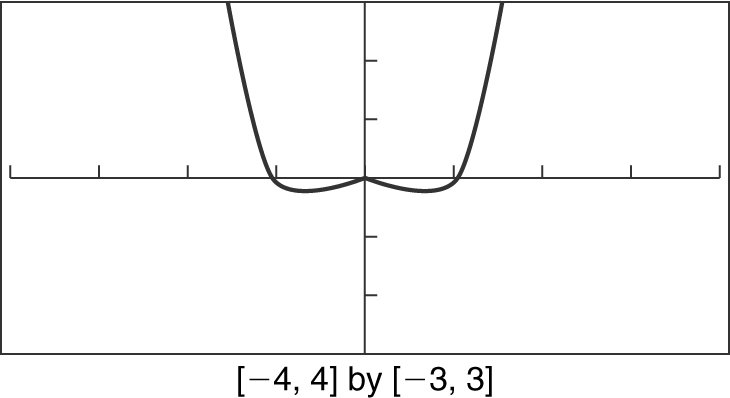
Figure 5.4-10
Example 2
g (x ) = x 3 + x
Examine g (–x ). Note that g (–x ) = (–x )3 + (–x ) = –x 3 – x = –g (x ). Therefore, g (x ) = x 3 + x is an odd function. Or, looking at the graph of g (x ) in your calculator, you see that the graph is symmetrical with respect to the origin. Therefore, g (x ) is an odd function. Or, since g (x ) has only odd powers and a zero constant, it is an odd function. See Figure 5.4-11 .
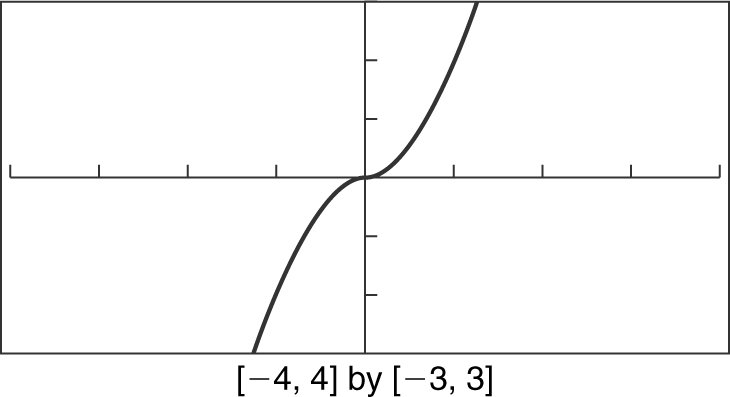
Figure 5.4-11
Example 3
h (x ) = x 3 + 1
Examine h (–x ). Since h (–x ) = (–x )3 + 1 = –x 3 + 1, h (–x ) ≠ h (x ) which indicates that h (x ) is not even. Also, –h (x ) = –x 3 – 1; therefore, h (–x ) ≠ – h (x ) which implies that h (x ) is not odd. Using your calculator, you notice that the graph of h (x ) is not symmetrical with respect to the y -axis or the origin. Thus, h (x ) is neither even nor odd. See Figure 5.4-12 .
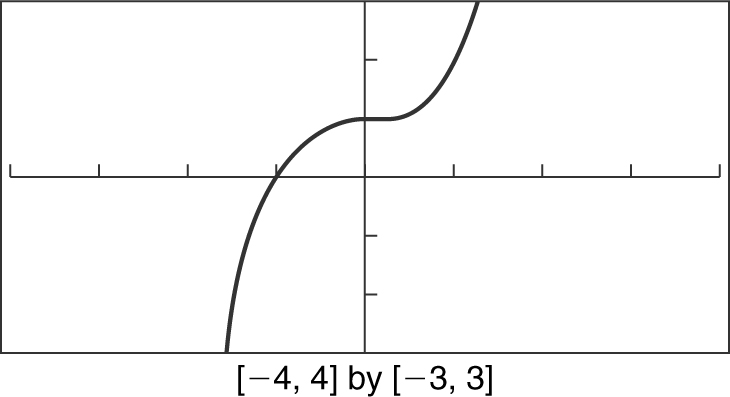
Figure 5.4-12
Shifting, Reflecting, and Stretching Graphs
Vertical and Horizontal Shifts
Given y = f (x ) and a > 0, the graph of y = f (x ) + a is a vertical shift of the graph of y = f (x ) by a units upward. And y = f (x ) – a is a vertical shift of the graph of y = f (x ) by a units downward. See Figure 5.4-13 .
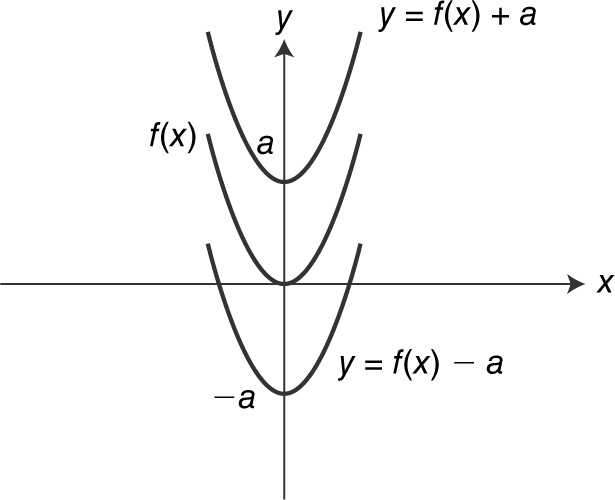
Figure 5.4-13
y = f (x – a ) is a horizontal shift of the graph of y = f (x ) by a units to the right. y = f (x + a ) is a horizontal shift of the graph of y = f (x ) by a units to the left. See Figure 5.4-14 .
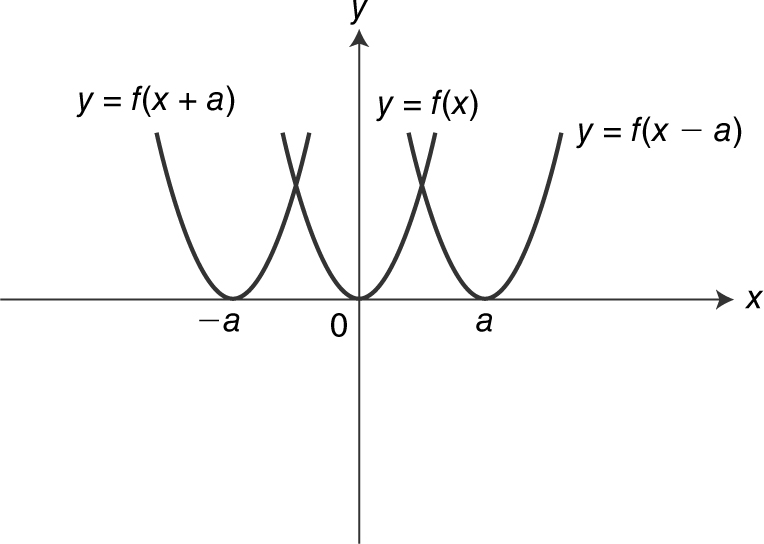
Figure 5.4-14
Reflections About the x -Axis, y -Axis, and the Origin
Given y = f (x ), then the graph of y = – f (x ) is a reflection of the graph of y = f (x ) about the x -axis. See Figure 5.4-15 .
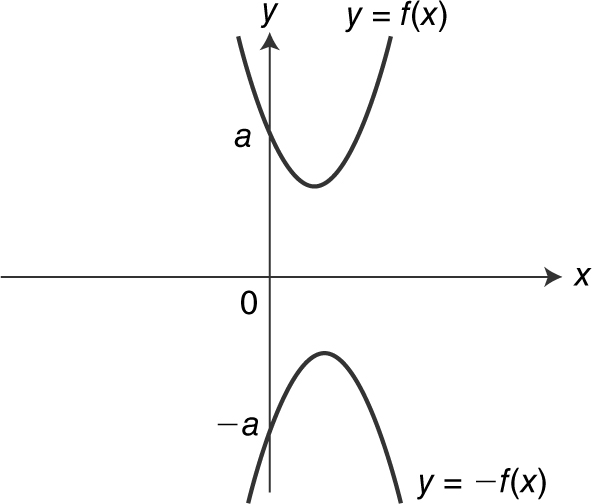
Figure 5.4-15
The graph of y = f (–x ) is a reflection of the graph of y = f (x ) about the y -axis. See Figure 5.4-16 .
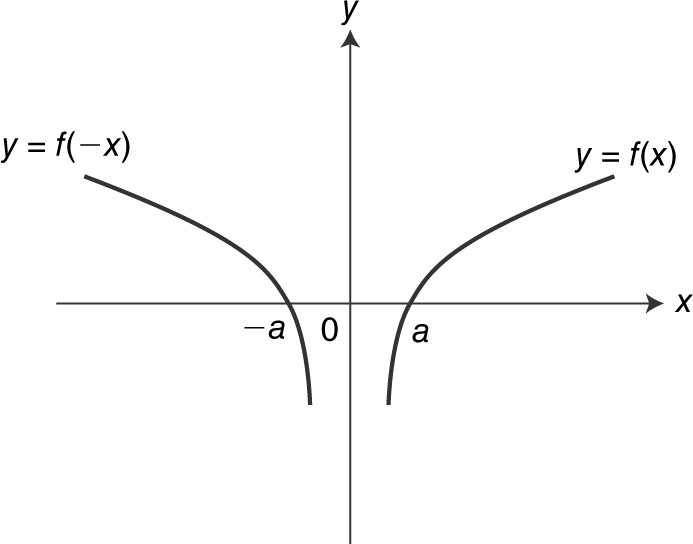
Figure 5.4-16
The graph of y = – f (–x ) is a reflection of the graph of y = f (x ) about the origin. See Figure 5.4-17 .
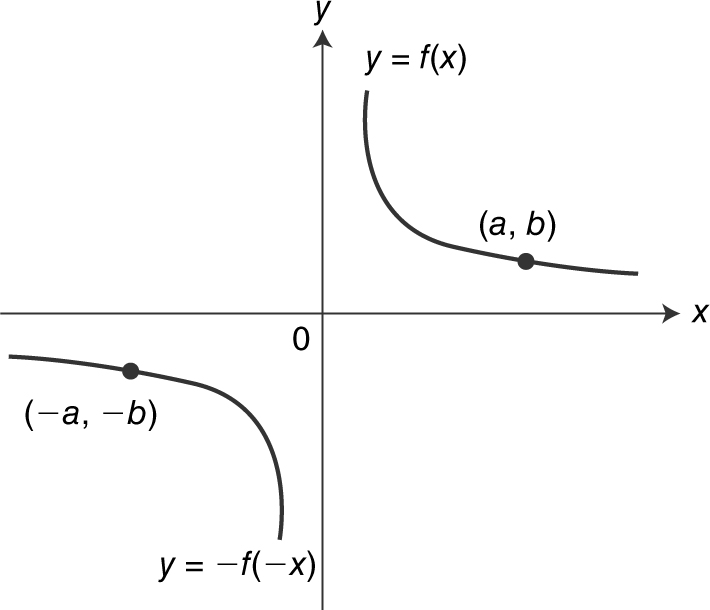
Figure 5.4-17
Stretching Graphs
Given y = f (x ), the graph of y = af (x ), where a > 1 is a vertical stretch of the graph of y = f (x ), and y = af (x ), where 0 < a < 1 is a vertical shrink of the graph of y = f (x ). See Figure 5.4-18 .
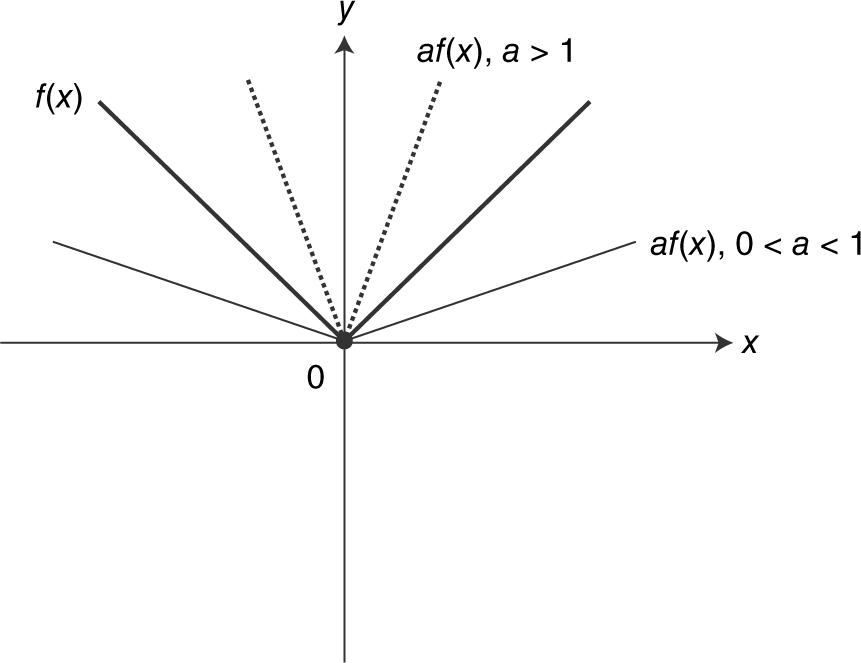
Figure 5.4-18
Example 1
Sketch the graphs of the given functions and verify your results with your graphing calculator: f (x ) = x 2 , g (x ) = 2x 2 , and p (x ) = (x – 3)2 + 2.
Note that g (x ) is a vertical stretch of f (x ) and that p (x ) is a horizontal shift of f (x ) by 3 units to the right followed by a vertical shift of 2 units upward. See Figure 5.4-19 .
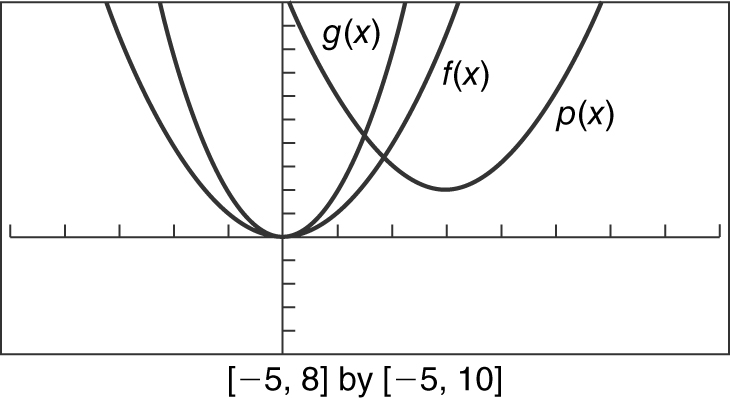
Figure 5.4-19
Example 2
Figure 5.4-20 contains the graphs of f (x ) = x 3 , h (x ), and g (x ). Find an equation for h (x ) and an equation for g (x ). See Figure 5.4-20 .
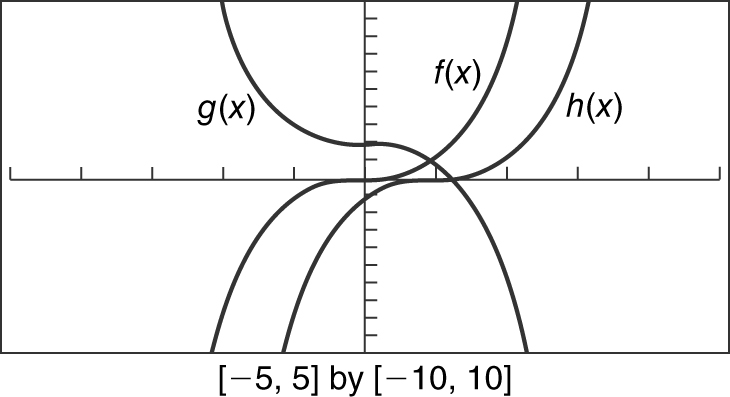
Figure 5.4-20
The graph of h (x ) is a horizontal shift of the graph of f (x ) by 1 unit to the right. Therefore, h (x ) = (x – 1)3 . The graph of g (x ) is a reflection of the graph of f (x ) about the x -axis followed by a vertical shift of 2 units upward. Thus, g (x ) = –x 3 + 2.
Example 3
Given f (x ) as shown in Figure 5.4-21 , sketch the graphs of f (x – 2), f (x ) + 1, and 2 f (x ).
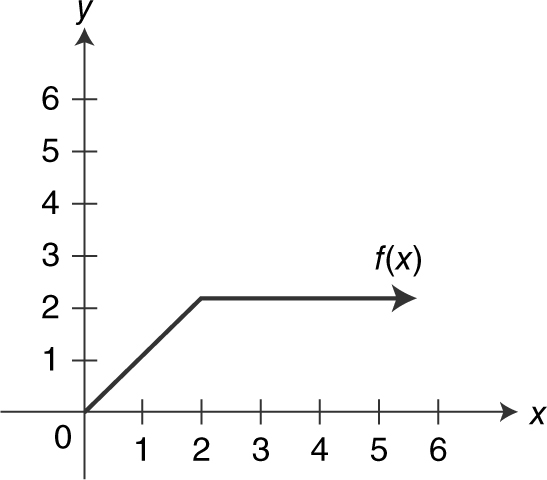
Figure 5.4-21
Note that (a) f (x – 2) is a horizontal shift of f (x ) by 2 units to the right, (b) f (x ) + 1 is a vertical shift of f (x ) by 1 unit upward, and (c) 2f (x ) is a vertical stretch of f (x ) by a factor of 2. See Figure 5.4-22 .
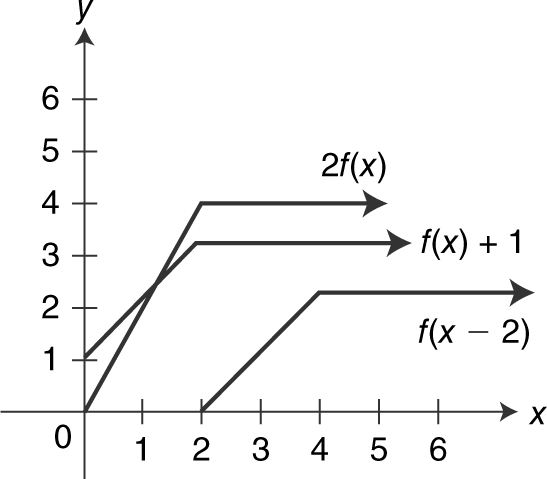
Figure 5.4-22
5.5 Rapid Review
1. If line l is parallel to the line y – 3x = 2, find ml , the slope of line l .
Answer: ml = 3
2. If line l is perpendicular to the line 2y + x = 6, find ml .
Answer: ml = 2
3. If x 2 + y = 9, find the x -intercepts and y -intercept.
Answer: The x -intercepts are ±3 (by setting y = 0), and the y -intercept is 9 (by setting x = 0).
4. Simplify (a) ln(e 3x ) and (b) e ln(2x ) .
Answer: Since y = ln x and y = e x are inverse functions, ln(e 3x ) = 3x and e ln(2x ) = 2x .
5. Simplify ln  .
.
Answer: Since ln  = ln(a ) – ln(b ), ln = ln(1) – ln x = – ln x .
6. Simplify ln (x 3 ).
Answer: Since ln(a b ) = b ln a , ln(x 3 ) = 3 ln x .
7. Solve the inequality x 2 – 4x > 5, using your calculator.
Answer: Let y 1 = x 2 – 4x and y 2 = 5. Look at the graph and see where y 1 is above y 2 .
Solution is {x : x < –1 or x > 5}. See Figure 5.5-1 .
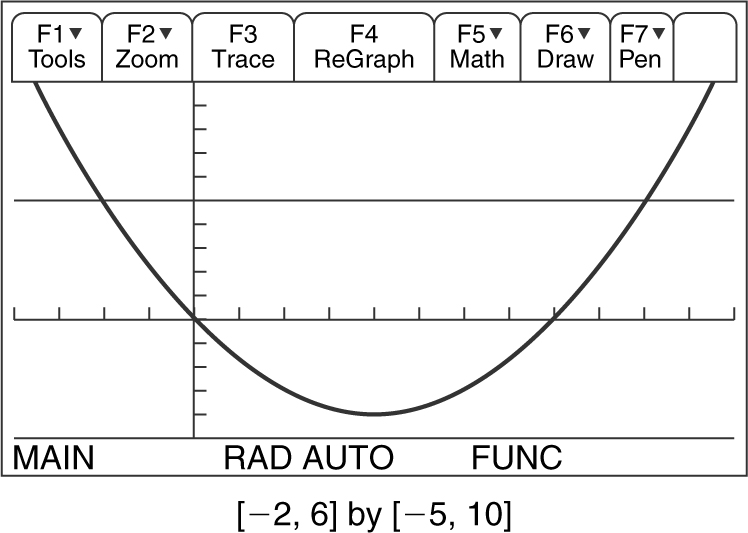
Figure 5.5-1
8. Evaluate  , and
, and  .
.
Answer:  , and
, and  .
.
9. 
Answer: The domain of f is {x : |x | ≥ 1 and x ≠ 2}.
10. Is the function f (x ) = x 4 – x 2 even, odd, or neither?
Answer: f (x ) is an even function since the exponents of x are all even.
5.6 Practice Problems
Part A—The use of a calculator is not allowed.
1 . Write an equation of a line passing through the point (–2, 5) and parallel to the line 3x – 4y + 12 = 0.
2 . The vertices of a triangle are A (–2, 0), B (0, 6), and C (4, 0). Find an equation of a line containing the median from vertex A to ![]() .
.
3 . Write an equation of a circle whose center is at (2, –3) and tangent to the line y = –1.
4 . Solve for x : |x – 2| = 2x + 5.
5 . Solve the inequality |6 – 3x | < 18 and sketch the solution on the real number line.
6 . Given f (x ) = x 2 + 3x , find  in simplest form.
7 . Determine which of the following equations represent y as a function of x :
(1) xy = –8
(2) 4x 2 + 9y 2 = 36
(3) 3x 2 – y = 1
(4) y 2 – x 2 = 4
8 . If f (x ) = x 2 and  , find (f ∘ g )(x ) and indicate its domain.
9 . Given the graphs of f and g in Figures 5.6-1 and 5.6-2 , evaluate:
(1) (f – g )(2)
(2) (f ∘ g )(1)
(3) (g ∘ f )(0)
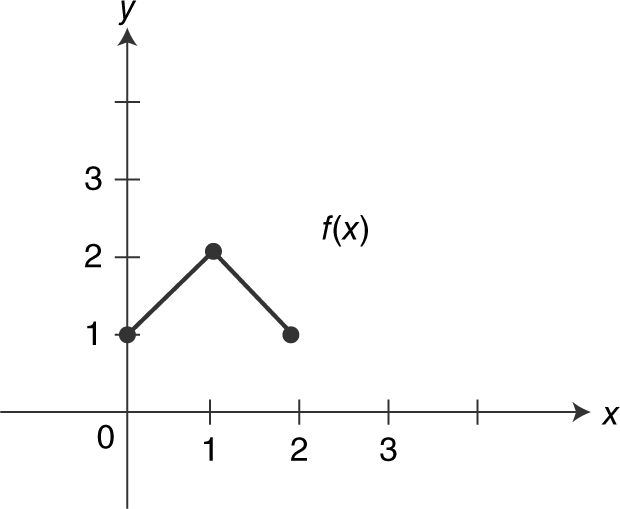
Figure 5.6-1
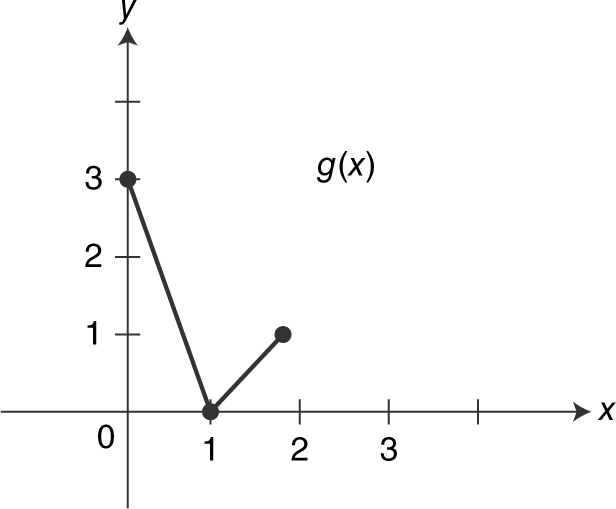
Figure 5.6-2
10 . Find the inverse of the function f (x ) = x 3 + 1.
11 . Sketch the graph of the equation 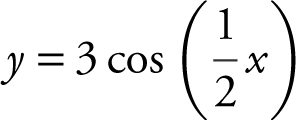 in the interval –2π ≤ x ≤ 2π and indicate the amplitude, frequency, and period.
12 . On the same set of axes, sketch the graphs of:
(1) y = ln x
(2) y = ln(–x )
(3) y = – ln(x + 3)
Part B—Calculators are permitted.
13 . Solve the inequality |2x + 4| ≤ 10.
14 . Solve the inequality x 3 – 2x > 1.
15 . Evaluate  .
.
16 . Solve for x to the nearest thousandth: e 2x – 6e x + 5 = 0.
17 . Solve for x to the nearest thousandth: 3 ln 2x – 3 = 12.
18 . Solve the inequality 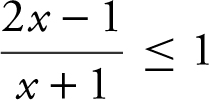 .
.
19 . Determine if the function f (x ) = –2x 4 + x 2 + 5 is even, odd, or neither.
20 . Given the function f (x ) = x 4 – 4x 3 , determine the intervals over which the function is increasing, decreasing, or constant. Find all zeros of f (x ), and indicate any relative minimum and maximum values of the function.
5.7 Cumulative Review Problems
21 . Given a linear function y = f (x ), with f (2) = 4 and f (–4) = 10, find f (x ).
22 . Solve the inequality x 3 – x ≥ 0 graphically.
23 . If  , x ≠ 0, evaluate
  and express the answer in simplest form.
24 . Given g (x ) = 3x – 12, find g –1 (3).
25 . Write an equation of the tangent line to the graph of x 2 + y 2 = 25 at the point (4, –3).
5.8 Solutions to Practice Problems
Part A—The use of a calculator is not allowed.
1 . Rewrite the equation 3x – 4y + 12 = 0 in y = mx + b form:  . Thus, the slope of the line is
 ![]() . Since line l is parallel to this line, the slope of line l must also be
. Since line l is parallel to this line, the slope of line l must also be ![]() . Line l also passes through the point (–2, 5). Therefore, an equation of line l is y – 5 =
. Line l also passes through the point (–2, 5). Therefore, an equation of line l is y – 5 = ![]() (x + 2).
(x + 2).
2 . Let M be the midpoint of ![]() . Using the midpoint formula, you will find the coordinates of M to be (2, 3). The slope of median
. Using the midpoint formula, you will find the coordinates of M to be (2, 3). The slope of median ![]() is
is ![]() . Thus, an equation of
. Thus, an equation of ![]() is
is  .
.
3 . Since the circle is tangent to the line y = –1, the radius of the circle is 2 units. Therefore, the equation of the circle is (x – 2)2 + (y + 3)2 = 4.
4 . The two derived equations are x – 2 = 2x + 5 and x – 2 = –2x – 5. From x – 2 = 2x + 5, x = –7 and from x – 2 = –2x – 5, x = –1. However, substituting x = –7 into the original equation |x – 2| = 2x + 5 results in 9 = –9, which is not possible. Thus the only solution is –1.
5 . The inequality |6 – 3x | < 18 is equivalent to –18 < 6 – 3x < 18. Thus, –24 < –3x < 12. Dividing through by –3 and reversing the inequality sign, you have 8 > x > –4 or –4 < x < 8.
6 . Since f (x + h ) = (x + h )2 + 3(x + h ), the expression  is equivalent
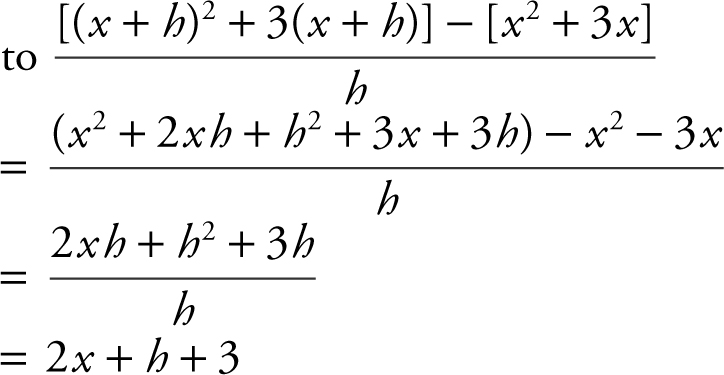
7 . The graph of equation (2) 4x 2 + 9y 2 = 36 is an ellipse, and the graph of equation (4) y 2 – x 2 = 4 is a hyperbola intersecting the y -axis at two distinct points. Both of these graphs fail the vertical line test. Only the graphs of equations (1) xy = –8 and (3) 3x 2 – y = 1 (which are a hyperbola in the second and fourth quadrants and a parabola, respectively) pass the vertical line test. Thus, only (1) xy = –8 and (3) 3x 2 – y = 1 are functions.
8 . The domain of g (x ) is –5 ≤ x ≤ 5, and the domain of f (x ) is the set of all real numbers. Therefore, the domain of  is the interval –5 ≤ x ≤ 5.
9 . From the graph,
(f – g )(2) = f (2) – g (2) = 1 – 1 = 0,
(f ∘ g )(1) = f (g (1)) = f (0) = 1, and
(g ∘ f )(0) = g (f (0)) = g (1) = 0.
10 . Let y = f (x ) and thus y = x 3 + 1. Switch x and y to obtain x = y 3 + 1. Solve for y and you will have y = (x – 1)1/3 . Thus f –1 (x ) = (x – 1)1/3 .
11 . The amplitude is 3, frequency is ½, and period is 4π . See Figure 5.8-1 .
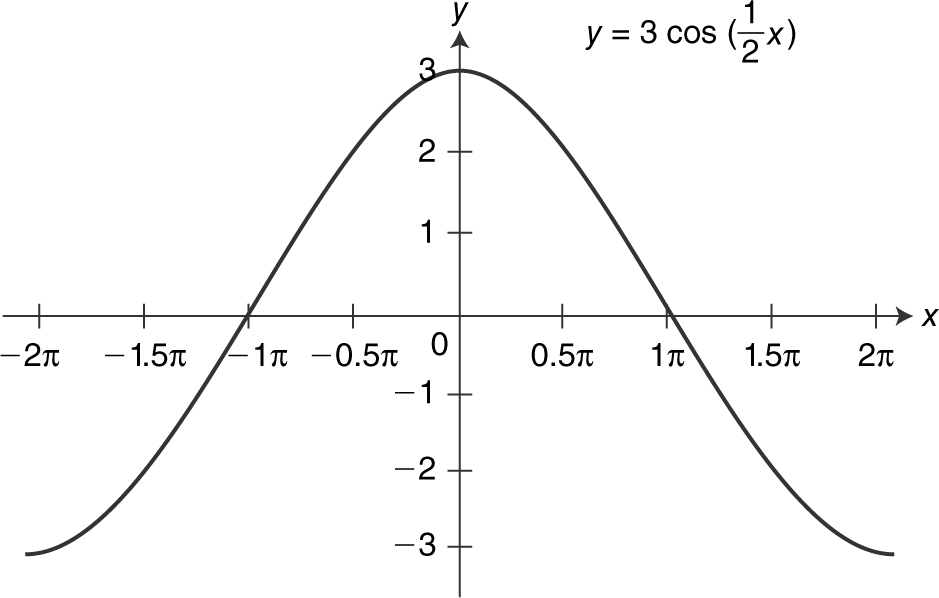
Figure 5.8-1
12 . Note that (1) y = ln x is the graph of the natural logarithmic function. (2) y = ln(–x ) is the reflection about the y -axis. (3) y = – ln(x + 3) is a horizontal shift 2 units to the left followed by a reflection about the x -axis. See Figure 5.8-2 .
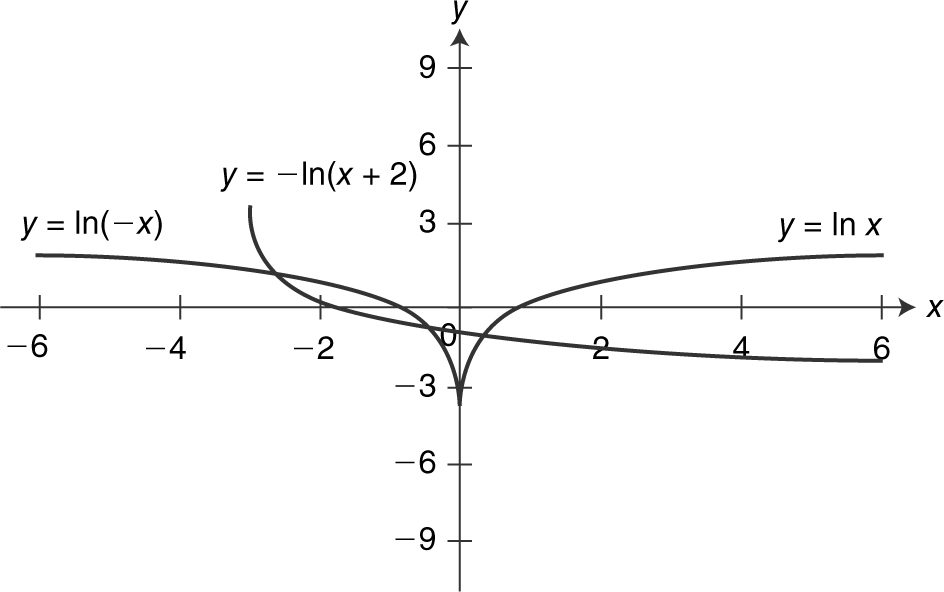
Figure 5.8-2
Part B—Calculators are permitted.
13 . Enter into your calculator y 1 = |2x + 4| and y 2 = 10. Locate the intersection points. They occur at x = –7 and 3. Note that y 1 is below y 2 from x = –7 to 3. Since the inequality is less than or equal to, the solution is –7 ≤ x ≤ 3. See Figure 5.8-3 .
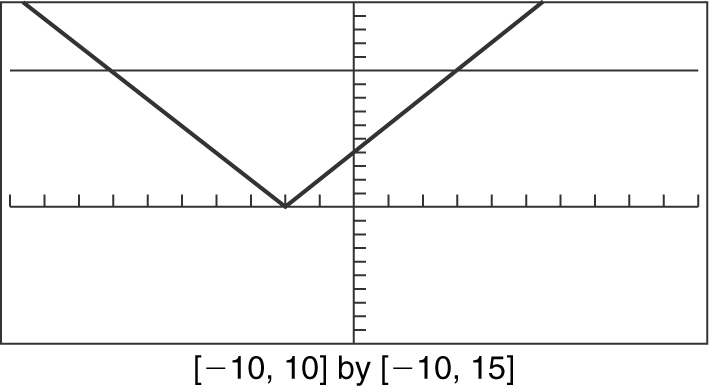
Figure 5.8-3
14 . Enter in your calculator y 1 = x 3 – 2x and y 2 = 1. Find the intersection points. The points are located at x = –1, –0.618, and 1.618. Since y 1 is above y 2 in the intervals –1 < x < –0.618 and x > 1.618 excluding the endpoints, the solutions to the inequality are the intervals –1 < x < –0.618 and x > 1.618. See Figure 5.8-4 .
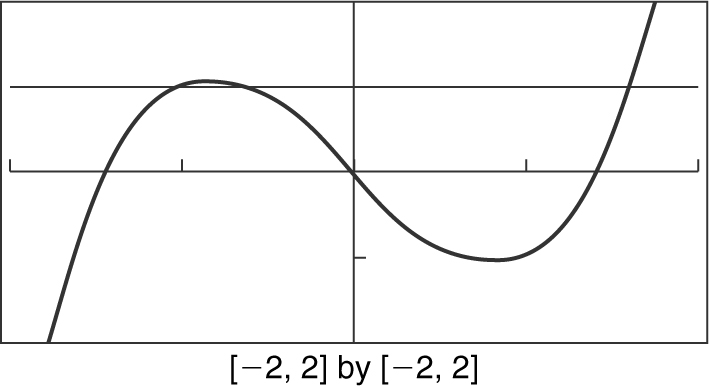
Figure 5.8-4
15 . Enter  into your calculator and obtain 1. (Note that arccos
  and
and  = 1.)
= 1.)
16 . Factor e 2x – 6e x + 5 = 0 as (e x – 5)(e x – 1) = 0. Thus (e x – 5) = 0 or (e x – 1) = 0, resulting in e x = 5 and e x = 1. Taking the natural log of both sides yields ln(e x ) = ln 5 ≈ 1.609 and ln(e x ) = ln 1 = 0. Therefore to the nearest thousandth, x = 1.609 or 0. (Note that ln(e x ) = x .)
17 . The equation 3 ln 2x – 3 = 12 is equivalent to ln 2x = 5. Therefore, e ln 2x = e 5 , 2x = e 5 ≈ 148.413159, and x ≈ 74.207.
18 . Enter  and y 2 = 1 into your calculator. Note that y 1 is below y 2 = 1 on the interval (–1, 2). Since the inequality is ≤ which includes the endpoint at x = 2, the solution is (–1, 2]. See Figure 5.8-5 .
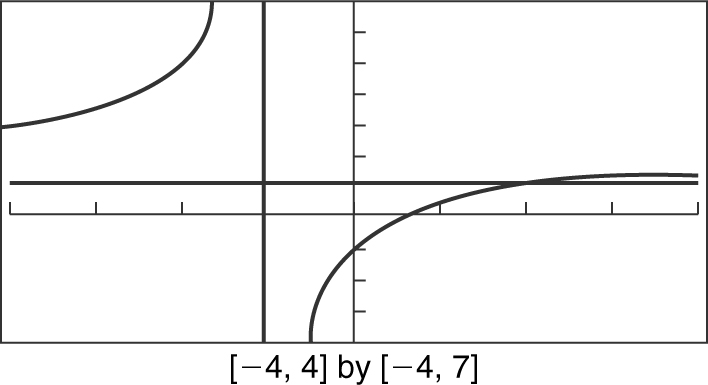
Figure 5.8-5
19 . Examine f (–x ) and f (–x ) = –2(–x )4 + (–x )2 + 5 =–2x 4 + x 2 + 5 = f (x ). Therefore, f (x ) is an even function. (Note that the graph of f (x ) is symmetrical with respect to the y -axis; thus, f (x ) is an even function.) See Figure 5.8-6 .
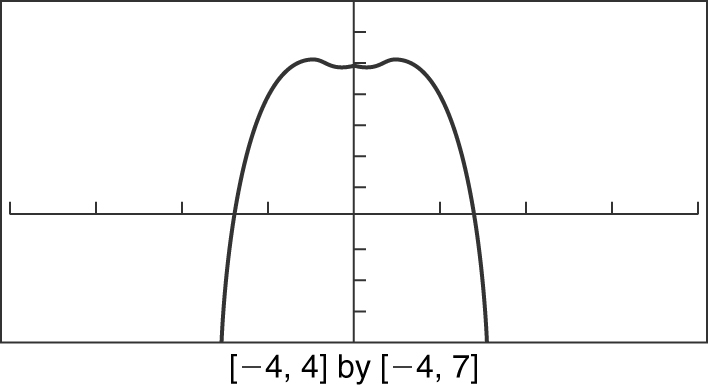
Figure 5.8-6
20 . Enter y 1 = x 4 – 4x 3 into your calculator and examine the graph. Note that the graph is decreasing on the interval (–∞, 3) and increasing on (3, ∞). The function crosses the x -axis at 0 and 4. Thus, the zeros of the function are 0 and 4. There is one relative minimum point at (3, –27). Thus, the relative minimum value for the function is –27. There is no relative maximum. See Figure 5.8-7 .
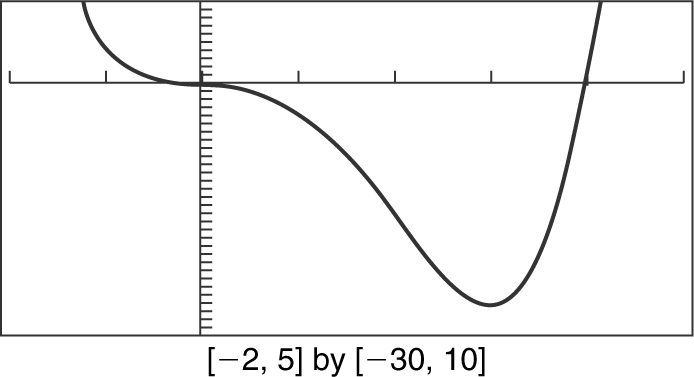
Figure 5.8-7
5.9 Solutions to Cumulative Review Problems
21 . The notation f (2) = 4 means that when x = 2, y = 4, and thus, the point (2, 4) is on the graph of f (x ). Similarly, f (–4) = 10 implies that the point (–4, 10) is also on the graph. Since f (x ) is a linear function, its graph is a line. The slope of a line, m , is defined as  . Thus
 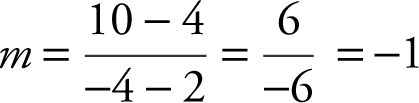 .
.
Using the point slope of a line y – y 1 = m (x – x 1 ), you have y – 4 = –1(x – 2) or y = –x + 6.
22 . Enter into your calculator y 1 = x 3 – x and examine the graph. See Figure 5.9-1 .
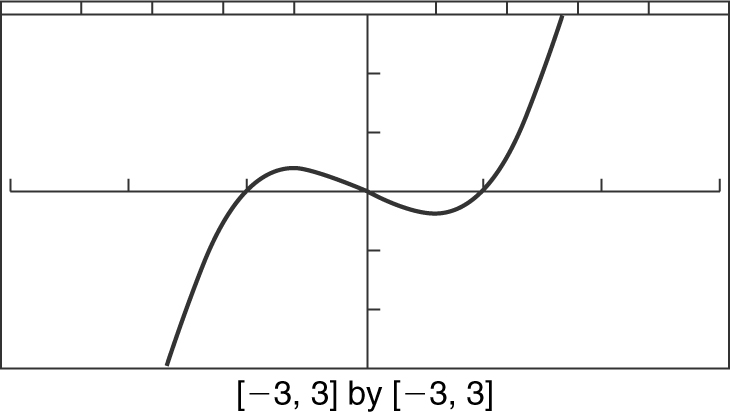
Figure 5.9-1
Note that f (x ) ≥ 0 on the intervals [–1, 0] and [1, ∞). Therefore, the solution to x 3 – x ≥ 0 is –1 ≤ x ≤ 0 or x ≥ 1.
23 . Since 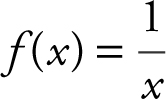 ,
, 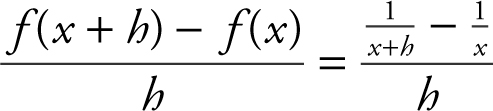 and the LCD (lowest common denominator) of
  and
and ![]() is x (x + h ). Multiplying the numerator and denominator of the complex fraction by the LCD, you have
is x (x + h ). Multiplying the numerator and denominator of the complex fraction by the LCD, you have  , which is equivalent to
  or
or  or
or  .
.
24 . Begin by finding g –1 (x ). Rewrite g (x ) = 3x – 12 as y = 3x – 12. Switch x and y , and you have x = 3y – 12. Solving for y , you have  . Substitute g –1 (x ) for y . Thus
  and
and  .
.
25 . The slope of the line segment joining the origin (0, 0) and the point of tangency (4, –3) is 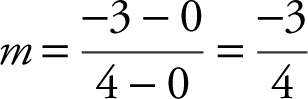 . Since this line segment is perpendicular to the tangent line, the slope of the tangent line is
 ![]() .
.
Using the point-slope form of a line, you have y – y 1 = m (x – x 1 ), or 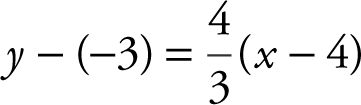 or
or 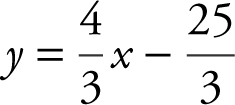 . See Figure 5.9-2 .
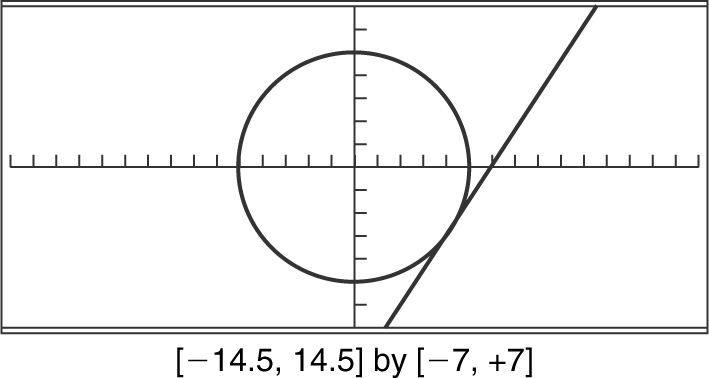
Figure 5.9-2