SAT Test Prep
CHAPTER 11
ESSENTIAL ALGEBRA 2 SKILLS
Lesson 3: Transformations
Functions with similar equations tend to have similar shapes. For instance, functions of the quadratic form ![]() have graphs that look like parabolas. You also should know how specific changes to the function equation produce specific changes to the graph. Learn how to recognize basic transformations of functions: shifts and reflections.
have graphs that look like parabolas. You also should know how specific changes to the function equation produce specific changes to the graph. Learn how to recognize basic transformations of functions: shifts and reflections.
To learn how changes in function equations produce changes in their graphs, study the graphs below until you understand how graphs change with changes to their equations.
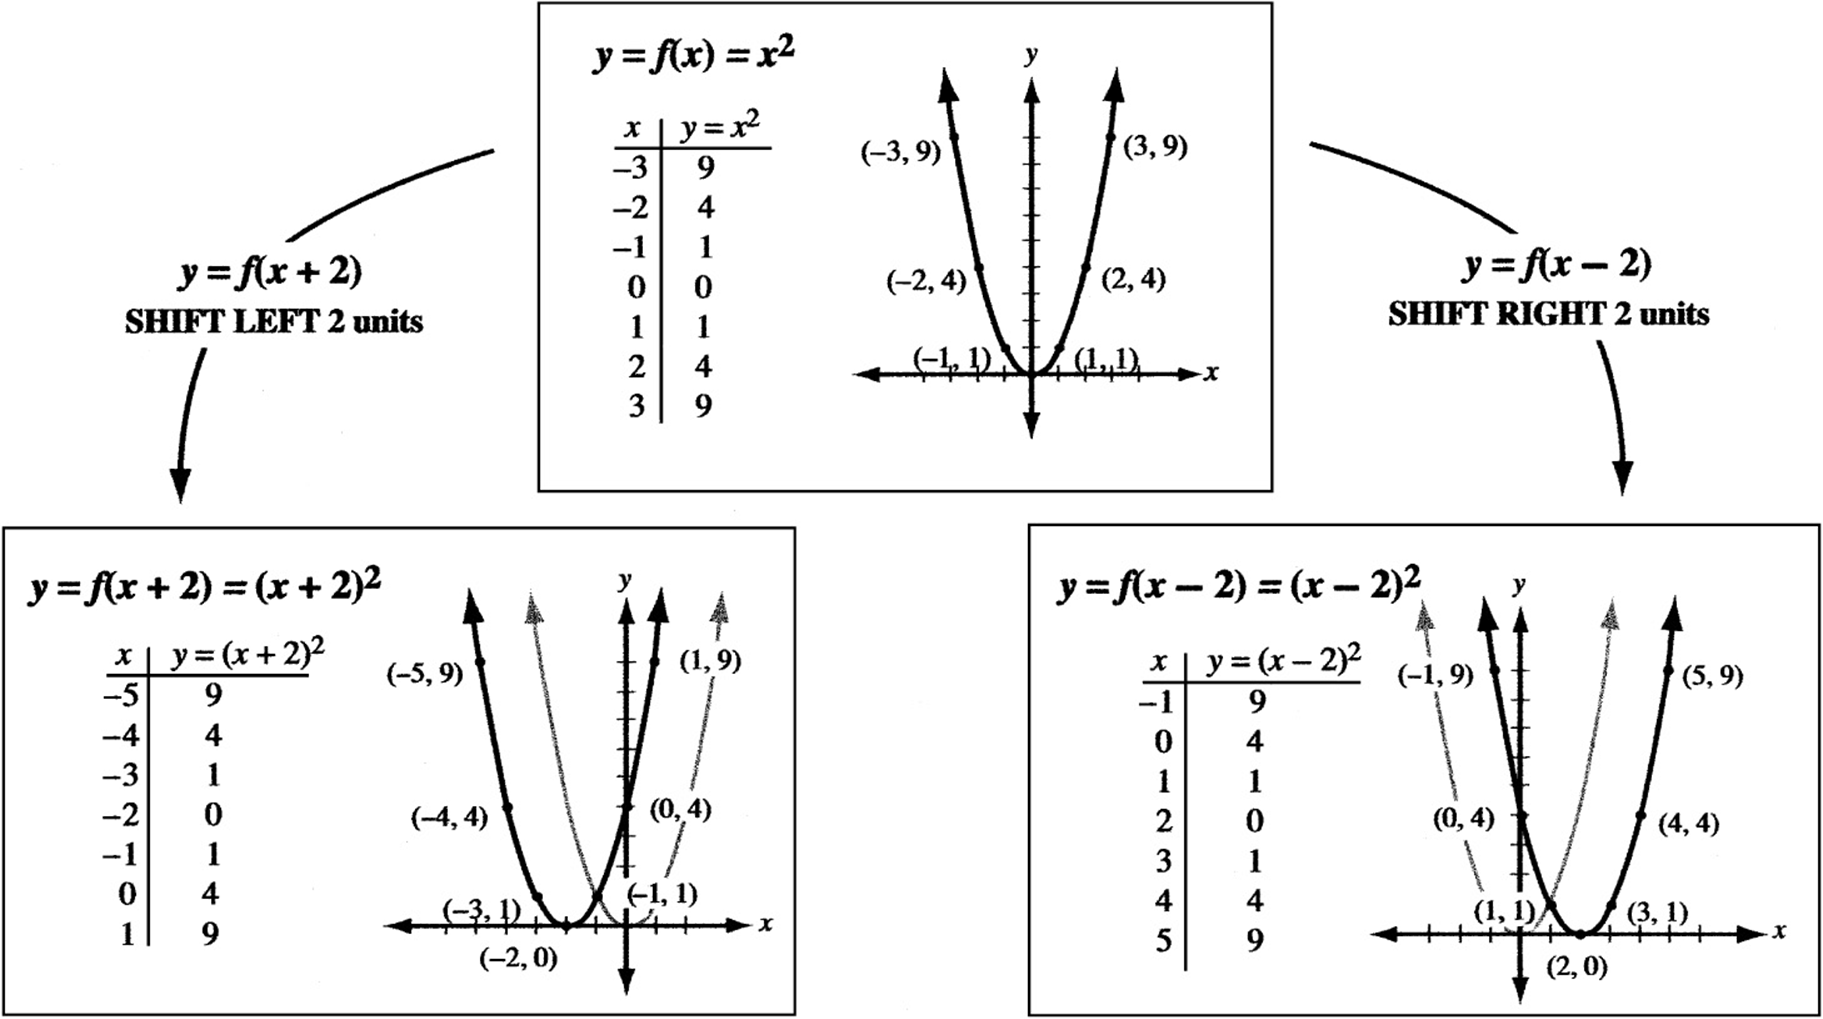
Horizontal Shifts
The graph of ![]() is simply the graph of
is simply the graph of ![]() shifted k units to the left. Similarly, the graph of
shifted k units to the left. Similarly, the graph of ![]() is the graph of y = f (x) shifted k units to the right. The graphs below show why.
is the graph of y = f (x) shifted k units to the right. The graphs below show why.
Vertical Shifts
The graph of ![]() is simply the graph of
is simply the graph of ![]() shifted k units up. Similarly, the graph of
shifted k units up. Similarly, the graph of ![]() is the graph of
is the graph of ![]() shifted k units downward. The graphs below show why.
shifted k units downward. The graphs below show why.
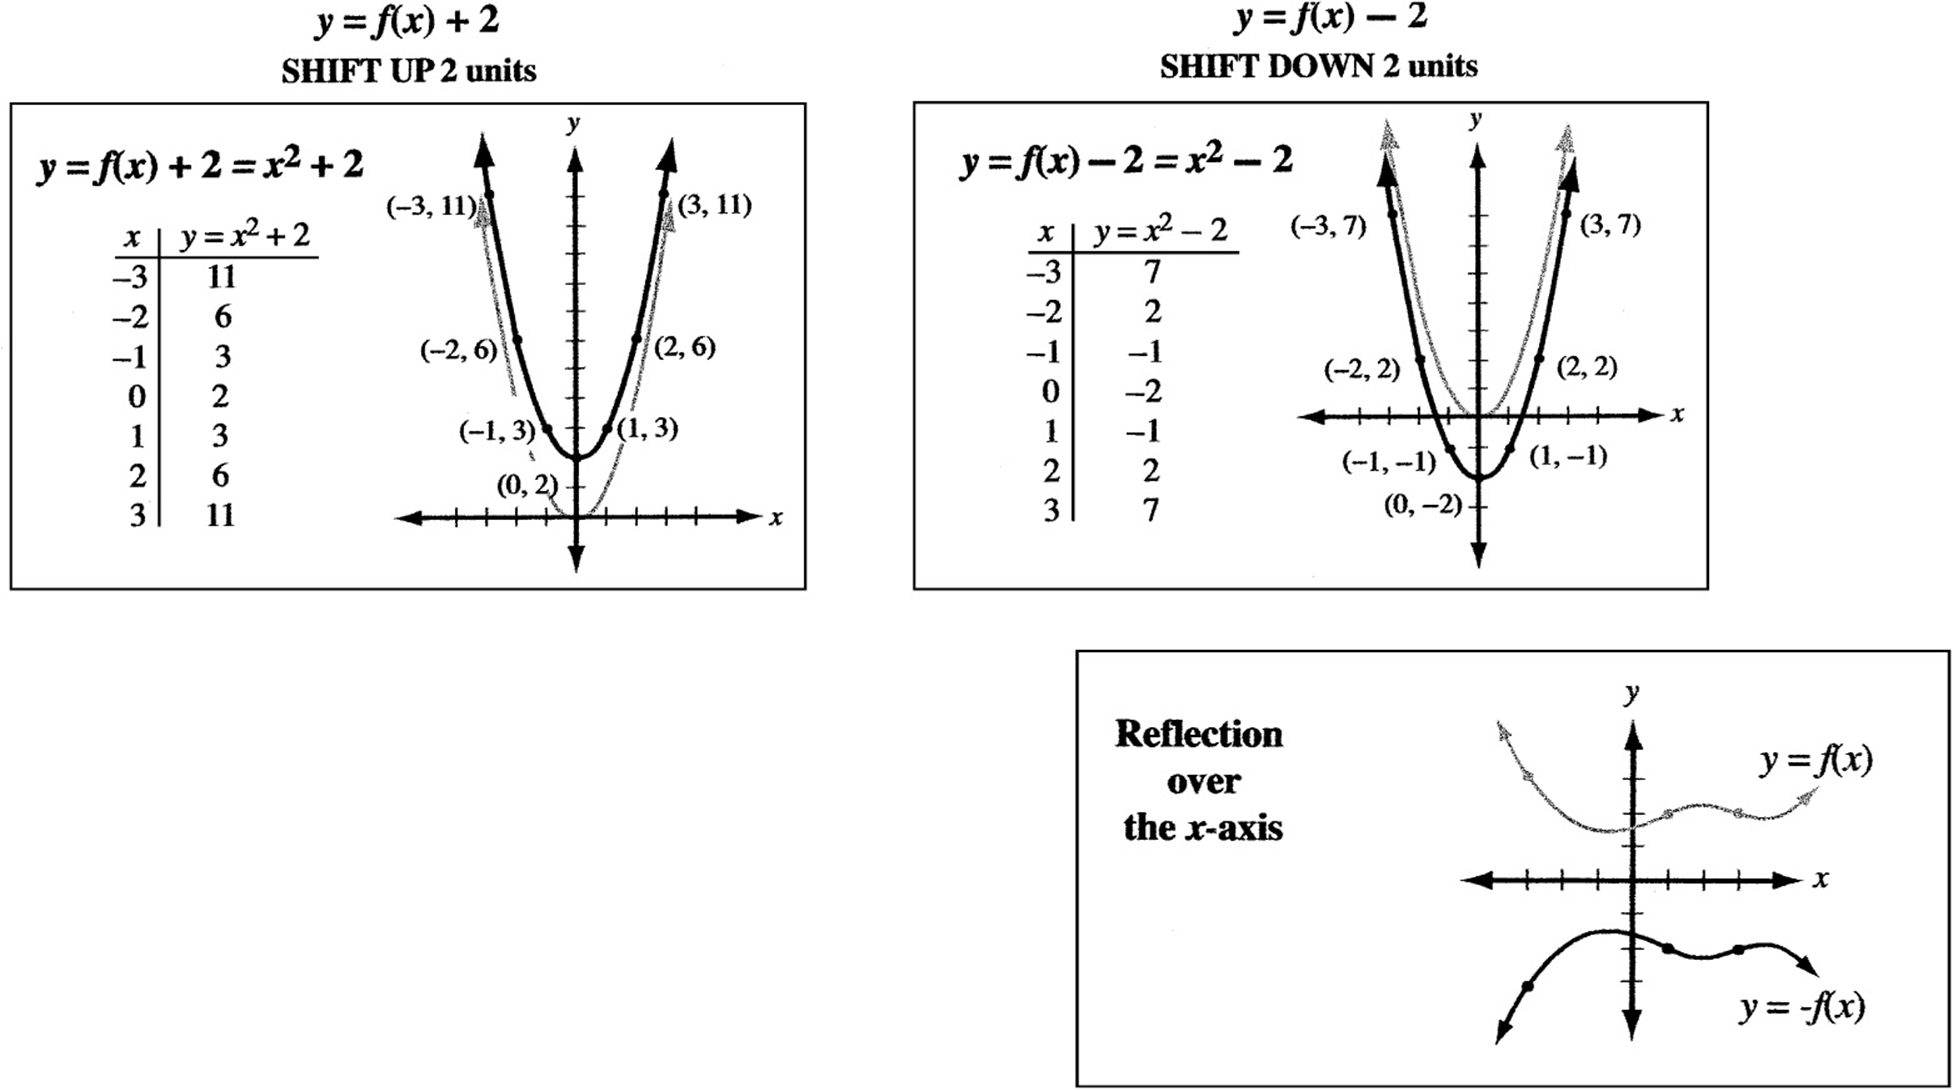
Reflections
When the point (3, 4) is reflected over the y- axis, it becomes (–3, 4). That is, the x coordinate is negated. When it is reflected over the x- axis, it becomes (3, –4). That is, the y coordinate is negated. (Graph it and see.) Likewise, if the graph of ![]() is reflected over the x-axis, it becomes
is reflected over the x-axis, it becomes ![]() .
.
Concept Review 3: Transformations
1. What equation describes the function ![]() after it has been shifted to the right five units?
after it has been shifted to the right five units?
2. What equation describes the function ![]() after it has been reflected over the x- axis?
after it has been reflected over the x- axis?
3. How does the graph of ![]() compare with the graph of
compare with the graph of ![]() ?
?
4. What specific features do the graphs of ![]() and
and ![]() have in common?
have in common?
5. What specific features do the graphs of ![]() and
and ![]() have in common?
have in common?
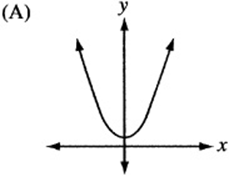
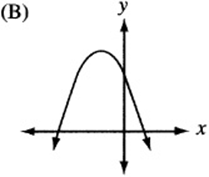
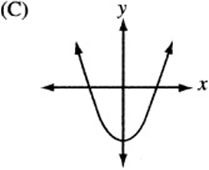
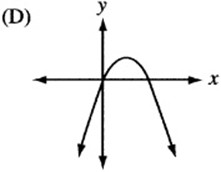
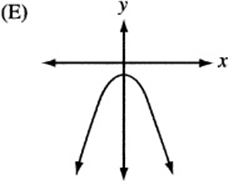
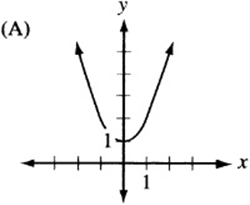
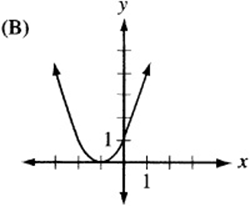
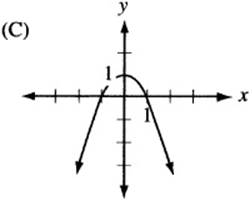
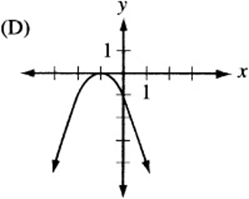
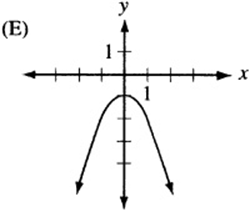
6. The quadratic function h is given by ![]() , where a is a negative constant and c is a positive constant. Which of the following could be the graph of
, where a is a negative constant and c is a positive constant. Which of the following could be the graph of ![]() ?
?
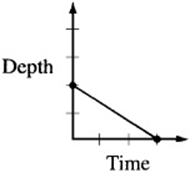
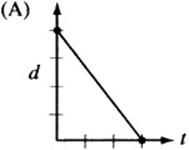
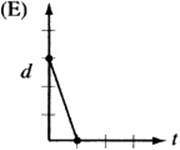
7. The figure above is a graph showing the depth of water in a rectangular tank that is being drained at a constant rate over time. Which of the following represents the graph of the situation in which the tank starts with twice as much water, and the water drains out at twice the rate?
SAT Practice 3: Transformations
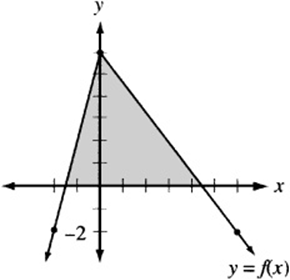
1. The shaded region above, with area A, indicates the area between the x-axis and the portion of ![]() that lies above the x- axis. For which of the following functions will the area between the x- axis and the portion of the function that lies above the x-axis be greater than A?
that lies above the x- axis. For which of the following functions will the area between the x- axis and the portion of the function that lies above the x-axis be greater than A?
![]()
![]()
![]()
![]()
![]()
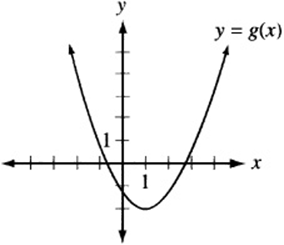
2. The figure above shows the graph of the function ![]() , which has a minimum value at the point (1, –2). What is the maximum value of the function
, which has a minimum value at the point (1, –2). What is the maximum value of the function ![]()
(A) 7
(B) 6
(C) 5
(D) 4
(E) It cannot be determined from the information given.
3. A point is reflected first over the line ![]() , then over the x-axis, and then over the y-axis. The resulting point has the coordinates (3, 4). What were the coordinates of the original point?
, then over the x-axis, and then over the y-axis. The resulting point has the coordinates (3, 4). What were the coordinates of the original point?
(A) (3, 4)
(B) (–3,-4)
(C) (3, –4)
(D) (–4, –3)
(E) (4, 3)
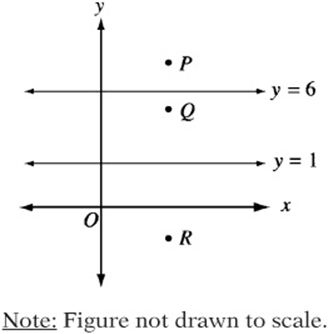
4. In the figure above, point Q is the reflection of point P over the line ![]() , and point R is the reflection of point Q over the line
, and point R is the reflection of point Q over the line ![]() . What is the length of line segment PR?
. What is the length of line segment PR?
(A) 10
(B) 11
(C) 12
(D) 13
(E) 14
5. If the functions f (x), g (x), and h (x) are defined by the equations ![]() ,
, ![]() , and
, and ![]() , then which of the following represents the graph of
, then which of the following represents the graph of ![]()
Answer Key 3: Transformations
Concept Review 3
1. ![]() . Although the –5 seems to suggest a shift to the left (because when we subtract 5 from a number, we move five units to the left on the number line), this change actually shifts the graph to the right. To see why, look back at the first two examples in Lesson 3, and pay particular attention to how the changed equations produce the individual points on the graph and how these points compare with the points on the original graph. It also may help to pick a simple function, such as
. Although the –5 seems to suggest a shift to the left (because when we subtract 5 from a number, we move five units to the left on the number line), this change actually shifts the graph to the right. To see why, look back at the first two examples in Lesson 3, and pay particular attention to how the changed equations produce the individual points on the graph and how these points compare with the points on the original graph. It also may help to pick a simple function, such as ![]() , graph it by hand (by choosing values for x, calculating the corresponding values for y, and plotting the ordered pairs), and then graph
, graph it by hand (by choosing values for x, calculating the corresponding values for y, and plotting the ordered pairs), and then graph ![]() in the same way to see how the graphs compare.
in the same way to see how the graphs compare.
2. ![]() . Since the point (x, –y) is the reflection of (x, y) over the x-axis, reflecting any function over the x- axis simply means multiplying y by –1. This “negates” every term in the function.
. Since the point (x, –y) is the reflection of (x, y) over the x-axis, reflecting any function over the x- axis simply means multiplying y by –1. This “negates” every term in the function.
3. It is the original graph after it has been “flipped” vertically and “stretched” vertically. The graph of ![]() is a “vertically stretched” version of
is a “vertically stretched” version of ![]() that also has been reflected over the x- axis. Every point on
that also has been reflected over the x- axis. Every point on ![]() is four times farther from the x- axis as its corresponding point on
is four times farther from the x- axis as its corresponding point on ![]() and is also on the opposite side of the x- axis.
and is also on the opposite side of the x- axis.
4. Overall shape and maximum and minimum values. The graph of ![]() is simply the graph of
is simply the graph of ![]() shifted to the left 15 units. It maintains the shape of the original graph and has the same maximum and minimum values. (That is, if the greatest value of y on
shifted to the left 15 units. It maintains the shape of the original graph and has the same maximum and minimum values. (That is, if the greatest value of y on ![]() is 10, then the greatest value of y on
is 10, then the greatest value of y on ![]() is also 10.)
is also 10.)
5. Zeroes, vertical lines of symmetry, and x coordinates of maximum and minimum values. The graph of ![]() is simply the graph of
is simply the graph of ![]() that has been “vertically stretched” by a factor of 6. Imagine drawing the graph of
that has been “vertically stretched” by a factor of 6. Imagine drawing the graph of ![]() on a rubber sheet and then attaching sticks across the top and bottom of the sheet and pulling the sheet until it”s six times as tall as it was originally. The stretched graph looks like
on a rubber sheet and then attaching sticks across the top and bottom of the sheet and pulling the sheet until it”s six times as tall as it was originally. The stretched graph looks like ![]() . Although most of the points move because of this stretch, the ones on the x-axis do not. These points, called the zeroes because their ycoordinates are 0, remain the same, as do any vertical lines of symmetry and the x coordinates of any maximum or minimum points.
. Although most of the points move because of this stretch, the ones on the x-axis do not. These points, called the zeroes because their ycoordinates are 0, remain the same, as do any vertical lines of symmetry and the x coordinates of any maximum or minimum points.
6. The graph of ![]() , since it is quadratic, looks like a parabola. If a is negative, the parabola is “open down.” (Remember that
, since it is quadratic, looks like a parabola. If a is negative, the parabola is “open down.” (Remember that ![]() is the graph of the “open up” parabola
is the graph of the “open up” parabola ![]() after it has been “flipped” over the x- axis.) Also, notice that c is the “y-intercept” of the graph, since
after it has been “flipped” over the x- axis.) Also, notice that c is the “y-intercept” of the graph, since ![]() . Therefore, the graph is an upside-down parabola with a positive y-intercept. The only choice that qualifies is (B).
. Therefore, the graph is an upside-down parabola with a positive y-intercept. The only choice that qualifies is (B).
7. The point on the d-axis represents the starting depth of the water. If the tank begins with twice as much water, the starting point, or “d-intercept,” must be twice that of the original graph. Also, if the water drains out at twice the rate, the line must be twice as steep. Since twice as much water drains out at twice the rate, the tank should empty in the same amount of time it took the original tank to drain. The only graph that depicts this situation is (A).
SAT Practice 3
1. D The transformation in (D) is a shift of the original function upward two units. This creates a triangular region above the x-axis with a greater height and base than those of the original graph, and therefore creates a greater overall area. The transformation in (A) will create a triangle with area 1/2 A, the transformations in (B) and (C) are horizontal shifts, and so will not change the area. The downward shift in (E) will reduce the height and base, and therefore the total area.
2. C The function h (x) is equivalent to the function g (x) after it has been reflected over the x-axis, vertically stretched by a factor of 3, and shifted downward one unit. After these transformations, the vertex of the parabola will be at (1, 5), so the maximum value is ![]() .
.
3. D Call the original point (a, b). Its reflection over the line ![]() is (b, a). (Draw a graph to see.) The reflection of this point over the x-axis is (b, -a), and the reflection of this point over the y-axis is (-b, -a). If the final point is (3, 4), then the original point was (–4, –3).
is (b, a). (Draw a graph to see.) The reflection of this point over the x-axis is (b, -a), and the reflection of this point over the y-axis is (-b, -a). If the final point is (3, 4), then the original point was (–4, –3).
4. A A point and its reflection over a line are both equidistant to that line. Imagine that point Q has a y coordinate of 4 (any value between 1 and 6 will do). This implies that point Q is two units from the line ![]() , and therefore, point P also must be two units from the line
, and therefore, point P also must be two units from the line ![]() and must have a y coordinate of 8. Point Q also must be three units from the line
and must have a y coordinate of 8. Point Q also must be three units from the line ![]() , so point R also must be three units from the line
, so point R also must be three units from the line ![]() and must have a y coordinate of –2. Therefore, the length of PR is
and must have a y coordinate of –2. Therefore, the length of PR is ![]() .
.
5. E You can determine the equation defining the function through substitution: ![]() , which describes an “open-down” parabola with vertex at (0,–1). Notice that this sequence of transformations takes the standard parabola
, which describes an “open-down” parabola with vertex at (0,–1). Notice that this sequence of transformations takes the standard parabola ![]() and shifts it up one unit and then reflects the new graph over the x- axis.
and shifts it up one unit and then reflects the new graph over the x- axis.