Lippincott’s Illustrated Reviews: Biochemistr, Sixth Edition (2014)
UNIT I: Protein Structure and Function
Chapter 5. Enzymes
I. OVERVIEW
Virtually all reactions in the body are mediated by enzymes, which are protein catalysts that increase the rate of reactions without being changed in the overall process. Among the many biologic reactions that are energetically possible, enzymes selectively channel reactants (called substrates) into useful pathways. Enzymes thus direct all metabolic events. This chapter examines the nature of these catalytic molecules and their mechanism of action.
II. NOMENCLATURE
Each enzyme is assigned two names. The first is its short, recommended name, convenient for everyday use. The second is the more complete systematic name, which is used when an enzyme must be identified without ambiguity.
A. Recommended name
Most commonly used enzyme names have the suffix “-ase” attached to the substrate of the reaction (for example, glucosidase and urease) or to a description of the action performed (for example, lactate dehydrogenase and adenylyl cyclase). [Note: Some enzymes retain their original trivial names, which give no hint of the associated enzymic reaction, for example, trypsin and pepsin.]
B. Systematic name
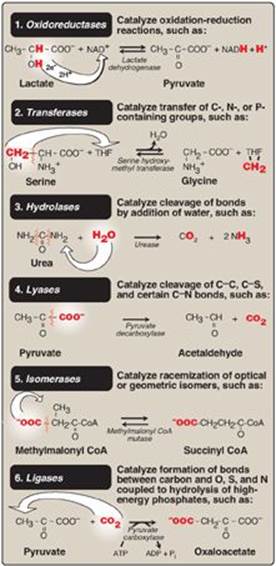
In the systematic naming system, enzymes are divided into six major classes (Figure 5.1), each with numerous subgroups. For a given enzyme, the suffix -ase is attached to a fairly complete description of the chemical reaction catalyzed, including the names of all the substrates, for example, lactate:NAD+ oxidoreductase. [Note: Each enzyme is also assigned a classification number. Lactate:NAD+ oxidoreductase, for example, is 1.1.1.27.] The systematic names are unambiguous and informative but are frequently too cumbersome to be of general use.
Figure 5.1 The six major classes of enzymes with examples. NAD(H) = nicotinamide adenine dinucleotide; THF = tetrahydrofolate; CoA = coenzyme A.
Potentially confusing enzyme nomenclature: synthetase (requires ATP), synthase (no ATP required); phosphatase (uses water to remove phosphoryl group), phosphorylase (uses Pi to break a bond and generate a phosphorylated product); dehydrogenase (NAD+/FAD is an electron acceptor in a redox reaction), oxidase (O2 is the acceptor, and oxygen atoms are not incorporated into substrate), oxygenase (one or both oxygen atoms are incorporated).
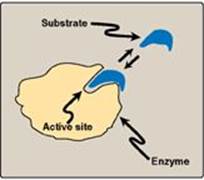
Figure 5.2 Schematic representation of an enzyme with one active site binding a substrate molecule.
III. PROPERTIES
Enzymes are protein catalysts that increase the velocity of a chemical reaction and are not consumed during the reaction. [Note: Some RNAs can act like enzymes, usually catalyzing the cleavage and synthesis of phosphodiester bonds. RNAs with catalytic activity are called ribozymes (see p. 439) and are much less commonly encountered than protein catalysts.]
A. Active sites
Enzyme molecules contain a special pocket or cleft called the active site. The active site, formed by folding of the protein, contains amino acid side chains that participate in substrate binding and catalysis (Figure 5.2). The substrate binds the enzyme, forming an enzyme–substrate (ES) complex. Binding is thought to cause a conformational change in the enzyme (induced fit model) that allows catalysis. ES is converted to an enzyme–product (EP) complex that subsequently dissociates to enzyme and product.
B. Catalytic efficiency
Enzyme-catalyzed reactions are highly efficient, proceeding from 103–108 times faster than uncatalyzed reactions. The number of molecules of substrate converted to product per enzyme molecule per second is called the turnover number, or kcat, and typically is 102–104s-1.
C. Specificity
Enzymes are highly specific, interacting with one or a few substrates and catalyzing only one type of chemical reaction. The set of enzymes made in a cell determines which reactions occur in that cell.
D. Holoenzymes, apoenzymes, cofactors, and coenzymes
Some enzymes require molecules other than proteins for enzymic activity. The term holoenzyme refers to the active enzyme with its nonprotein component, whereas the enzyme without its nonprotein moiety is termed an apoenzyme and is inactive. If the nonprotein moiety is a metal ion, such as Zn2+ or Fe2+, it is called a cofactor. If it is a small organic molecule, it is termed a coenzyme. Coenzymes that only transiently associate with the enzyme are called cosubstrates. Cosubstrates dissociate from the enzyme in an altered state (NAD+ is an example, see p. 101). If the coenzyme is permanently associated with the enzyme and returned to its original form, it is called a prosthetic group (FAD is an example, see p. 110). Coenzymes commonly are derived from vitamins. For example, NAD+ contains niacin, and FAD contains riboflavin (see Chapter 28).
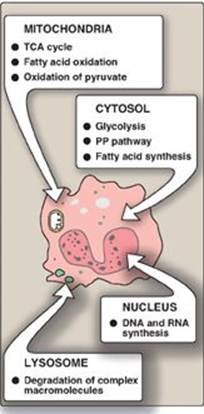
Figure 5.3 The intracellular location of some important biochemical pathways. TCA = tricarboxylic acid; PP = pentose phosphate.
E. Regulation
Enzyme activity can be regulated, that is, increased or decreased, so that the rate of product formation responds to cellular need.
F. Location within the cell
Many enzymes are localized in specific organelles within the cell (Figure 5.3). Such compartmentalization serves to isolate the reaction substrate or product from other competing reactions. This provides a favorable environment for the reaction and organizes the thousands of enzymes present in the cell into purposeful pathways.
IV. HOW ENZYMES WORK
The mechanism of enzyme action can be viewed from two different perspectives. The first treats catalysis in terms of energy changes that occur during the reaction. That is, enzymes provide an alternate, energetically favorable reaction pathway different from the uncatalyzed reaction. The second perspective describes how the active site chemically facilitates catalysis.
A. Energy changes occurring during the reaction
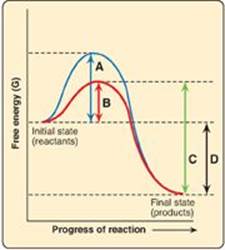
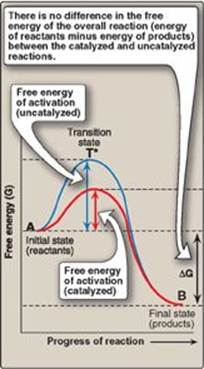
Virtually all chemical reactions have an energy barrier separating the reactants and the products. This barrier, called the free energy of activation, is the energy difference between that of the reactants and a high-energy intermediate that occurs during the formation of product. For example, Figure 5.4 shows the changes in energy during the conversion of a molecule of reactant A to product B as it proceeds through the transition state (high-energy intermediate), T*:
A ![]() T *
T * ![]() B
B
1. Free energy of activation: The peak of energy in Figure 5.4 is the difference in free energy between the reactant and T*, where the high-energy intermediate is formed during the conversion of reactant to product. Because of the high free energy of activation, the rates of uncatalyzed chemical reactions are often slow.
2. Rate of reaction: For molecules to react, they must contain sufficient energy to overcome the energy barrier of the transition state. In the absence of an enzyme, only a small proportion of a population of molecules may possess enough energy to achieve the transition state between reactant and product. The rate of reaction is determined by the number of such energized molecules. In general, the lower the free energy of activation, the more molecules have sufficient energy to pass through the transition state, and, therefore, the faster the rate of the reaction.
3. Alternate reaction pathway: An enzyme allows a reaction to proceed rapidly under conditions prevailing in the cell by providing an alternate reaction pathway with a lower free energy of activation (see Figure 5.4). The enzyme does not change the free energies of the reactants or products and, therefore, does not change the equilibrium of the reaction (see p. 70). It does, however, accelerate the rate by which equilibrium is reached.
Figure 5.4 Effect of an enzyme on the activation energy of a reaction.
B. Chemistry of the active site
The active site is not a passive receptacle for binding the substrate but, rather, is a complex molecular machine employing a diversity of chemical mechanisms to facilitate the conversion of substrate to product. A number of factors are responsible for the catalytic efficiency of enzymes, including the following examples.
1. Transition-state stabilization: The active site often acts as a flexible molecular template that binds the substrate and initiates its conversion to the transition state, a structure in which the bonds are not like those in the substrate or the product (see T* at the top of the curve in Figure 5.4). By stabilizing the transition state, the enzyme greatly increases the concentration of the reactive intermediate that can be converted to product and, thus, accelerates the reaction. [Note: The transition state cannot be isolated.]
2. Other mechanisms: The active site can provide catalytic groups that enhance the probability that the transition state is formed. In some enzymes, these groups can participate in general acid–base catalysis in which amino acid residues provide or accept protons. In other enzymes, catalysis may involve the transient formation of a covalent ES complex. [Note: The mechanism of action of chymotrypsin, an enzyme of protein digestion in the intestine, includes general base, general acid, and covalent catalysis. A histidine at the active site of the enzyme gains (general base) and loses (general acid) protons, mediated by the pK of histidine in proteins being close to physiologic pH. Serine at the active site forms a covalent link with the substrate.]
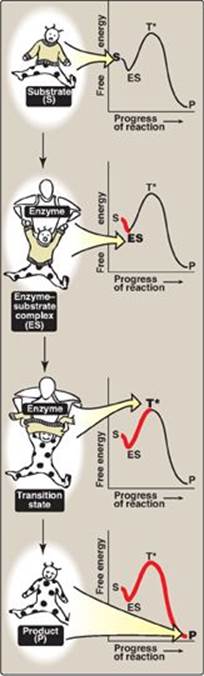
3. Visualization of the transition state: The enzyme-catalyzed conversion of substrate to product can be visualized as being similar to removing a sweater from an uncooperative infant (Figure 5.5). The process has a high energy of activation because the only reasonable strategy for removing the garment (short of ripping it off) requires that the random flailing of the baby results in both arms being fully extended over the head, an unlikely posture. However, we can envision a parent acting as an enzyme, first coming in contact with the baby (forming ES), then guiding the baby’s arms into an extended, vertical position, analogous to the ES transition state. This posture (conformation) of the baby facilitates the removal of the sweater, forming the disrobed baby, which here represents product. [Note: The substrate bound to the enzyme (ES) is at a slightly lower energy than unbound substrate (S) and explains the small “dip” in the curve at ES.]
Figure 5.5 Schematic representation of energy changes accompanying formation of an enzyme-substrate complex and subsequent formation of a transition state.
V. FACTORS AFFECTING REACTION VELOCITY
Enzymes can be isolated from cells and their properties studied in a test tube (that is, in vitro). Different enzymes show different responses to changes in substrate concentration, temperature, and pH. This section describes factors that influence the reaction velocity of enzymes. Enzymic responses to these factors give us valuable clues as to how enzymes function in living cells (that is, in vivo).
A. Substrate concentration
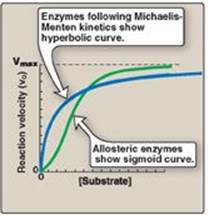
1. Maximal velocity: The rate or velocity of a reaction (v) is the number of substrate molecules converted to product per unit time. Velocity is usually expressed as µmol of product formed per minute. The rate of an enzyme-catalyzed reaction increases with substrate concentration until a maximal velocity (Vmax) is reached (Figure 5.6). The leveling off of the reaction rate at high substrate concentrations reflects the saturation with substrate of all available binding sites on the enzyme molecules present.
2. Hyperbolic shape of the enzyme kinetics curve: Most enzymes show Michaelis-Menten kinetics (see p. 58), in which the plot of initial reaction velocity (vo) against substrate concentration ([S]), is hyperbolic (similar in shape to that of the oxygen-dissociation curve of myoglobin, see p. 29). In contrast, allosteric enzymes do not follow Michaelis-Menton kinetics and show a sigmoidal curve (see p. 62) that is similar in shape to the oxygen-dissociation curve of hemoglobin (see p. 29).
Figure 5.6 Effect of substrate concentration on reaction velocity.
B. Temperature
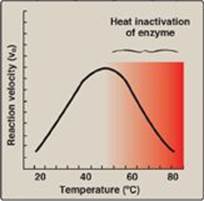
1. Increase of velocity with temperature: The reaction velocity increases with temperature until a peak velocity is reached (Figure 5.7). This increase is the result of the increased number of molecules having sufficient energy to pass over the energy barrier and form the products of the reaction.
2. Decrease of velocity with higher temperature: Further elevation of the temperature causes a decrease in reaction velocity as a result of temperature-induced denaturation of the enzyme (see Figure 5.7).
The optimum temperature for most human enzymes is between 35°C and 40°C. Human enzymes start to denature at temperatures above 40°C, but thermophilic bacteria found in the hot springs have optimum temperatures of 70°C.
Figure 5.7 Effect of temperature on an enzymecatalyzed reaction.
C. pH
1. Effect of pH on the ionization of the active site: The concentration of protons (H+) affects reaction velocity in several ways. First, the catalytic process usually requires that the enzyme and substrate have specific chemical groups in either an ionized or un-ionized state in order to interact. For example, catalytic activity may require that an amino group of the enzyme be in the protonated form (–NH3+). At alkaline pH, this group is deprotonated, and the rate of the reaction, therefore, declines.
2. Effect of pH on enzyme denaturation: Extremes of pH can also lead to denaturation of the enzyme, because the structure of the catalytically active protein molecule depends on the ionic character of the amino acid side chains.
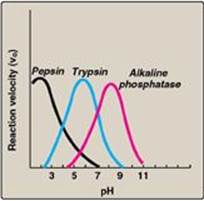
3. Variable pH optimum: The pH at which maximal enzyme activity is achieved is different for different enzymes and often reflects the [H+] at which the enzyme functions in the body. For example, pepsin, a digestive enzyme in the stomach, is maximally active at pH 2, whereas other enzymes, designed to work at neutral pH, are denatured by such an acidic environment (Figure 5.8).
Figure 5.8 Effect of pH on enzyme-catalyzed reactions.
VI. MICHAELIS-MENTEN KINETICS
A. Reaction model
Leonor Michaelis and Maude Menten proposed a simple model that accounts for most of the features of enzyme-catalyzed reactions. In this model, the enzyme reversibly combines with its substrate to form an ES complex that subsequently yields product, regenerating the free enzyme. The model, involving one substrate molecule, is represented below:
![]()
|
where |
S is the substrate |
|
|
E is the enzyme |
||
|
ES is the enzyme–substrate complex |
||
|
P is the product |
||
|
k1, k-1, and k2 are rate constants |
B. Michaelis-Menten equation
The Michaelis-Menten equation describes how reaction velocity varies with substrate concentration:
![]()
|
where |
Vo = initial reaction velocity |
|
|
Vmax = maximal velocity |
||
|
Km = Michaelis constant = (k-1 + k2)/k1 |
||
|
[S] = substrate concentration |
The following assumptions are made in deriving the Michaelis-Menten rate equation:
1. Relative concentrations of enzyme and substrate: The concentration of substrate ([S]) is much greater than the concentration of enzyme ([E]), so that the percentage of total substrate bound by the enzyme at any one time is small.
2. Steady-state assumption: [ES] does not change with time (the steady-state assumption), that is, the rate of formation of ES is equal to that of the breakdown of ES (to E + S and to E + P). In general, an intermediate in a series of reactions is said to be in steady state when its rate of synthesis is equal to its rate of degradation.
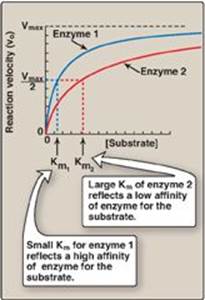
Figure 5.9 Effect of substrate concentration on reaction velocities for two enzymes: enzyme 1 with a small Michaelis constant (Km) and enzyme 2 with a large Km. Vmax = maximal velocity.
3. Initial velocity: Initial reaction velocities (vo) are used in the analysis of enzyme reactions. This means that the rate of the reaction is measured as soon as enzyme and substrate are mixed. At that time, the concentration of product is very small, and, therefore, the rate of the back reaction from product to substrate can be ignored.
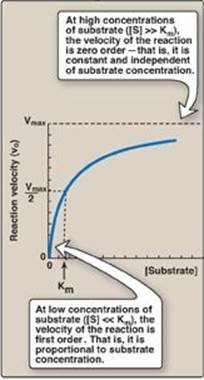
Figure 5.10 Effect of substrate concentration on reaction velocity for an enzymecatalyzed reaction. Vmax = maximal velocity; Km = Michaelis constant.
C. Important conclusions
1. Characteristics of Km: Km, the Michaelis constant, is characteristic of an enzyme and its particular substrate and reflects the affinity of the enzyme for that substrate. Km is numerically equal to the substrate concentration at which the reaction velocity is equal to 1⁄2Vmax. Km does not vary with enzyme concentration.
a. Small Km: A numerically small (low) Km reflects a high affinity of the enzyme for substrate, because a low concentration of substrate is needed to half-saturate the enzyme—that is, to reach a velocity that is 1⁄2Vmax(Figure 5.9).
b. Large Km: A numerically large (high) Km reflects a low affinity of enzyme for substrate because a high concentration of substrate is needed to half-saturate the enzyme.
2. Relationship of velocity to enzyme concentration: The rate of the reaction is directly proportional to the enzyme concentration at all substrate concentrations. For example, if the enzyme concentration is halved, the initial rate of the reaction (vo), as well as that of Vmax, are reduced to half that of the original.
3. Order of reaction: When [S] is much less than Km, the velocity of the reaction is approximately proportional to the substrate concentration (Figure 5.10). The rate of reaction is then said to be first order with respect to substrate. When [S] is much greater than Km, the velocity is constant and equal to Vmax. The rate of reaction is then independent of substrate concentration (the enzyme is saturated with substrate) and is said to be zero order with respect to substrate concentration (see Figure 5.10).
D. Lineweaver-Burk plot
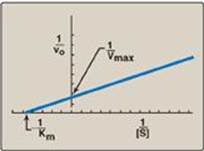
When vo is plotted against [S], it is not always possible to determine when Vmax has been achieved because of the gradual upward slope of the hyperbolic curve at high substrate concentrations. However, if 1/vo is plotted versus 1/[S], a straight line is obtained (Figure 5.11). This plot, the Lineweaver-Burk plot (also called a double-reciprocal plot) can be used to calculate Km and Vmax as well as to determine the mechanism of action of enzyme inhibitors.
1. The equation describing the Lineweaver-Burk plot is:
![]()
where the intercept on the x axis is equal to −1/Km, and the intercept on the y axis is equal to 1/Vmax. [Note: The slope = Km/Vmax.]
Figure 5.11 Lineweaver-Burk plot. vo = reaction velocity; Vmax = maximal velocity; Km = Michaelis constant; [S] = substrate concentration.
VII. INHIBITION OF ENZYME ACTIVITY
Any substance that can decrease the velocity of an enzyme-catalyzed reaction is called an inhibitor. Inhibitors can be reversible or irreversible. Irreversible inhibitors bind to enzymes through covalent bonds. Lead, for example, forms covalent bonds with the sulfhydryl side chain of cysteine in proteins. Ferrochelatase, an enzyme involved in heme synthesis (see p. 279), is irreversibly inhibited by lead. [Note: An important group of irreversible inhibitors are the mechanism-based inhibitors that are converted by the enzyme itself to a form that covalently links to the enzyme, thereby inhibiting it. They also are referred to as “suicide” inhibitors.] Reversible inhibitors bind to enzymes through noncovalent bonds and, thus, dilution of the enzyme–inhibitor complex results in dissociation of the reversibly bound inhibitor and recovery of enzyme activity. The two most commonly encountered types of reversible inhibition are competitive and noncompetitive.
A. Competitive inhibition
This type of inhibition occurs when the inhibitor binds reversibly to the same site that the substrate would normally occupy and, therefore, competes with the substrate for that site.
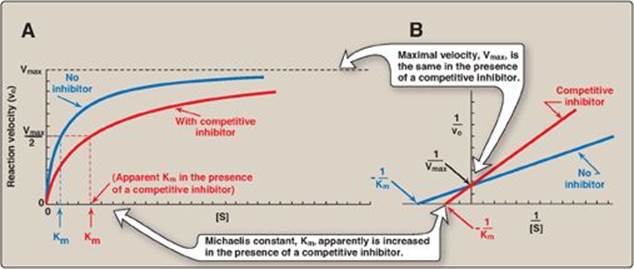
1. Effect on Vmax: The effect of a competitive inhibitor is reversed by increasing [S]. At a sufficiently high substrate concentration, the reaction velocity reaches the Vmax observed in the absence of inhibitor (Figure 5.12).
2. Effect on Km: A competitive inhibitor increases the apparent Km for a given substrate. This means that, in the presence of a competitive inhibitor, more substrate is needed to achieve 1⁄2Vmax.
3. Effect on the Lineweaver-Burk plot: Competitive inhibition shows a characteristic Lineweaver-Burk plot in which the plots of the inhibited and uninhibited reactions intersect on the y axis at 1/Vmax (Vmax is unchanged). The inhibited and uninhibited reactions show different x-axis intercepts, indicating that the apparent Km is increased in the presence of the competitive inhibitor because -1/Km moves closer to zero from a negative value (see Figure 5.12). [Note: An important group of competitive inhibitors are the transition state analogs, stable molecules that approximate the structure of the transition state and, therefore, bind the enzyme with a higher affinity than the substrate.]
Figure 5.12 A. Effect of a competitive inhibitor on the reaction velocity versus substrate ([S]) plot. B. Lineweaver-Burk plot of competitive inhibition of an enzyme.
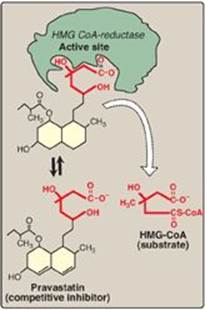
4. Statin drugs as examples of competitive inhibitors: This group of antihyperlipidemic agents competitively inhibits the rate-limiting (slowest) step in cholesterol biosynthesis. This reaction is catalyzed by hydroxymethylglutaryl–CoA reductase (HMG-CoA reductase, see p. 220). Statins, such as atorvastatin (Lipitor) and pravastatin (Pravachol), are structural analogs of the natural substrate for this enzyme and compete effectively to inhibit HMG-CoA reductase. By doing so, they inhibit de novo cholesterol synthesis, thereby lowering plasma cholesterol levels (Figure 5.13).
Figure 5.13 Pravastatin competes with HMGCoA for the active site of HMGCoA reductase. HMG-CoA = hydroxymethylglutaryl-coenzyme A.
B. Noncompetitive inhibition
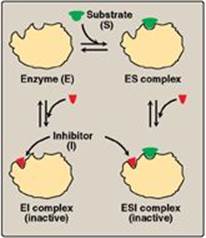
This type of inhibition is recognized by its characteristic effect on Vmax (Figure 5.14). Noncompetitive inhibition occurs when the inhibitor and substrate bind at different sites on the enzyme. The noncompetitive inhibitor can bind either free enzyme or the enzyme-substrate complex, thereby preventing the reaction from occurring (Figure 5.15).
1. Effect on Vmax: Noncompetitive inhibition cannot be overcome by increasing the concentration of substrate. Therefore, noncompetitive inhibitors decrease the apparent Vmax of the reaction.
2. Effect on Km: Noncompetitive inhibitors do not interfere with the binding of substrate to enzyme. Therefore, the enzyme shows the same Km in the presence or absence of the noncompetitive inhibitor.
Figure 5.14 A. Effect of a noncompetitive inhibitor on the reaction velocity versus substrate ([S]) plot. B. Lineweaver-Burk plot of noncompetitive inhibition of an enzyme.

3. Effect on Lineweaver-Burk plot: Noncompetitive inhibition is readily differentiated from competitive inhibition by plotting 1/vo versus 1/[S] and noting that the apparent Vmax decreases in the presence of a noncompetitive inhibitor, whereas Km is unchanged (see Figure 5.14). [Note: Oxypurinol, a metabolite of the drug allopurinol, is a noncompetitive inhibitor of xanthine oxidase, an enzyme of purine degradation (see p. 301).]
Figure 5.15 A noncompetitive inhibitor binding to both free enzyme and enzyme-substrate (ES) complex.
C. Enzyme inhibitors as drugs
At least half of the ten most commonly prescribed drugs in the United States act as enzyme inhibitors. For example, the widely prescribed β-lactam antibiotics, such as penicillin and amoxicillin, act by inhibiting enzymes involved in bacterial cell wall synthesis. Drugs may also act by inhibiting extracellular reactions. This is illustrated by angiotensin-converting enzyme (ACE) inhibitors. They lower blood pressure by blocking the enzyme that cleaves angiotensin I to form the potent vasoconstrictor, angiotensin II. These drugs, which include captopril, enalapril, and lisinopril, cause vasodilation and, therefore, a reduction in blood pressure. Aspirin, a nonprescription drug, irreversibly inhibits prostaglandin and thromboxane synthesis (see p. 214).
VIII. REGULATION OF ENZYME ACTIVITY
The regulation of the reaction velocity of enzymes is essential if an organism is to coordinate its numerous metabolic processes. The rates of most enzymes are responsive to changes in substrate concentration, because the intracellular level of many substrates is in the range of the Km. Thus, an increase in substrate concentration prompts an increase in reaction rate, which tends to return the concentration of substrate toward normal. In addition, some enzymes with specialized regulatory functions respond to allosteric effectors and/or covalent modification or they show altered rates of enzyme synthesis (or degradation) when physiologic conditions are changed.
A. Regulation of allosteric enzymes
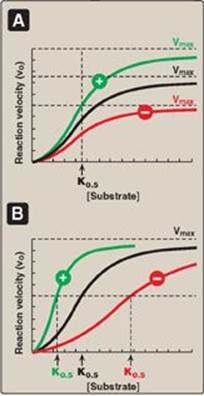
Allosteric enzymes are regulated by molecules called effectors that bind noncovalently at a site other than the active site. These enzymes are almost always composed of multiple subunits, and the regulatory (allosteric) site that binds the effector is distinct from the substrate-binding site and may be located on a subunit that is not itself catalytic. Effectors that inhibit enzyme activity are termed negative effectors, whereas those that increase enzyme activity are called positive effectors. Positive and negative effectors can affect the affinity of the enzyme for its substrate (K0.5), modify the maximal catalytic activity of the enzyme (Vmax), or both (Figure 5.16). [Note: Allosteric enzymes frequently catalyze the committed step early in a pathway.]
Figure 5.16 Effects of negative ![]() or
or ![]() positive effectors on an allosteric enzyme. A. Vmax is altered. B. The substrate concentration that gives half-maximal velocity (K0.5) is altered.
positive effectors on an allosteric enzyme. A. Vmax is altered. B. The substrate concentration that gives half-maximal velocity (K0.5) is altered.
1. Homotropic effectors: When the substrate itself serves as an effector, the effect is said to be homotropic. Most often, an allosteric substrate functions as a positive effector. In such a case, the presence of a substrate molecule at one site on the enzyme enhances the catalytic properties of the other substrate-binding sites. That is, their binding sites exhibit cooperativity. These enzymes show a sigmoidal curve when reaction velocity (vo) is plotted against substrate concentration ([S]), as shown in Figure 5.16. This contrasts with the hyperbolic curve characteristic of enzymes following Michaelis-Menten kinetics, as previously discussed. [Note: The concept of cooperativity of substrate binding is analogous to the binding of oxygen to hemoglobin (see p. 29).]
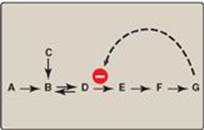
2. Heterotropic effectors: The effector may be different from the substrate, in which case the effect is said to be heterotropic. For example, consider the feedback inhibition shown in Figure 5.17. The enzyme that converts D to E has an allosteric site that binds the endproduct, G. If the concentration of G increases (for example, because it is not used as rapidly as it is synthesized), the first irreversible step unique to the pathway is typically inhibited. Feedback inhibition provides the cell with appropriate amounts of a product it needs by regulating the flow of substrate molecules through the pathway that synthesizes that product. Heterotropic effectors are commonly encountered. For example, the glycolytic enzyme phosphofructokinase-1 is allosterically inhibited by citrate, which is not a substrate for the enzyme (see p. 99).
Figure 5.17 Feedback inhibition of a metabolic pathway.
B. Regulation of enzymes by covalent modification
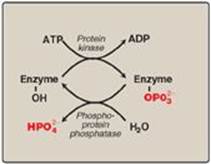
Many enzymes are regulated by covalent modification, most often by the addition or removal of phosphate groups from specific serine, threonine, or tyrosine residues of the enzyme. Protein phosphorylation is recognized as one of the primary ways in which cellular processes are regulated. [Note: Protein phosphorylation is mediated by hormonal signals (see p. 132).]
1. Phosphorylation and dephosphorylation: Phosphorylation reactions are catalyzed by a family of enzymes called protein kinases that use ATP as the phosphate donor. Phosphate groups are cleaved from phosphorylated enzymes by the action of phosphoprotein phosphatases (Figure 5.18).
2. Response of enzyme to phosphorylation: Depending on the specific enzyme, the phosphorylated form may be more or less active than the unphosphorylated enzyme. For example, phosphorylation of glycogen phosphorylase(an enzyme that degrades glycogen) increases activity, whereas phosphorylation of glycogen synthase (an enzyme that synthesizes glycogen) decreases activity (p. 132).
Figure 5.18 Covalent modification by the addition and removal of phosphate groups. [Note: HPO42− may be represented as Pi.]
C. Induction and repression of enzyme synthesis
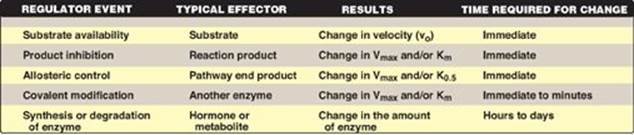
The regulatory mechanisms described above modify the activity of existing enzyme molecules. However, cells can also regulate the amount of enzyme present by altering the rate of enzyme degradation or, more typically, the rate of enzyme synthesis. The increase (induction) or decrease (repression) of enzyme synthesis leads to an alteration in the total population of active sites. Enzymes subject to regulation of synthesis are often those that are needed at only one stage of development or under selected physiologic conditions. For example, elevated levels of insulin as a result of high blood glucose levels cause an increase in the synthesis of key enzymes involved in glucose metabolism (see p. 105). In contrast, enzymes that are in constant use are usually not regulated by altering the rate of enzyme synthesis. Alterations in enzyme levels as a result of induction or repression of protein synthesis are slow (hours to days), compared with allosterically or covalently regulated changes in enzyme activity, which occur in seconds to minutes. Figure 5.19 summarizes the common ways that enzyme activity is regulated.
Figure 5.19 Mechanisms for regulating enzyme activity. [Note: Inhibition by pathway end product is also referred to as feedback inhibition.]
IX. ENZYMES IN CLINICAL DIAGNOSIS
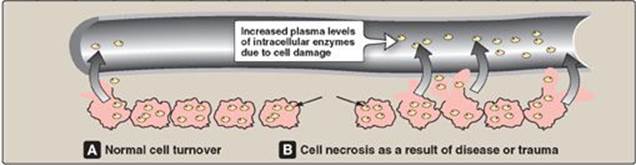
Plasma enzymes can be classified into two major groups. First, a relatively small group of enzymes are actively secreted into the blood by certain cell types. For example, the liver secretes zymogens (inactive precursors) of the enzymes involved in blood coagulation. Second, a large number of enzyme species are released from cells during normal cell turnover. These enzymes almost always function intracellularly and have no physiologic use in the plasma. In healthy individuals, the levels of these enzymes are fairly constant and represent a steady state in which the rate of release from damaged cells into the plasma is balanced by an equal rate of removal from the plasma. Increased plasma levels of these enzymes may indicate tissue damage (Figure 5.20).
Figure 5.20 Release of enzymes from normal and diseased or traumatized cells.
Plasma is the fluid, noncellular part of blood. Laboratory assays of enzyme activity most often use serum, which is obtained by centrifugation of whole blood after it has been allowed to coagulate. Plasma is a physiologic fluid, whereas serum is prepared in the laboratory.
A. Alteration of plasma enzyme levels in disease states
Many diseases that cause tissue damage result in an increased release of intracellular enzymes into the plasma. The activities of many of these enzymes are routinely determined for diagnostic purposes in diseases of the heart, liver, skeletal muscle, and other tissues. The level of specific enzyme activity in the plasma frequently correlates with the extent of tissue damage. Therefore, determining the degree of elevation of a particular enzyme activity in the plasma is often useful in evaluating the prognosis for the patient.
B. Plasma enzymes as diagnostic tools
Some enzymes show relatively high activity in only one or a few tissues. The presence of increased levels of these enzymes in plasma thus reflects damage to the corresponding tissue. For example, the enzyme alanine aminotransferase ([ALT] see p. 251) is abundant in the liver. The appearance of elevated levels of ALT in plasma signals possible damage to hepatic tissue. [Note: Measurement of ALT is part of the liver function test panel.] Increases in plasma levels of enzymes with a wide tissue distribution provide a less specific indication of the site of cellular injury and limits their diagnostic value.
C. Isoenzymes and diseases of the heart
Isoenzymes (also called isozymes) are enzymes that catalyze the same reaction. However, they do not necessarily have the same physical properties because of genetically determined differences in amino acid sequence. For this reason, isoenzymes may contain different numbers of charged amino acids and may, therefore, be separated from each other by electrophoresis (Figure 5.21). Different organs commonly contain characteristic proportions of different isoenzymes. The pattern of isoenzymes found in the plasma may, therefore, serve as a means of identifying the site of tissue damage. For example, the plasma levels of creatine kinase (CK) are commonly determined in the diagnosis of myocardial infarction. They are particularly useful when the electrocardiogram is difficult to interpret such as when there have been previous episodes of heart disease.
Figure 5.21 Subunit composition, electrophoretic mobility, and enzyme activity of creatine kinase (CK) isoenzymes.
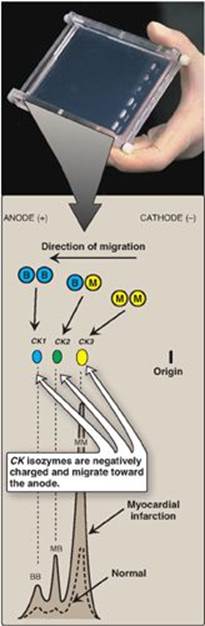
1. Quaternary structure of isoenzymes: Many isoenzymes contain different subunits in various combinations. For example, CK occurs as three isoenzymes. Each isoenzyme is a dimer composed of two polypeptides (called B and M subunits) associated in one of three combinations: CK1 = BB, CK2 = MB, and CK3 = MM. Each CK isoenzyme shows a characteristic electrophoretic mobility (see Figure 5.21). [Note: Virtually all CK in the brain is the BB isoform, whereas in skeletal muscle it is MM. In cardiac muscle, about one third is MB with the rest as MM.]
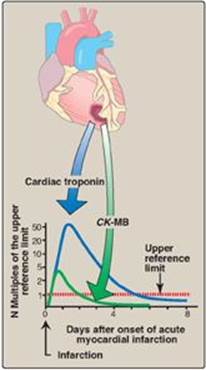
2. Diagnosis of myocardial infarction: Measurement of blood levels of proteins with cardiac specificity (biomarkers) is used in the diagnosis of myocardial infarction (MI). Myocardial muscle is the only tissue that contains more than 5% of the total CK activity as the CK2 (MB) isoenzyme. Appearance of this hybrid isoenzyme in plasma is virtually specific for infarction of the myocardium. Following an acute MI, CK2 appears approximately 4–8 hours following onset of chest pain, reaches a peak of activity at approximately 24 hours, and returns to baseline after 48–72 hours (Figure 5.22). Troponin T and troponin I are regulatory proteins involved in myocardial contractility. They, too, are released into the plasma in response to cardiac damage. Cardiac troponin I (cTnI) is highly sensitive and specific for damage to cardiac tissue. cTnI appears in plasma within 4–6 hours after an MI, peaks in 8–28 hours, and remains elevated for 3–10 days. Elevated cTns, in combination with the clinical presentation and characteristic changes in the electrocardiogram, are currently considered the “gold standard” in the diagnosis of a MI.
Figure 5.22 Appearance of creatine kinase isozyme CK-MB and cardiac troponin in plasma after a myocardial infarction.
X. CHAPTER SUMMARY
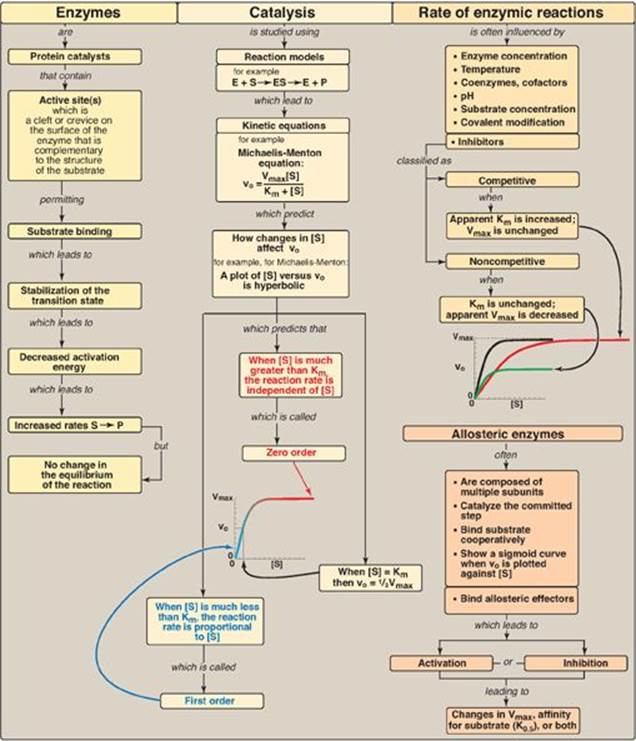
Enzymes are protein catalysts that increase the velocity of a chemical reaction by lowering the energy of the transition state (Figure 5.23). Enzymes are not consumed during the reaction they catalyze. Enzyme molecules contain a special pocket or cleft called the active site. The active site contains amino acid side chains that participate in substrate binding and catalysis. The active site binds the substrate, forming an enzyme–substrate (ES)complex. Binding is thought to cause a conformational change in the enzyme (induced fit) that allows catalysis. ES is converted to enzyme-product (EP), which subsequently dissociates to enzyme and product. An enzyme allows a reaction to proceed rapidly under conditions prevailing in the cell by providing an alternate reaction pathway with a lower free energy of activation. The enzyme does not change the free energies of the reactants or products and, therefore, does not change the equilibrium of the reaction. Most enzymes show Michaelis-Menten kinetics, and a plot of the initial reaction velocity (vo) against substrate concentration ([S]) has a hyperbolicshape similar to the oxygen-dissociation curve of myoglobin. Any substance that can diminish the velocity of such enzyme-catalyzed reactions is called an inhibitor. The two most commonly encountered types of reversible inhibition are competitive (which increases the apparent Km) and noncompetitive (which decreases the apparent Vmax). In contrast, the multisubunit allosteric enzymes frequently show a sigmoidal curve similar in shape to the oxygen-dissociation curve of hemoglobin. They typically catalyze the rate-limiting (slowest step) of a pathway. Allosteric enzymes are regulated by molecules called effectors that bind noncovalently at a site other than the active site. Effectors can be either positive (accelerate the enzyme-catalyzed reaction) or negative (slow down the reaction). An allosteric effector can alter the affinity of the enzyme for its substrate, modify the maximal catalytic activity of the enzyme, or both. Enzymes can also be regulated by covalent modification and by changes in the rate of synthesis or degradation. Enzymes have diagnostic and therapeutic value in medicine.
Figure 5.23 Key concept map for the enzymes. S = substrate; [S] = substrate concentration; P = product; E = enzyme; vo = initial velocity; Vmax = maximal velocity; Km = Michaelis constant; K0.5 = substrate concentration which gives half maximal velocity.
Study Questions
Choose the ONE best answer.
5.1 In cases of ethylene glycol poisoning and its characteristic metabolic acidosis, treatment involves correction of the acidosis, removal of any remaining ethylene glycol, and administration of an inhibitor of alcohol dehydrogenase (ADH), the enzyme that oxidizes ethylene glycol to the organic acids that cause the acidosis. Ethanol (grain alcohol) frequently is the inhibitor given to treat ethylene glycol poisoning. Results of experiments using ADH with and without ethanol are shown to the right. Based on these data, what type of inhibition is caused by the ethanol?
A. Competitive
B. Feedback
C. Irreversible
D. Noncompetitive
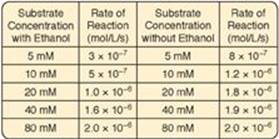
Correct answer = A competitive inhibitor increases the apparent Km for a given substrate. This means that, in the presence of a competitive inhibitor, more substrate is needed to achieve 1⁄2 Vmax. The effect of a competitive inhibitor is reversed by increasing substrate concentration ([S]). At a sufficiently high [S], the reaction velocity reaches the Vmax observed in the absence of inhibitor.
5.2 ADH requires oxidized nicotinamide adenine dinucleotide (NAD+) for catalytic activity. In the reaction catalyzed by ADH, an alcohol is oxidized to an aldehyde as NAD+ is reduced to NADH and dissociates from the enzyme. The NAD+ is functioning as a (an):
A. apoenzyme.
B. coenzyme-cosubstrate.
C. coenzyme-prosthetic group.
D. cofactor.
E. heterotropic effector.
For Questions 5.3 and 5.4, use the graph below which shows the changes in free energy when a reactant is converted to a product in the presence and absence of an enzyme. Select the letter that best represents:
Correct answer = B. Coenzymes-cosubstrates are small organic molecules that associate transiently with an enzyme and leave the enzyme in a changed form. Coenzyme-prosthetic groups are small organic molecules that associate permanently with an enzyme and are returned to their original form on the enzyme. Cofactors are metal ions. Heterotropic effectors are not substrates.
5.3 The free energy of activation of the catalyzed forward reaction.
Correct answers = B; D. Enzymes (biocatalysts) provide an alternate reaction pathway with a lower free energy of activation. However, they do not change the free energy of the reactant or product. A is the free energy of the uncatalyzed reaction. C is the free energy of the catalyzed reverse reaction.
5.4 The free energy of the reaction.