Liquid-State Physical Chemistry: Fundamentals, Modeling, and Applications (2013)
16. Some Special Topics: Phase Transitions
16.2. Discontinuous Transitions
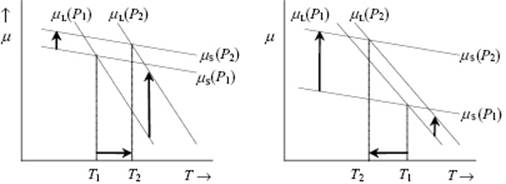
The most important discontinuous phase transitions for liquids are melting (fusion) and evaporation. For equilibrium between phases their chemical potential μ should be equal, otherwise transfer of matter occurs until dG = (μ2 − μ1)dn = 0 is fulfilled. If we consider that each phase has its own Gibbs energy function, the crossover temperatures between solid and liquid and liquid and vapor determine the melting and boiling temperatures, respectively. The effect of pressure is illustrated in Figure 16.5; this shows that, upon increasing the pressure, the melting point rises if the molar volume of the solid Vm(s) < the molar volume of the liquid Vm(l), while the melting point decreases if Vm(s) > Vm(l).
Figure 16.5 The dependency of melting point on pressure. (a) Vm(S) < Vm(L) leading to melting point rising (T2 > T1); (b) Vm(S) > Vm(L), leading to melting point lowering (T2 < T1).
The coexistence curves for two phases in the P–T plane (Figure 16.2a) can be obtained from the Clapeyron equation, which follows from ΔG = ΔH − TΔS = 0 with the Maxwell relation
(16.12) ![]()
When liquid and vapor are both present in equilibrium we have GL = GV. Hence, on the one hand, we have (Figure 16.2b), since G = F + PV, the relation Fa − Fe = −P(Va − Ve). On the other hand, the work required to go from vapor to liquid is ![]() . From this we conclude that the (gray) area (Figure 16.2b) described by the curve abc must equal the (gray) area described by the curve cde. Hence, phase equilibrium is determined by the horizontal line for which these two areas are equal5). This is Maxwell's equal area rule. From a stability point of view, for the range abcde we have global instability (binodal), while for the range bcd we have local instability (spinodal).
. From this we conclude that the (gray) area (Figure 16.2b) described by the curve abc must equal the (gray) area described by the curve cde. Hence, phase equilibrium is determined by the horizontal line for which these two areas are equal5). This is Maxwell's equal area rule. From a stability point of view, for the range abcde we have global instability (binodal), while for the range bcd we have local instability (spinodal).
16.2.1 Evaporation
We note that with a transition from the liquid to gas state the volume changes and the evaporation enthalpy is involved, the latter largely determining the vapor pressure. We denote the evaporation enthalpy, normally indicated by ΔvapH, here for brevity by L so that Kirchhoff's equation reads
(16.13) ![]()
We can write for the volume change ΔV = RTΔZ/P, where Z is the compression factor Z = PV/RT and thus ΔZ represents the compression factor change upon vaporization. This results in
(16.14) ![]()
The Clausius–Clapeyron equation results if the gas behaves perfectly (hence ΔZ = 1). Applying this equation and integrating we obtain from Eq. (16.13)
(16.15) ![]()
Assuming that ΔCP = ΔCP,0[1 − (T/Tcri)], the result is (Problem 16.5)
(16.16) ![]()
(16.17) ![]()
with a and b positive constants. The last step can be made if ΔCP = ΔCP,0, that is, the temperature dependence of ΔCP can be neglected. In this approximation evaporation enthalpy is thus L = L0 + ΔCP,0T. The experimental vapor pressure indeed can be described within at least less than 2% between boiling and melting point by
(16.18) ![]()
where a, b and c are constants6). Evaluating the vaporization enthalpy L via Eq. (16.14) leads to
(16.19) ![]()
(16.20) ![]()
Values for a, b and c for several liquids are given in Appendix E. One step further is to assume that ΔCP,0 = 0; that is, L is constant, resulting in log P = a − b log T. As this expression obviously can only describe P over a limited temperature range, one often uses the empirical Antoine equation [1] reading
(16.21) ![]()
For a series of molecules the values for L0 and b vary systematically with structure. Analyzing the data one obtains for aliphatic hydrocarbons
(16.22) ![]()
where n denotes the number of carbon atoms and the estimate is in kcal mol−1. For aliphatic alcohols, similarly,
(16.23) ![]()
These types of estimate can be used to estimate unknown data. For example, by estimating data for C12H26 at 400 K and C18H38 at 500 K we obtain 12.0 kcal mol−1 and 15.3 kcal mol−1, to be compared with the experimental data of 12.3 ± 1.3 kcal mol−1 and 15.3 ± 0.7 kcal mol−1, respectively.
Empirically, the evaporation enthalpy L is often described by Trouton's rule
(16.24) ![]()
where the subscript n indicates the normal boiling temperature (at 1 atm). The correlation is not particularly accurate in general (see Appendix E). Compounds that form dimers in the liquid state have a large Trouton constant, for example, NO with C = 13.7. Furthermore, compounds that form dimers in the gaseous state have a small Trouton constant, for example, CH3COOH with C = 7.5 and HF with C = 3.1. Other differences are less easily rationalized. A much more accurate rule is Hildebrand's rule, which states that L divided by the vaporization temperature Tvap for all liquids is the same when vaporization is achieved at a temperature where the vapor density is the same. The value of L/Tvap = 93 J K−1 mol−1 when the vapor density is taken as 2.02 × 10⁻² mol l−1. Both, the Trouton and the Hildebrand rule are typical examples of empirical estimators for thermodynamic data.
16.2.2 Melting
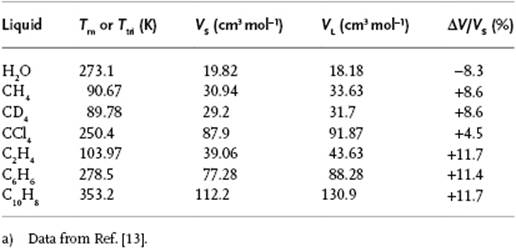
As has been alluded to several times before, the molar volume increases upon melting, and Table 16.1 provides some typical data. A simple argument [2] indicates the reason why. Consider an arbitrary plane in the liquid. For such a plane the arrangement of molecules must be such as to allow them to pass to another plane while still being in contact with (a number of) neighbors. If we take a close-packed configuration for this plane, the molecule is sixfold coordinated in this plane and the molecular area is ![]() , where σ is the diameter of the molecule. It is not unreasonable then to suppose that the volume available to the molecule in the liquid is
, where σ is the diameter of the molecule. It is not unreasonable then to suppose that the volume available to the molecule in the liquid is ![]() . If we compare vL with the volume available in the BCC lattice, vBCC = 223−3/2σ3, we obtain vL/vBCC = 1.05, in good correspondence with the value for CCl4 (Table 16.1). Similarly, for the FCC structure vFCC = 2−1/2σ3 we obtain vL/vFCC = 1.14, which is in good correspondence with the value for inert gases (indeed, crystallizing in the FCC or HCP structure).
. If we compare vL with the volume available in the BCC lattice, vBCC = 223−3/2σ3, we obtain vL/vBCC = 1.05, in good correspondence with the value for CCl4 (Table 16.1). Similarly, for the FCC structure vFCC = 2−1/2σ3 we obtain vL/vFCC = 1.14, which is in good correspondence with the value for inert gases (indeed, crystallizing in the FCC or HCP structure).
Table 16.1 Molar volumes at the melting point.a)
Problem 16.4
Derive the Clapeyron equation from μliq = μvap at the coexistence curve.
Problem 16.5
Verify Eq. (16.17).