Biology Premium, 2024: 5 Practice Tests + Comprehensive Review + Online Practice - Wuerth M. 2023
Lab Review
24 Labs
Learning Objectives
In this chapter, you will learn:
➜13 Common Lab Experiments that Cover All Units of AP Biology
Overview
The AP Biology course is designed to help you develop skills in six core science practices:
1.Explaining biological concepts
2.Analyzing visual representations
3.Asking questions and designing experiments to test those questions
4.Representing and accurately describing data
5.Using statistical tests to analyze data
6.Using evidence to develop arguments that support or reject claims and hypotheses
These core science practices are woven throughout the course content and throughout the course labs. Designing an experiment and analyzing the experimental data are key skills assessed on the AP Biology exam.
On Section II of the exam, each of the long free-response questions (#1 and #2) likely involve analyses of lab experiments. Question 1 may assess your ability to interpret and evaluate experimental results. You might be required to describe and explain a biological process or model and identify design procedures from the experiment. You might also need to analyze data and make and justify predictions. Question 2 may ask you to construct a graph of experimental results using confidence intervals or error bars. You might again need to show that you can analyze the data and predict what could happen based on the data provided. One of the four short free-response questions might also revolve around a lab investigation, requiring you to describe the biological concept that is being illustrated by the experiment, identify the controls or variables, predict the results of the investigation, and justify your predictions.
The more opportunities you have to practice these skills, the better prepared you will be for the AP Biology exam. At least eight inquiry-based lab experiences are required in AP Biology, but no specific labs are required for the AP Biology course. This chapter describes the 13 common labs that you should be familiar with.
These labs are not requirements for the course, so do not worry if your teacher did not go over these specific labs. Questions about the specifics of these procedures are not typically tested on the AP Biology exam. The science practice skills you develop when you complete lab experiments are what will help you succeed on the AP Biology exam.
The skills assessed by these labs are skills you should practice before you take the AP Biology exam. At the end of the AP Biology course, you should be able to do the following:
§ Identify the key components of an experimental design (controls, independent variable(s), dependent variable(s), etc.)
§ Describe how to collect data
§ Graph data appropriately with 95% confidence intervals
§ Use data to develop conclusions
§ Apply conclusions to larger biological concepts
§ Predict how changes to an experiment may affect the results
§ Justify your predictions
Lab 1: Artificial Selection
One of the key driving forces in evolution is selection. Natural selection is the process by which organisms that are better adapted to their environment survive and reproduce at a greater rate. In artificial selection, humans choose organisms with desirable traits, and only these organisms are allowed to survive and reproduce.
While many different organisms can be used to study artificial selection, Fast Plants (Brassica rapa) are an ideal model organism for studying evolution in the classroom because they are easy to grow and have a short generation time (about 40 days). Also, since Fast Plants do not self-pollinate, the experimenter can control which plants pollinate each other to produce offspring, which allows for artificial selection. In this experiment, the expression of a quantifiable trait in a parental generation and in the F1 generation is compared after artificial selection.
Any quantifiable trait can be used in this experiment. One of the most common traits used is the number of trichomes on plant leaves. Trichomes are short, hairlike appendages on the margins, or edges, of the leaves. Trichomes deter predation of the plant by herbivores. The number of trichomes per leaf can vary greatly in a population of Fast Plants, as shown in Figure 24.1.
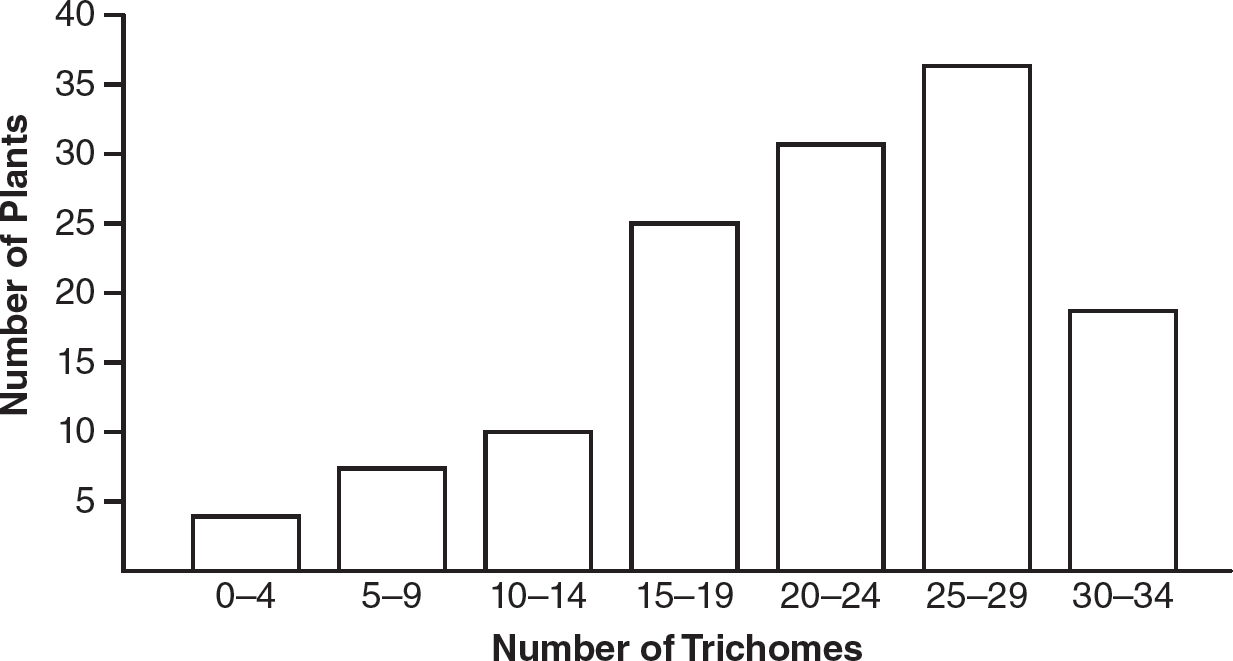
Figure 24.1 Number of Trichomes per Leaf
Imagine that a class decides to artificially select for plants with the most trichomes. Fast Plants are grown from stock seeds (parental generation), which reflect normal variation in the population. At day 11 of the plants’ life cycle, the students count the number of trichomes per leaf. The students record this data and use a spreadsheet to calculate the mean and the standard error of the mean of the data. When the plants flower, students cross-pollinate only the plants that ranked in the top 10% of the number of trichomes per leaf measurement that was taken on day 11. These plants then develop seeds, and the seeds are harvested. These seeds are planted (to create the F1 generation) and grown to day 11 of their life cycle, at which time the students count the number of trichomes per leaf. The students record this data in a spreadsheet, which calculates the mean and the standard error of the mean of the data set. The number of trichomes per leaf on day 11 from both the parental generation and the F1 generation are plotted on a bar graph, which includes 95% confidence intervals, as shown in Figure 24.2.
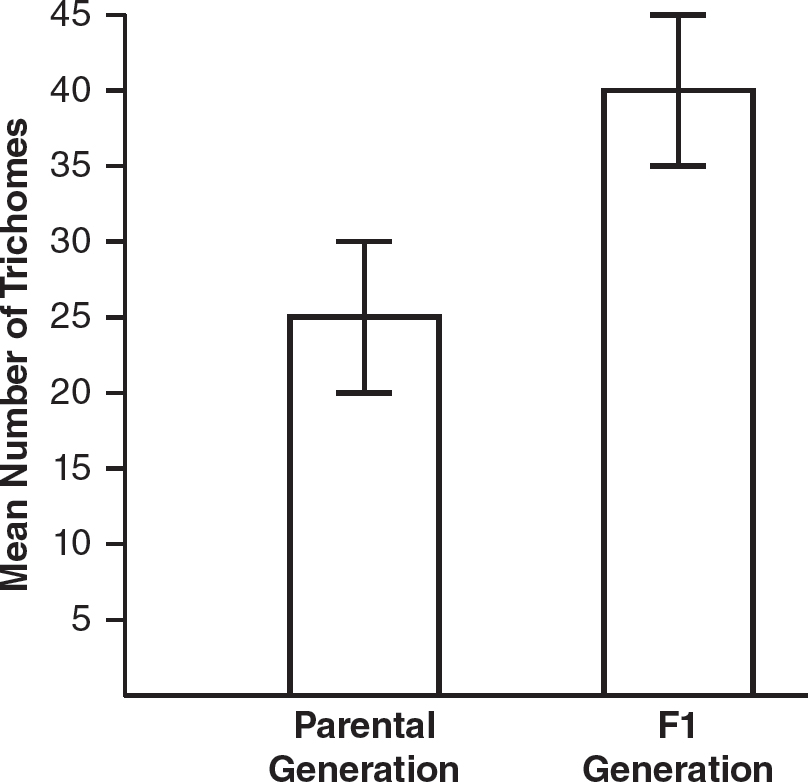
Figure 24.2 Mean Number of Trichomes in Parental and F1 Generations
If the 95% confidence intervals of the parental generation and the F1 generation do not overlap, it is likely there is a statistically significant difference in the number of trichomes per leaf between the parental and F1 generations. If the 95% confidence intervals do overlap, the data are inconclusive, and it is not possible to say whether or not there is a statistically significant difference between the two groups.
Lab 2: Hardy-Weinberg
If the allele frequencies in a population are changing, the population is likely evolving. Evolution can be studied in a population by using mathematical models or computer simulations to observe changing allele frequencies in populations.
Hardy-Weinberg equilibrium and the Hardy-Weinberg equations describe the characteristics of a population that is not evolving and has stable allele frequencies. A population is in Hardy-Weinberg equilibrium if the following five conditions are met:
1.Large population size
2.Random mating
3.No gene flow
4.No selection of any kind
5.No mutations
If a population is in Hardy-Weinberg equilibrium, the following equations apply:
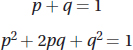
where p represents the frequency of the dominant allele in the gene pool of the population and q represents the frequency of the recessive allele in the population. p2 represents the frequency of the homozygous dominant genotype, 2pq represents the frequency of the heterozygous genotype, and q2 represents the frequency of the homozygous recessive genotype.
One way to study Hardy-Weinberg equilibrium is to build a spreadsheet to model how a gene pool would change in a hypothetical population from one generation to the next. Another way to study this would be to use one of the widely available computer simulations online. Adjusting the parameters of a spreadsheet or online simulation allows for the exploration of the effects of selection, mutation, migration, genetic drift, or heterozygote advantage on allele frequencies in the gene pool of a population.
Lab 3: BLAST
Bioinformatics uses the power of computer science and statistics to analyze biological data. One of many bioinformatics tools available is BLAST—Basic Local Alignment Search Tool. BLAST compares molecular data on DNA and amino acid sequences to a large databank of sequences at the National Institutes of Health (NIH). The BLAST algorithm can compare any DNA or amino acid sequence to millions of sequences in the databank in just a few seconds. This can give scientists valuable information about the functions of similar genes. For example, if a DNA sequence of a newly identified gene has a high degree of homology with a mouse gene that is involved in cell signaling, this could indicate that the newly identified gene may have a function in cell signaling.
Species with a more recent common ancestor will share a greater degree of homology in their genes. Using BLAST to compare genes shared by different species can help scientists determine degree of relatedness and construct phylogenetic trees. Fewer nucleotide differences between species indicate a more recent common ancestor. For example, compare a short DNA sequence from four organisms, as shown in the following table.
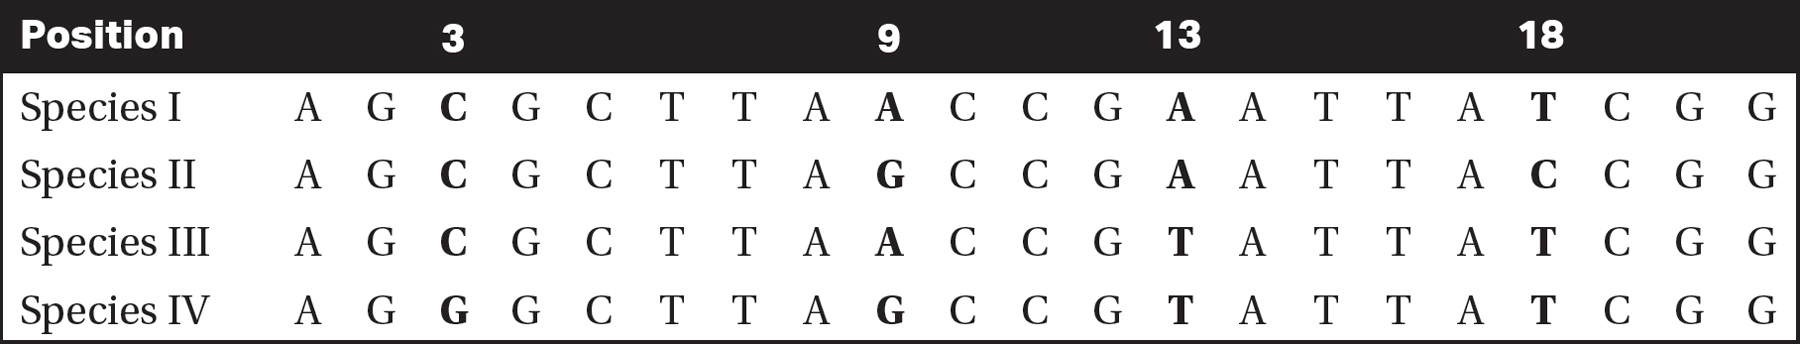
Comparing these sequences shows that species I and II have two nucleotide differences, species I and III have one nucleotide difference, and species I and IV have three nucleotide differences. A possible phylogenetic tree based on this data might look like Figure 24.3.
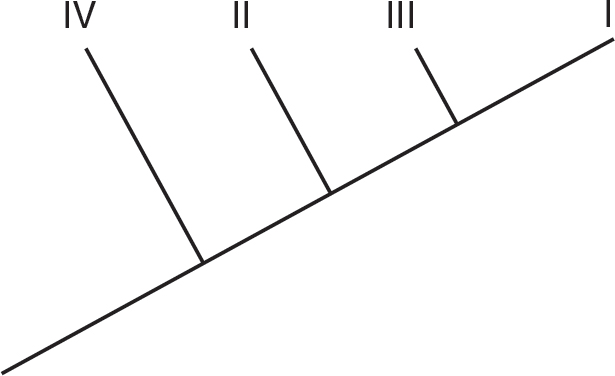
Figure 24.3 Phylogenetic Tree for Species I, II, III, and IV
In this lab, you might first be asked to develop a hypothesis about the placement of a fossil on a phylogenetic tree based on its morphology. Then four DNA sequences (like the ones in the table above) that are isolated from a fossil are uploaded to BLAST to determine which species have DNA with the greatest degree of homology to the DNA sequences isolated from the fossil. This additional molecular data is then used to evaluate the original hypothesis about the placement of the fossil on the phylogenetic tree, and if supported by this molecular data, revisions to the hypothesis are made.
Lab 4: Diffusion and Osmosis
Just as a ball on a hill will move from an area of higher potential energy to an area of lower potential energy, water will move from an area of higher water potential to an area of lower water potential. Water potential can be defined as the potential energy of water in a solution or the ability of water to do work. The more water there is in a solution, the higher its water potential will be. The less water there is in a solution, the lower its water potential will be. Water potential measures the tendency of water to move from one place to another. Water potential is a result of the effects of both pressure potential (ψp) and solute potential (ψs), as shown in the following equation:
![]()
Most living systems are open to the atmosphere and are in pressure equilibrium with their environment. In these cases, the pressure potential is zero, and the total water potential is due solely to the solute potential.
As solute is added to a solution, the relative amount of water in the solution decreases. As the amount of solute in a solution increases, the solute potential, and consequently the total water potential, decreases. Further details on how solute potential is calculated are discussed in Chapter 6.
This investigation can be divided into multiple parts, as in the following scenario.
Part 1: Artificial cells are made from agar or gelatin cubes impregnated with an indicator dye that can be used to track the movement of a solution into the artificial cell. Cubes of three different sizes, with three different surface area to volume ratios, are used, as described in the table.
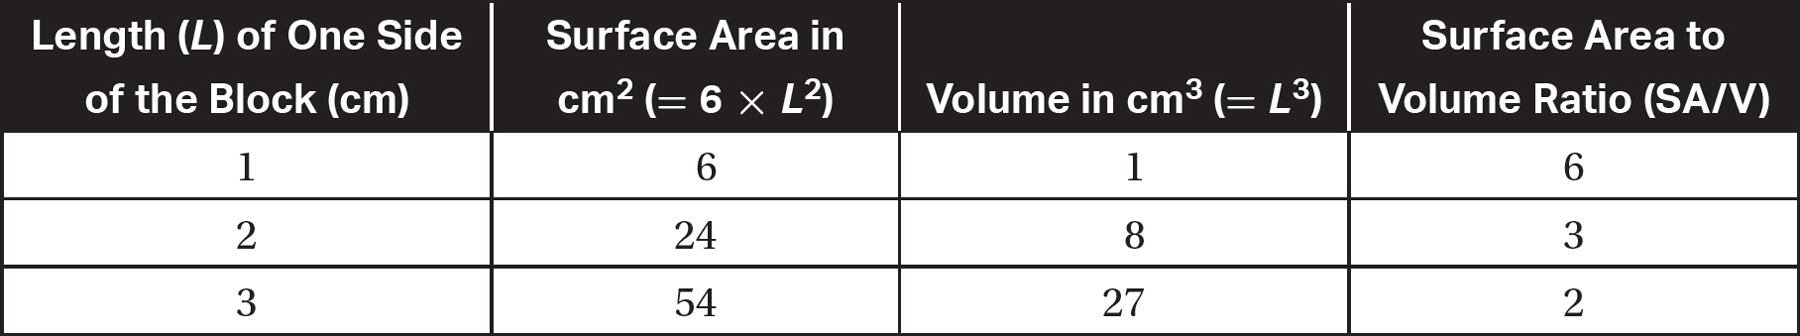
The cubes are placed into a solution, and the dye in the cubes is used to track the movement of the solution into the cells. This part of the lab demonstrates that smaller cells, with their higher surface area to volume ratios, are more efficient at taking in materials from their environment.
Part 2: In this part of the investigation, dialysis tubing is used as a model for the semipermeable cell membrane. A solution of glucose and starch is placed into dialysis tubing and is tied off at both ends to create a model cell. This model is placed into a beaker of water to which iodine has been added. The dialysis tubing that is used has pores through which relatively small molecules can pass but much larger molecules cannot.
When iodine comes into contact with starch, the iodine-starch complex turns deep blue or blue-black in color, allowing one to monitor the movement of iodine and starch. The movement of glucose can be monitored in a number of ways, including the use of the Benedict’s assay for glucose or simple glucose test strips.
The experimental results, as shown in Figure 24.4, indicate that while water, glucose, and iodine can pass through the pores in the semipermeable dialysis tubing, the starch molecules cannot.
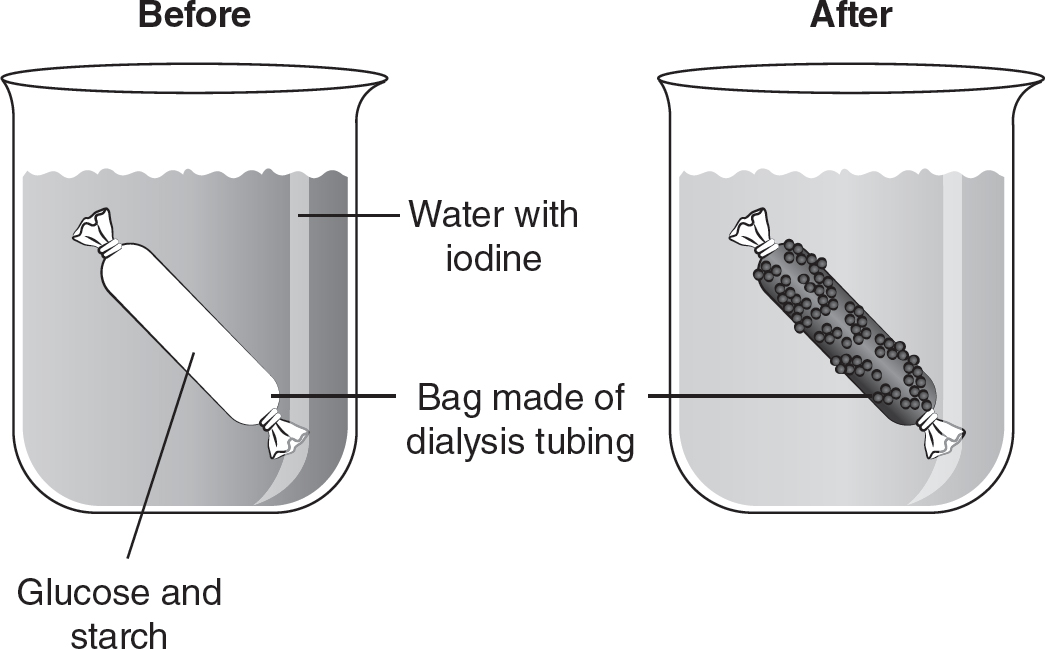
Figure 24.4 Diffusion Across a Semipermeable Membrane
Part 3: In this part of the investigation, dialysis tubing is again used to create a model of a cell with a semipermeable membrane. Each of six pieces of dialysis tubing are filled with one of six different unknown solutions with various sucrose concentrations (0.0, 0.2, 0.4, 0.6, 0.8, and 1.0 molar). The sucrose molecule is approximately twice as large as a glucose molecule and is too large to pass through the pores in the dialysis tubing. Each model cell is massed and then placed in a beaker of distilled water for at least 30 minutes. Then they are massed again, and the percent change in mass for each bag is calculated. Water will move into the dialysis bags. Bags that contain a solution with the highest sucrose concentration (lowest water potential) will gain more mass and have a greater percent change in mass during the allotted time than bags that contain a solution with a lower sucrose concentration (and a relatively higher water potential). By comparing the percent changes in mass of each bag, the concentration of sucrose in each bag can be identified.
Part 4: In this part of the investigation, the movement of water in plant cells is measured. Cubes of potato (or any other root vegetable) of identical sizes are made and then massed. Each cube is placed in a solution with a different concentration of sucrose (0.0, 0.2, 0.4, 0.6, 0.8, and 1.0 molar). Plant cells have a cell wall in addition to a cell membrane, so these cubes are placed in the solutions at least overnight to allow for movement of water between the plant cells and their environment. Then each cube is removed from the solution and massed, and the percent change in mass is calculated. Cubes with a higher water potential than the surrounding solution are expected to lose water to their environment and therefore have a negative percent change in mass. Cubes with a lower water potential than the surrounding solution are expected to gain water from their environment and therefore have a positive percent change in mass. A graph is made plotting the molarity of each solution on the x-axis and the percent change in mass on the y-axis, as shown in Figure 24.5.
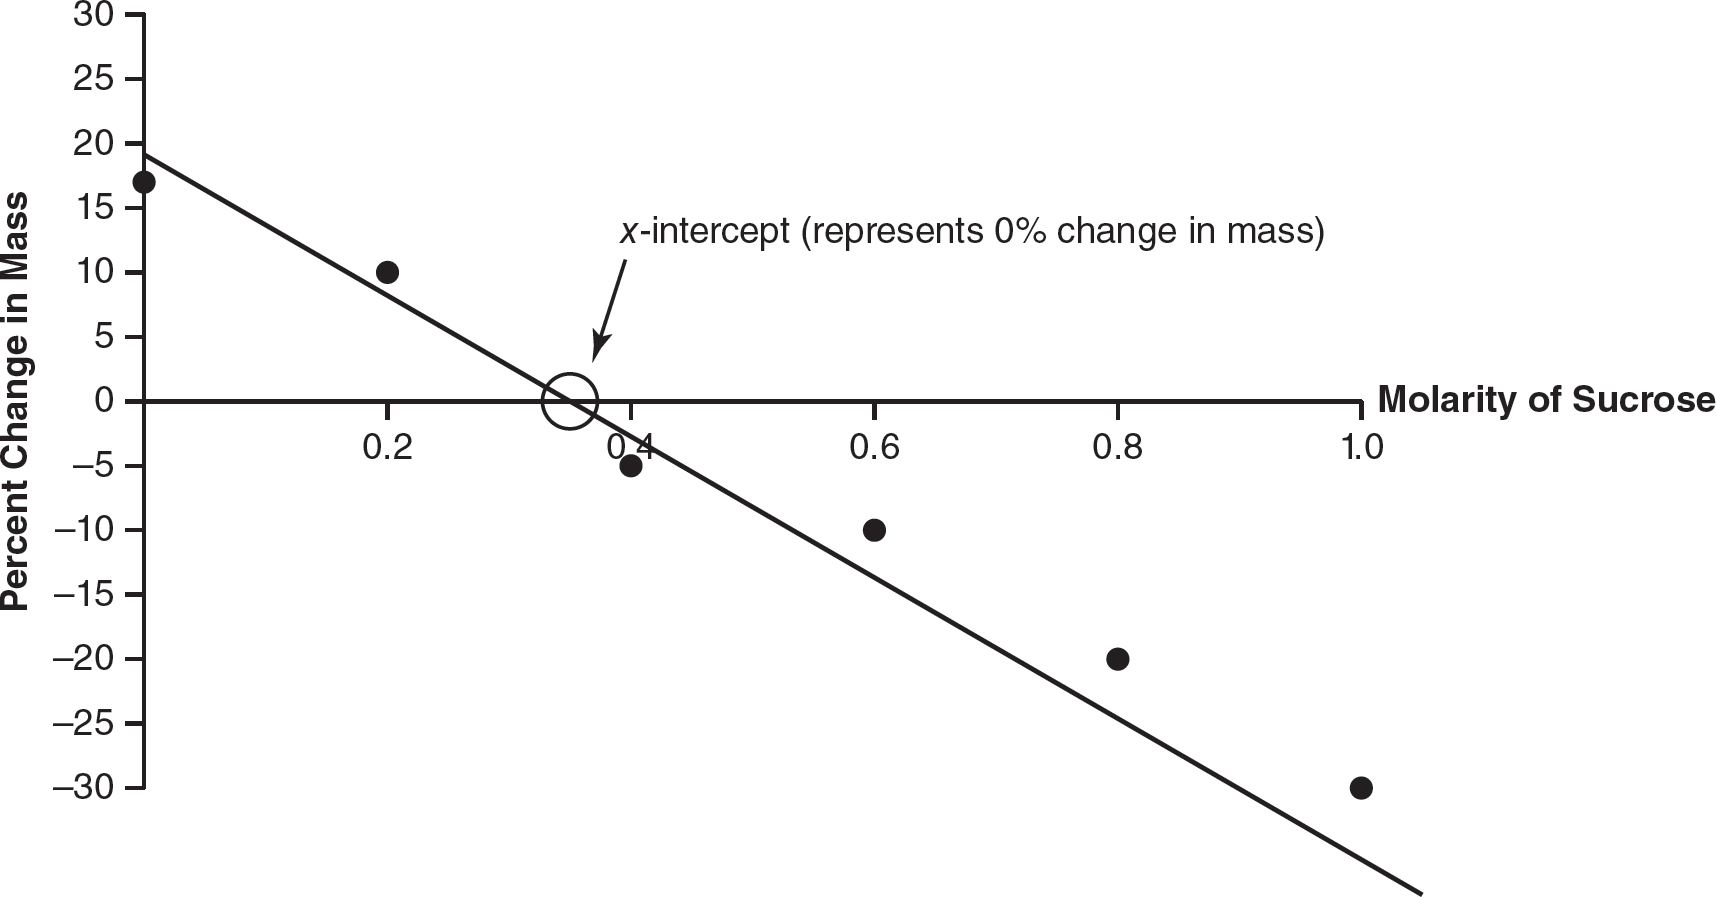
Figure 24.5 Percent Change in Mass vs. Molarity of Sucrose
When a line of best fit is drawn, the point at which the line crosses the x-axis (the x-intercept) represents the concentration of a solution that would be isotonic to a potato cell, with a 0% change in mass expected if a potato cell was placed in a solution with that sucrose concentration. The concentration of the isotonic solution can be used to estimate the solute concentration of a potato cell and calculate the water potential of a potato cell.
Part 5: Turgor pressure is the pressure created by the fluids in a cell when the fluid is pressing against the cell membrane or cell wall. If a plant cell is placed in an environment with a higher water potential than that of the cell, water will move from the environment into the plant cell, creating turgor pressure. Plasmolysis is the shrinking of the cytoplasm of a cell away from the cell wall due to the movement of water out of a cell. If a plant cell is placed in an environment with a lower water potential than that of the cell, water will move from the higher water potential in the cell to the lower water potential in its surroundings, and plasmolysis will occur. If a plant is placed in an environment with a lower water potential (for example, if you forget to water your plant), plasmolysis will occur and the plant will wilt.
In this part of the investigation, plant cells are placed in an environment with a lower water potential than that of the plant cell and in an environment with a higher water potential than that of the plant cell. Observations of changes in the cytoplasm are made under a light microscope.
Lab 5: Photosynthesis
Life on Earth depends on photosynthesis. Photosynthetic organisms capture light energy and store it in organic compounds, which are consumed by other organisms. The overall equation for photosynthesis is the following:
![]()
The rate of photosynthesis can be measured by the rate of consumption of the reactants (CO2 or H2O) or by the rate of production of the products (C6H12O6 or O2).
In this lab investigation, the floating leaf disk technique is used to measure the production of oxygen during photosynthesis. A hole punch or sturdy straw is used to create 10 equal-sized disks from a leaf. Spinach works well for this because it has a high concentration of chlorophyll and is a relatively soft leaf with no waxy cuticle that could impede the movement of materials into or out of the leaf. The disks are placed in a syringe that contains a 1% sodium bicarbonate solution. The bicarbonate enriches the carbon dioxide content of the solution.
The syringe is capped, and the plunger of the syringe is pulled out about 1 or 2 cm to create a vacuum in the syringe. The interior of a leaf contains air spaces between the chloroplast-containing mesophyll cells. When a vacuum is formed in the syringe, the air in the spaces between the mesophyll cells is removed and replaced with the sodium bicarbonate solution. When enough of the air has been replaced with the sodium bicarbonate solution, the density of the leaf disk increases and it sinks.
The sunken leaf disks are transferred to a beaker that contains sodium bicarbonate solution. When exposed to a light source, the leaf disks perform photosynthesis: oxygen is produced and replaces the sodium bicarbonate solution in the spaces between the mesophyll cells. When enough oxygen has been produced, displacing the sodium bicarbonate solution inside the leaf, the leaf disks float. At one-minute intervals, the number of floating leaf disks is recorded. The time needed until 50% of the leaf disks float can be used as an indirect assay of the rate of photosynthesis. A sample data table and a graph of the data (Figure 24.6) follow.
|
Time (minutes) |
Number of Floating Leaf Disks |
0 |
0 |
1 |
0 |
2 |
0 |
3 |
0 |
4 |
0 |
5 |
2 |
6 |
2 |
7 |
4 |
8 |
5 |
9 |
6 |
10 |
7 |
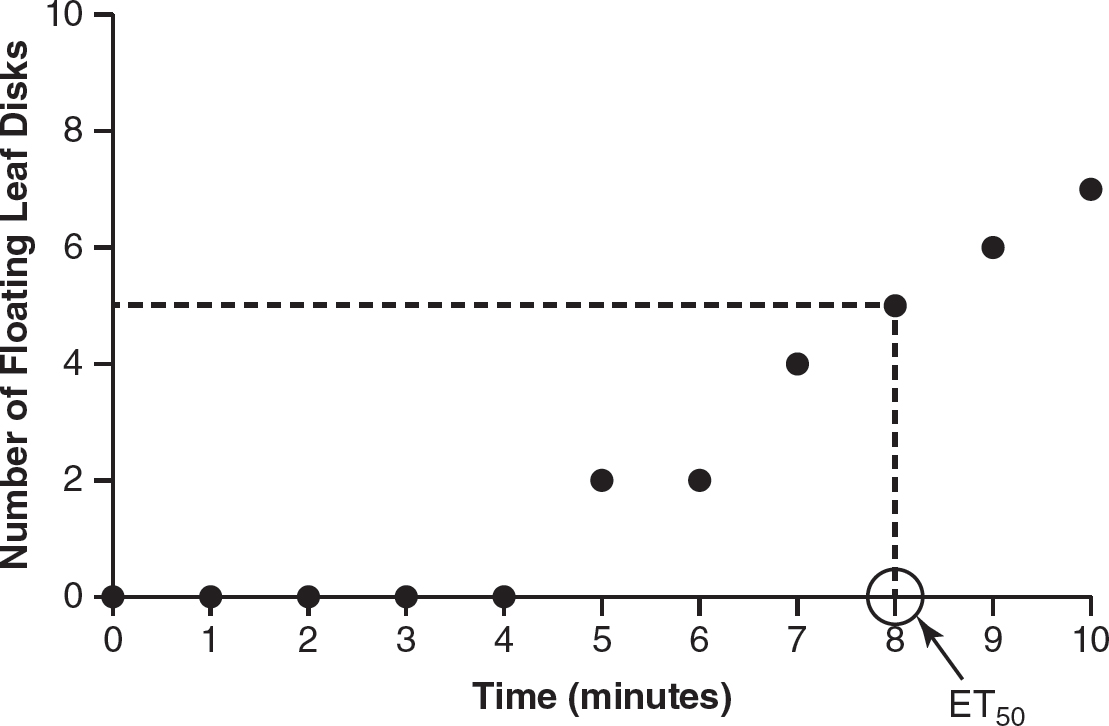
Figure 24.6 Number of Floating Leaf Disks vs. Time (Minutes)
The conditions of the experiment can be varied to investigate the effects of different independent variables on the time required for the leaf disks to float. The time required for 50% of the leaf disks to float (ET50) under each condition can be compared to learn how different conditions affect the rate of photosynthesis.
Lab 6: Cellular Respiration
The energy stored in the chemical bonds of glucose during the process of photosynthesis is released by the process of cellular respiration. The overall equation for cellular respiration is the following:
![]()
The rate of cellular respiration can be measured by the rate of consumption of the reactants (glucose and oxygen) or the rate of production of the products (carbon dioxide and water).
A respirometer is a sealed chamber with an attached measuring pipette that is used to measure the change in volume due to the respiration of the organism. A small respiring organism (germinating seeds, fruit flies, and crickets are commonly used) is placed in a respirometer. Glass or plastic beads of roughly equal volumes to the respiring organisms are placed in a second respirometer as a control.
At room temperature, glucose and water are in the solid and liquid states, respectively, so their contributions to any change in volume in the respiring system is minimal. As oxygen gas is consumed during respiration, carbon dioxide is produced, balancing out any potential change in the volume of the gases present. However, potassium hydroxide (KOH) solution reacts with carbon dioxide gas to form a solid potassium carbonate salt, as shown in the following equation:
![]()
If a few drops of potassium hydroxide solution are added to the respirometer, any carbon dioxide produced will be precipitated into the potassium carbonate salt. The result is that any change in volume in the gases in the respirometer is the result of the consumption of oxygen gas. Thus, this allows the rate of cellular respiration to be assayed.
The respirometers can be placed in environments with different temperatures to observe the effect of temperature on the rate of respiration. Sample data is shown in the table and in Figure 24.7.
Oxygen Consumption (mL)
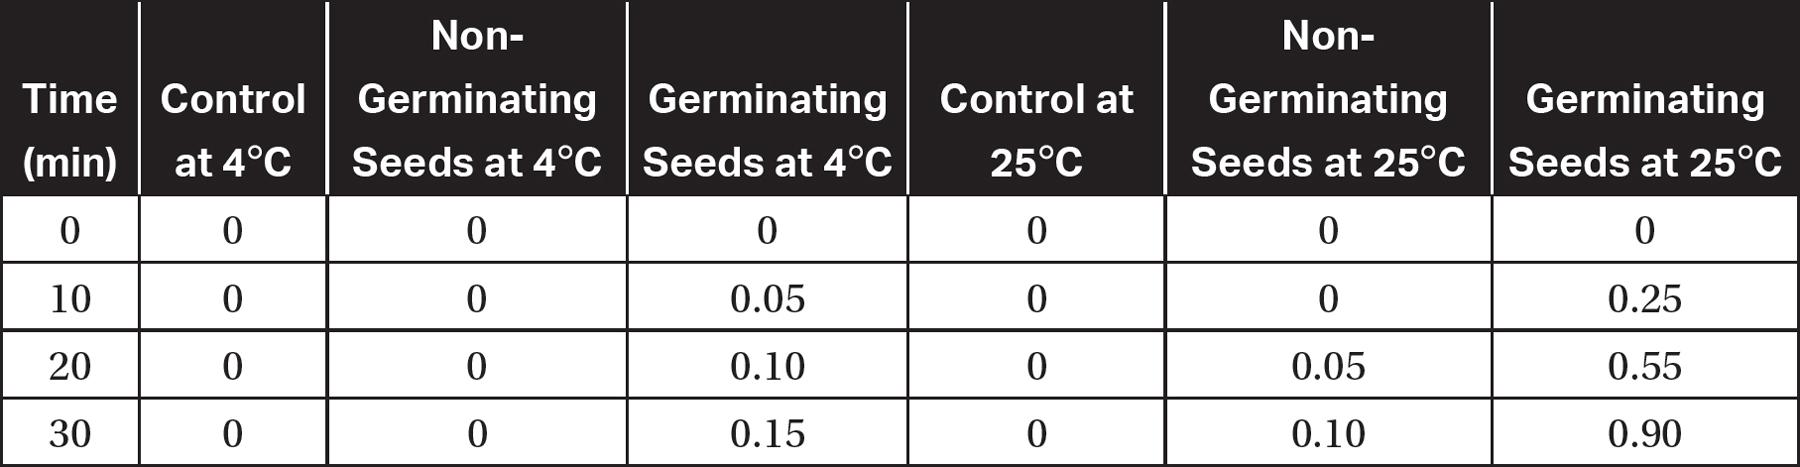
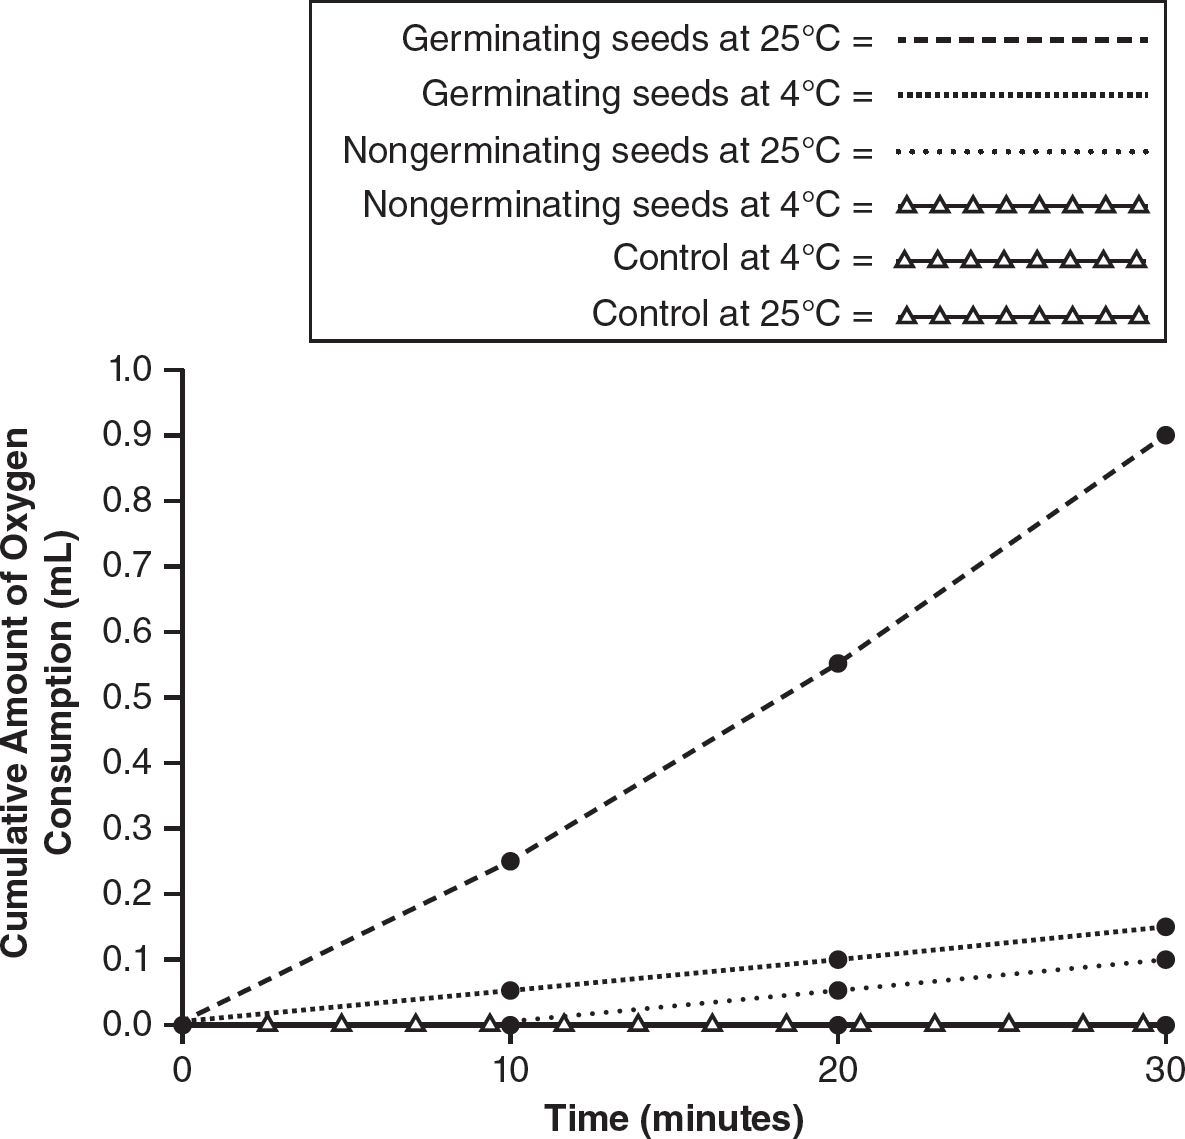
Figure 24.7 Oxygen Consumption vs. Time
Lab 7: Mitosis and Meiosis
Mitosis is the process of cell division in somatic (body) cells that produces genetically identical daughter cells. Mitosis is important in asexual reproduction, growth, and tissue repair. Meiosis is the process used in sexually reproducing organisms to produce haploid gametes. Meiosis ensures that the number of chromosomes remains consistent from generation to generation while also generating genetic diversity through genetic recombination or crossing-over. The roles of mitosis and meiosis in a living organism’s life cycle are represented in Figure 24.8.
Figure 24.8 Roles of Mitosis and Meiosis
As in Lab 4, this investigation can be divided into multiple parts, as in the following scenario.
Part 1: In this part of the investigation, the cell cycle and mitosis can be modeled using beads, pipe cleaners, clay, or a variety of other tools. After modeling the cell cycle and mitosis, you should have a better understanding of:
§ The part of the cell cycle during which the genetic information of a cell is duplicated
§ Why chromosomes condense before they are separated
§ How the sister chromatids in a chromosome are separated and the result if a pair of sister chromatids fail to separate
Part 2: In this part of the lab, cells are treated with a chemical and are compared to untreated cells to find out whether the chemical alters the rate of mitosis. Slides are prepared from both the treated and untreated groups, and the number of cells in mitosis and interphase are recorded for each group. A chi-square test is used to determine whether there is a statistically significant difference between the number of cells in mitosis and interphase in each group. The null hypothesis for this experiment is that there is no statistically significant difference in the number of cells in interphase and mitosis in the control (untreated) and treated groups. Sample data and the chi-square calculation to evaluate the null hypothesis follow. (For a review of how to complete a chi-square calculation, review Chapter 2).
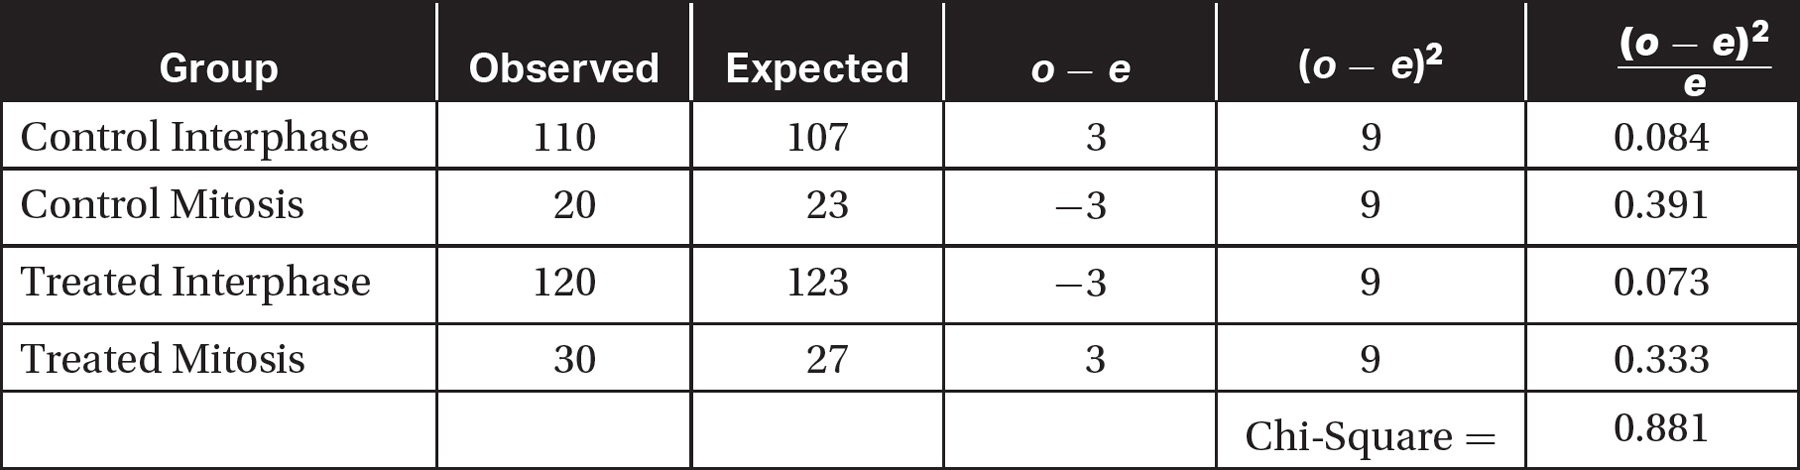
Since there are four possible outcomes in this experiment, the number of degrees of freedom (df) is 4 — 1 = 3. Using a p-value of 0.05, the critical value from the chi-square table is 7.81. Since the calculated chi-square value of 0.881 is less than the critical value of 7.81, fail to reject the null hypothesis.
Part 3: In this part of the lab, karyotypes from normal and cancerous cells are compared. A karyotype is a picture of the chromosomes in a dividing cell. Karyotypes can show abnormalities in the number of chromosomes in a cell caused by errors in cell division. Recall that control of cell division is monitored at checkpoints. These checkpoints monitor for proper ratios of cyclins and cyclin-dependent kinases and for accurate DNA replication to prevent errors in cell division. Factors that regulate cell division are discussed further in Chapter 11.
Part 4: In this part of the investigation, the process of meiosis is modeled using beads, pipe cleaners, clay, or a variety of other tools. After modeling the process of meiosis, you should have a better understanding of:
§ How haploid gametes are formed from diploid cells
§ How meiosis generates genetic diversity
§ The events in meiosis that demonstrate Mendel’s law of independent assortment
§ The events in meiosis that demonstrate Mendel’s law of segregation
§ How the distance between two genes on a chromosome affects the frequency of genetic recombination between the two genes
Part 5: In the final part of this lab investigation, slides of Sordaria fimicola are observed. The frequency of recombination events (between the centromere and the gene that controls spore color in Sordaria) is used to calculate the genetic distance between the centromere and the gene for spore color. The percentage of recombination events between the centromere and the spore color gene is proportional to the distance between them.
Lab 8: Bacterial Transformation
Biotechnology has transformed medicine by making medications (such as insulin) more readily available and creating personalized therapies to treat some cancers and genetic disorders. Many of these medical advances involve inserting new DNA into cells. One technique for inserting DNA into cells is transformation, the uptake and expression of foreign DNA by a cell. In this lab, a gene carried on a plasmid, a small circular piece of DNA, is inserted into bacterial cells. Heat shock is the procedure used to insert the plasmid into the bacterial cells.
Plasmids in nature often contain genes for antibiotic resistance. These genes for antibiotic resistance can be used as selectable markers to detect which bacteria have absorbed the plasmid. For example, say you perform a bacterial transformation procedure using a plasmid that contains a gene for resistance to the antibiotic ampicillin. If you grow the bacteria used on agar plates that contain the antibiotic ampicillin, only bacteria that have absorbed the plasmid will grow on the agar plates.
Heat shock was one of the first techniques used to insert foreign DNA into cells and is a key step in this investigation. In this lab, bacterial cells are placed in a test tube with a transformation solution and the plasmid DNA. This tube is then incubated on ice, exposed to a brief heat shock in a water bath, and then returned to the ice. The cell membrane of a bacterial cell is composed of a phospholipid bilayer. When the cell experiences a heat shock, temporary microscopic “cracks” are formed in the cell membrane through which the plasmid DNA may enter. Not all bacteria will take in the plasmid, but manipulating the heat shock under different conditions can lead to higher or lower numbers of plasmids entering the cells.
If the bacteria are exposed to a heat shock for too long, the cells may lyse, and no transformed bacteria will result. If the amount of time of the heat shock is too short, the plasmids may not be able to enter the bacteria cells. So it is important to have appropriate controls for this investigation so that one can ascertain which bacteria were successfully transformed and to confirm that the heat shock procedure did not kill the bacteria. The following table and Figure 24.9 show the components of a typical bacterial transformation experiment (that used a plasmid that contains a gene for ampicillin resistance) and the expected results.
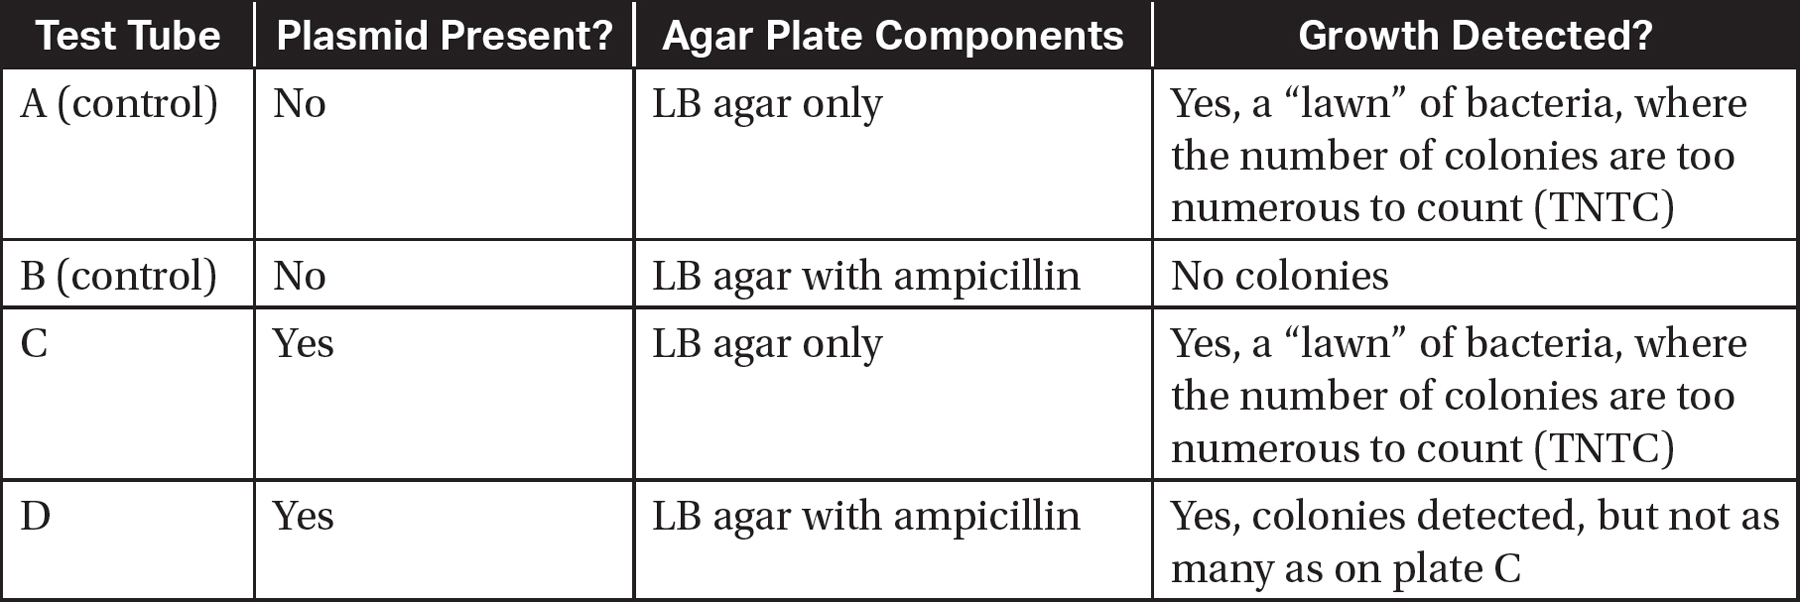
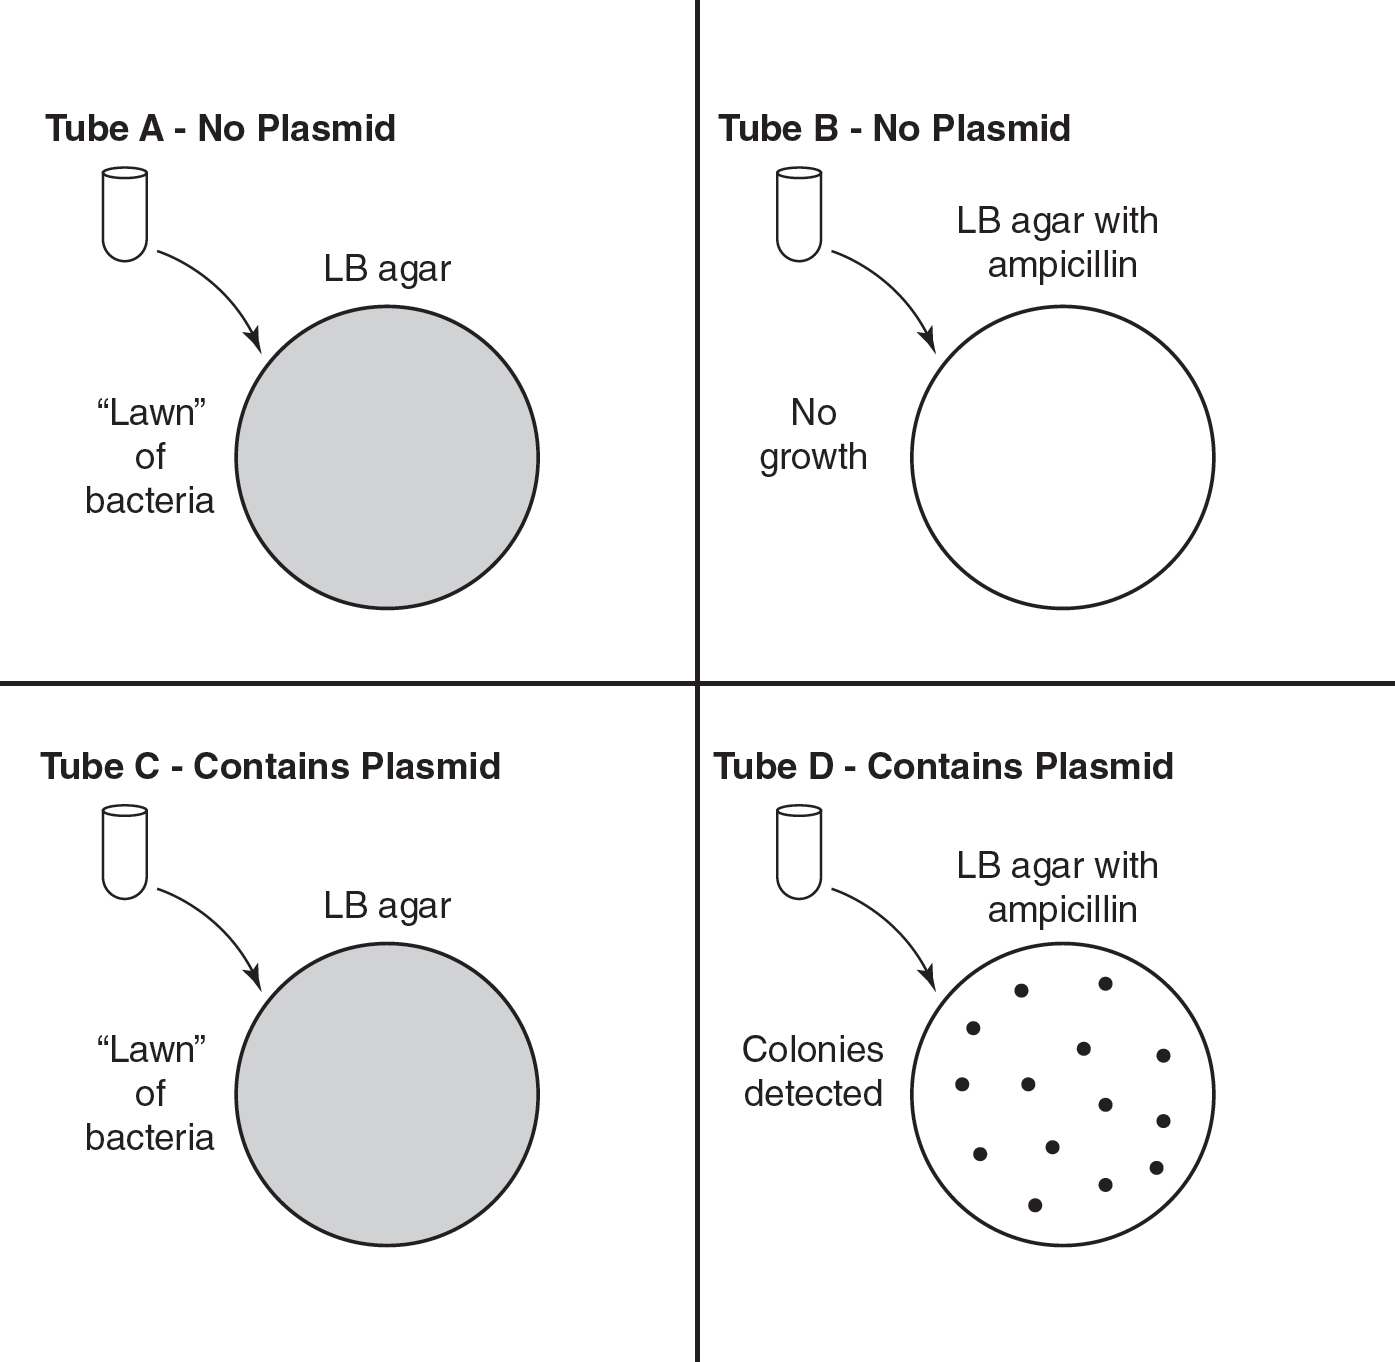
Figure 24.9 Expected Results
§ Test tube A does not contain the plasmid. Its contents are grown on LB agar, upon which both bacteria with or without the plasmid will grow, so it is expected that there will be robust growth of bacteria on this plate.
§ Test tube B does not contain the plasmid. Its contents are grown on LB agar to which ampicillin has been added. Ampicillin will kill any bacteria that have not absorbed the plasmid and therefore are not resistant to ampicillin. It is expected that no bacteria will be seen on this plate. If a colony of bacteria is seen on this plate, it could indicate that there was a very rare spontaneous mutation that conferred ampicillin resistance to those bacteria, but that is a highly improbable, though not impossible, event.
§ Test tube C does contain the plasmid. Its contents are grown on LB agar, upon which both bacteria with or without the plasmid will grow, so it is expected that there will be robust growth of bacteria on this plate.
§ Test tube D does contain the plasmid. Its contents are grown on LB agar to which ampicillin has been added. Ampicillin will kill any bacteria that have not absorbed the plasmid and therefore are not resistant to ampicillin. It is expected that any colonies seen on this plate will contain the plasmid with the resistance gene and will be considered “transformed.”
Lab 9: Restriction Enzyme Analysis of DNA
The genetic code is shared by all living organisms, and it is a powerful piece of evidence for the common ancestry of all forms of life on Earth. The genetic code is also redundant, meaning multiple codons can code for the same amino acids during translation. Because of the redundancy of the genetic code, individuals may have the same proteins with the same amino acid sequences but with different DNA sequences. Restriction enzymes cut DNA at specific DNA sequences. As the restriction enzyme cuts DNA, differences in DNA sequences result in differently sized fragments of DNA from different individuals. These DNA fragments of different sizes can be separated by gel electrophoresis.
In this lab, a scenario might involve a description of a crime scene and suspects. DNA from evidence at the crime scene is isolated and cut with restriction enzymes. DNA is isolated from the suspects and cut with the same restriction enzymes. The resulting DNA fragments are placed on an agarose gel and are separated by gel electrophoresis. The sugar-phosphate backbone of DNA has a slightly negative charge and is attracted to the positive charge of the anode in the gel electrophoresis apparatus. Smaller fragments of DNA will travel farther in the agarose gel than longer fragments. The gel is stained with a dye that allows visualization of the DNA fragments, as shown in Figure 24.10.
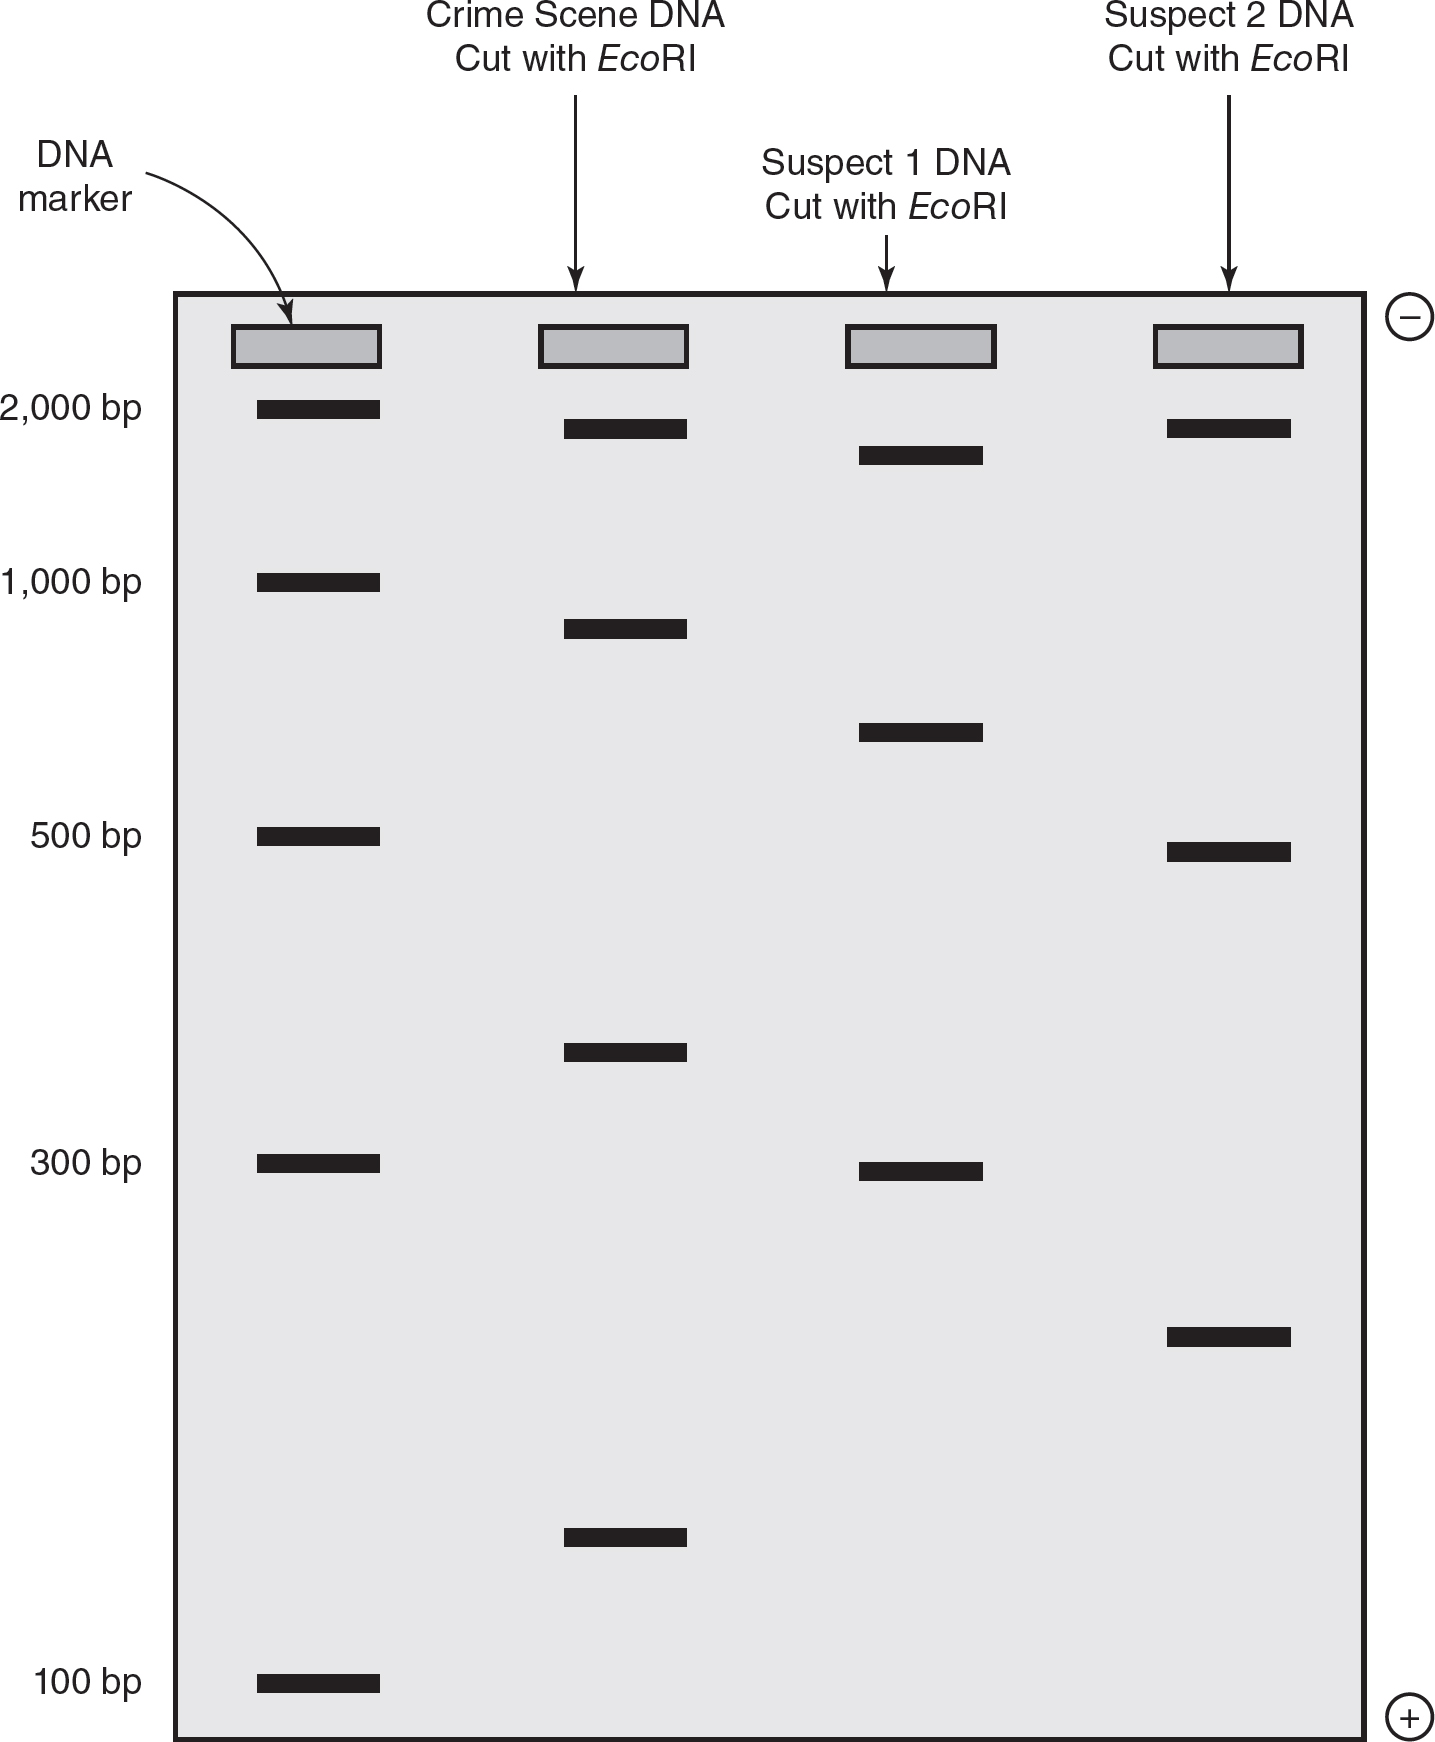
Figure 24.10 DNA Fragments on Electrophoresis Gel
If the pattern of DNA fragments from the suspect does not match the pattern from the DNA found in evidence at the crime scene, it is unlikely the individual was at the crime scene. However, if the pattern of DNA fragments does match, it does not prove guilt; it just shows that there is a possibility that the suspect was at the crime scene.
If a DNA marker that contains fragments of known sizes is run along with the DNA samples, the size of the DNA fragments in the other samples can be estimated. The distance migrated by the DNA marker fragments of known sizes are plotted on the x-axis of a graph, and the sizes of these known DNA marker fragments are plotted on the y-axis. A line of best fit is drawn between these points to create a standard curve (as shown by the solid line in Figure 24.11). Using the standard curve shown in Figure 24.11, if a fragment of unknown size migrated 4.0 cm in the gel, then interpolated to the line of best fit, the size of the fragment can be estimated from the standard curve to be about 420 base pairs (shown by the dotted line in Figure 24.11).
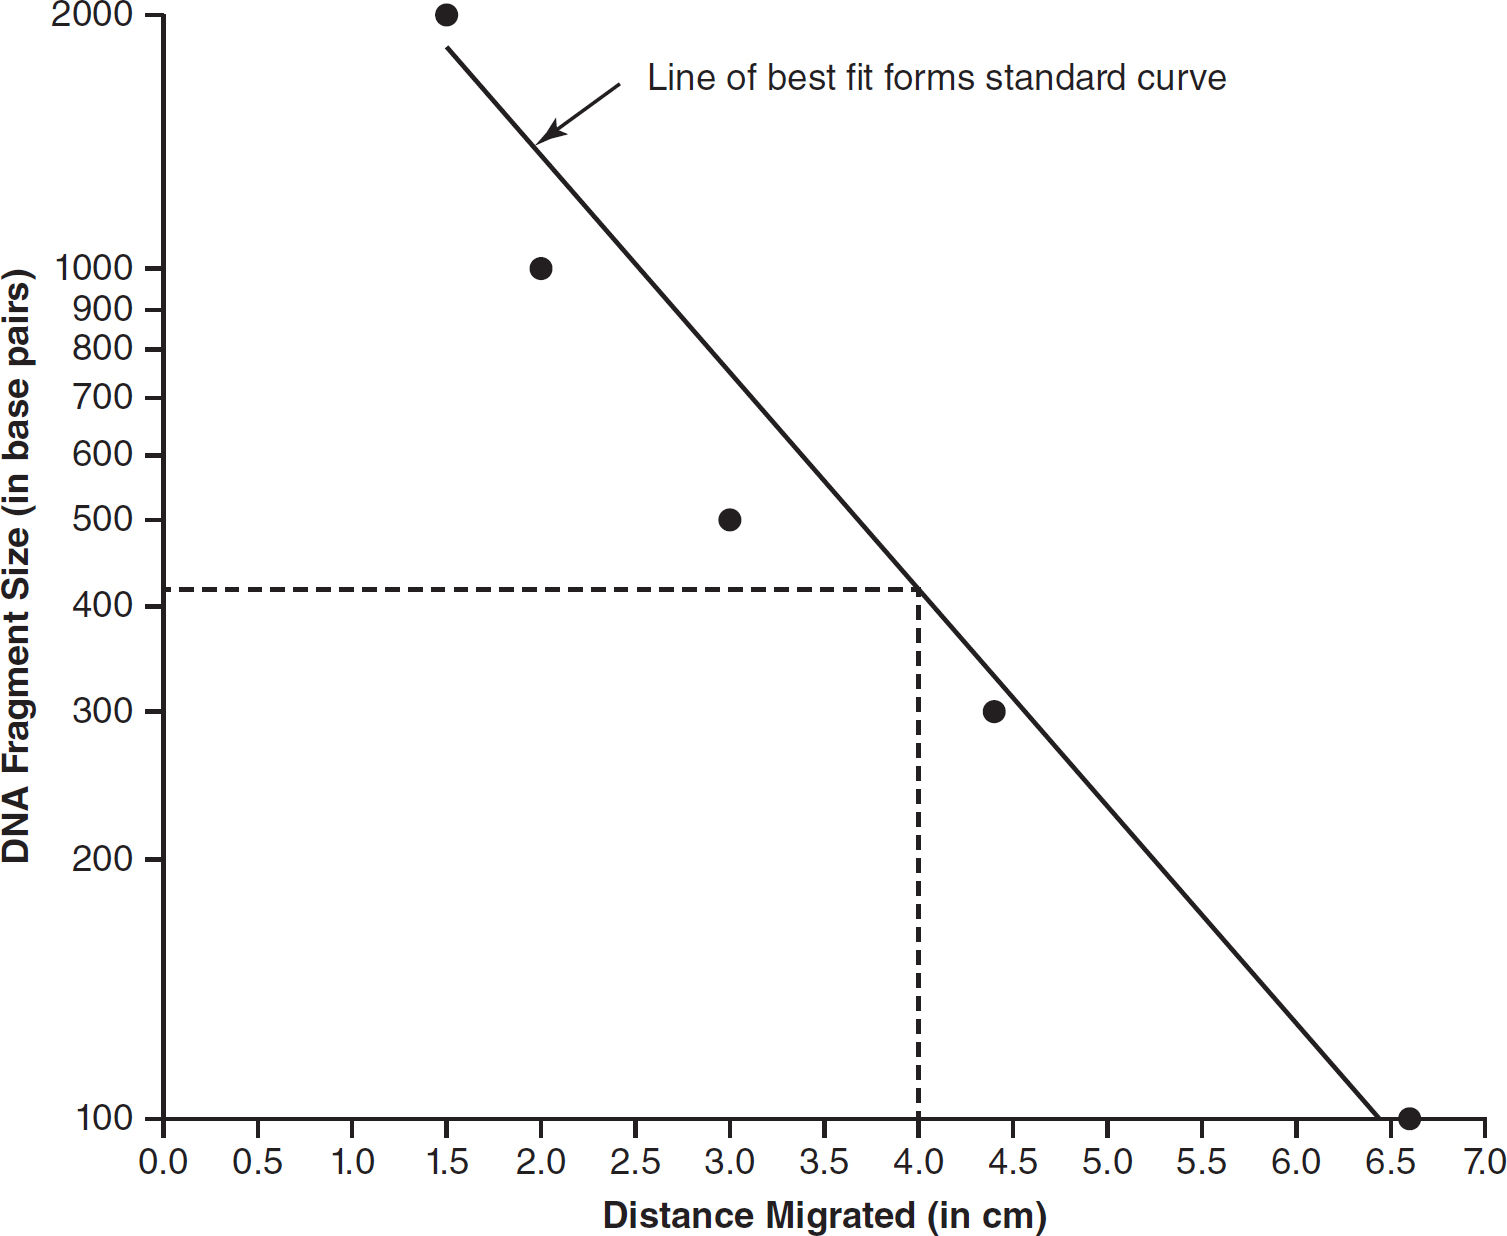
Figure 24.11 Graph of Electrophoresis Data with Standard Curve and Interpolation of an Unknown
Lab 10: Energy Dynamics
All life on Earth obtains its energy either directly or indirectly from light energy. Photosynthetic organisms (producers) capture light energy and store it in the chemical bonds of the organic products of photosynthesis. The total amount of organic compounds created by an organism through the process of photosynthesis is called the gross primary productivity. Some of the organic compounds made by a producer are needed by the organism to power its own life processes. The amount of organic compounds left after the producer meets its own energy needs is called its net primary productivity.
Primary consumers eat photosynthetic organisms and get energy through the breakdown of the organic compounds by the process of cellular respiration. Other consumers in the ecosystem eat these primary consumers. Eventually, organisms die, and decomposers break down the organic compounds found in the dead organisms so that the nutrients they contain may be returned to the ecosystem. These energy transfers in ecosystems are called energy dynamics.
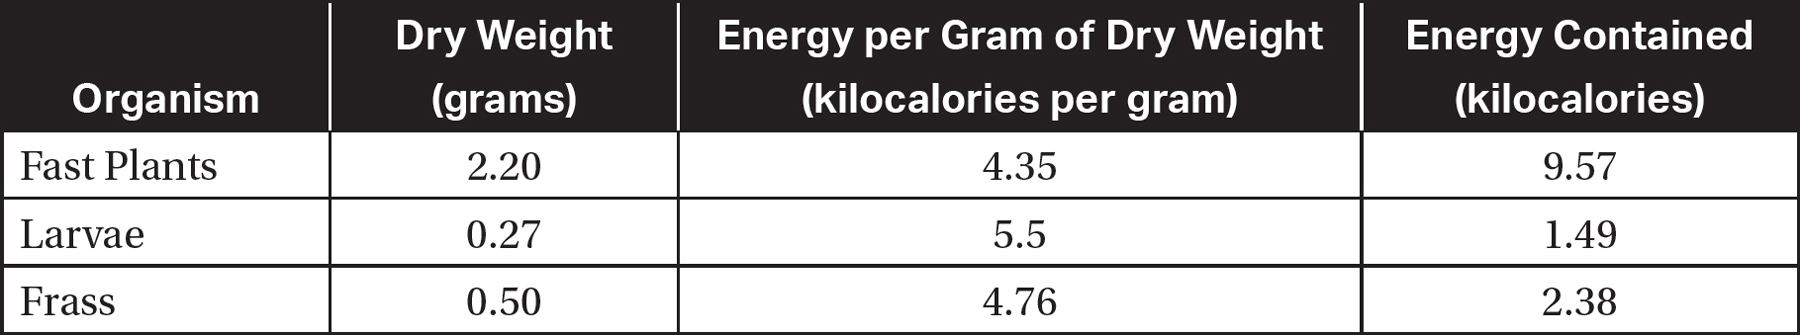
In this lab, Fast Plant (Brassica rapa) seeds are grown in a sealed ecosystem. As the Fast Plants grow, eggs from the cabbage white butterfly (Pieris rapae) are introduced and allowed to hatch. The resulting larvae consume the leaves of the Fast Plants (which are a member of the cabbage family). The larvae grow to maturity. Then the contents of the ecosystem are removed and dried, and the dry weights of each component are recorded. Conversion factors for each component are used to calculate the energy stored in each trophic level. For example, Fast Plants contain about 4.35 kilocalories of energy per gram of dry weight, and butterfly larvae contain about 5.5 kilocalories of energy per gram of dry weight. The droppings (frass) of the butterfly larvae contain about 4.76 kilocalories of energy per gram of dry weight. Using these conversions, the amount of energy available from each component can be calculated, as shown in the table.
Different conditions can be used (access to light, number of seeds, number of eggs, etc.) to see how variations in different factors affect the final results.
Lab 11: Transpiration
Transpiration is the loss of water through the stomata in the leaves of a plant. Stomata are openings in the surface of a plant leaf through which gases can be exchanged and water may evaporate. Plants need to open their stomata to take in the carbon dioxide needed for photosynthesis, but each time the stomata are open, water is lost from the plant. Plants need to constantly balance their needs for carbon dioxide and water; this is referred to as the transpiration-photosynthesis compromise.
Transpiration also helps pull water up from the roots of a plant to its leaves. When water evaporates from the stomata, the water potential of the leaves decrease. Water flows from areas of higher water potential to areas of lower water potential. As water evaporates through the stomata in the leaves, the cohesion of water molecules (due to water’s ability to form hydrogen bonds) will pull water up from the stems and roots of the plant, which have a higher water potential than the leaves of the plant. This process is called transpirational pull.
Different environmental factors can affect the rate of water loss through transpiration. If the environment that surrounds a plant has a lower water potential than that of the plant, the plant will lose water to its environment. The lower the water potential in the environment around the plant, the greater the rate of water loss from transpiration. Several variables can be used to measure which has the greatest effect on the rate of water loss due to transpiration:
§ Increased humidity
§ Increased light intensity
§ Increased wind
In this lab, a plant can be attached to a potometer, which measures water loss in the plant. The amount of total water loss over a defined time period is measured and can be graphed, as shown in Figure 24.12.
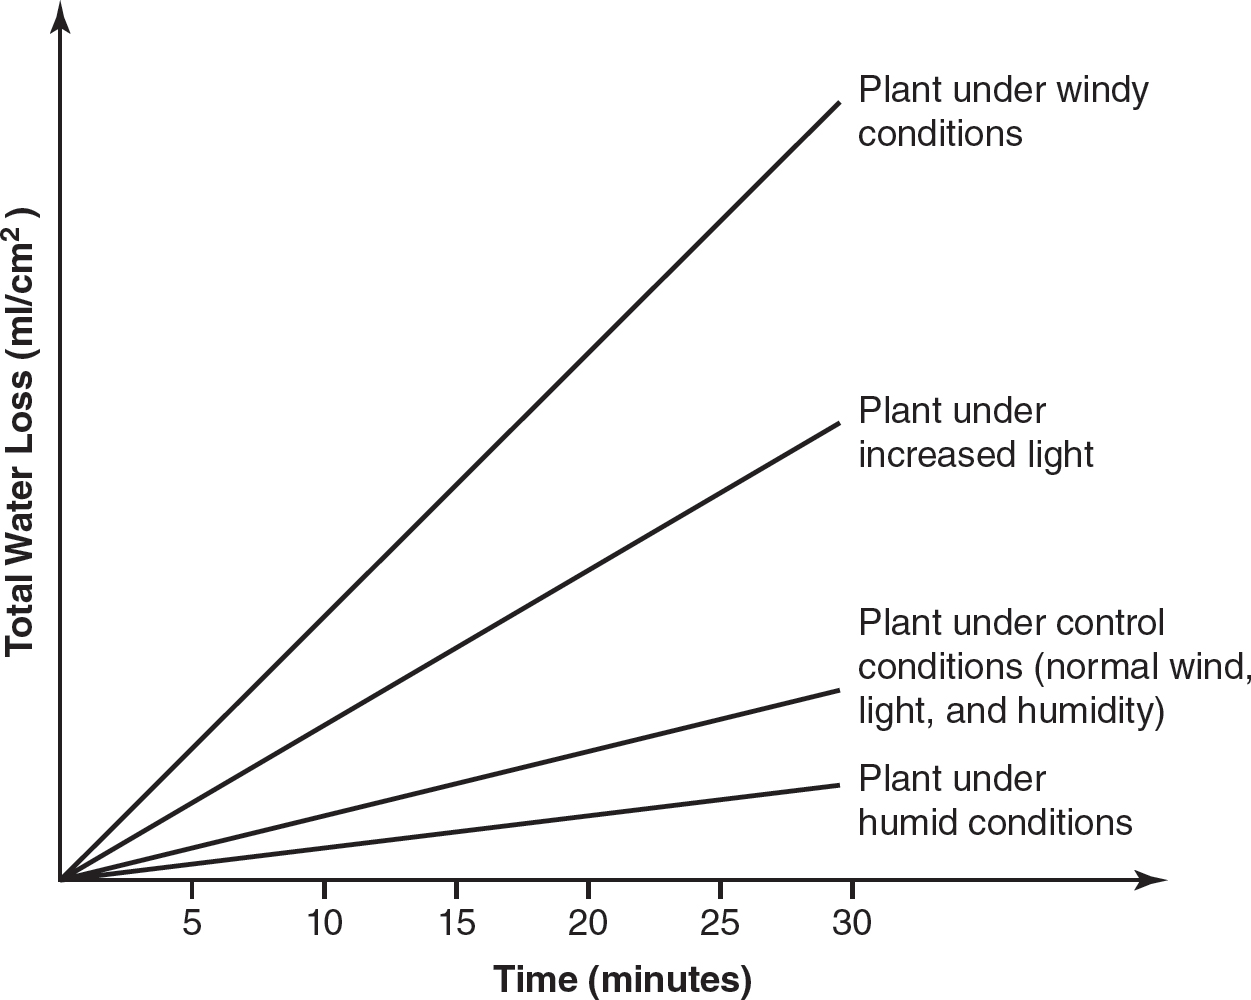
Figure 24.12 Total Water Loss vs. Time
Lab 12: Fruit Fly Behavior
Fruit flies (Drosophila melanogaster) have been used as a model organism in scientific studies for over 100 years. Their small size and low maintenance requirements make them very useful in labs around the world. In this lab, Drosophila preferences for a wide variety of experimental conditions can be tested.
A choice chamber can be constructed from easily obtainable items, such as plastic Petri dishes, plastic bottles, or graduated cylinders. An example of a choice chamber is shown in Figure 24.13.
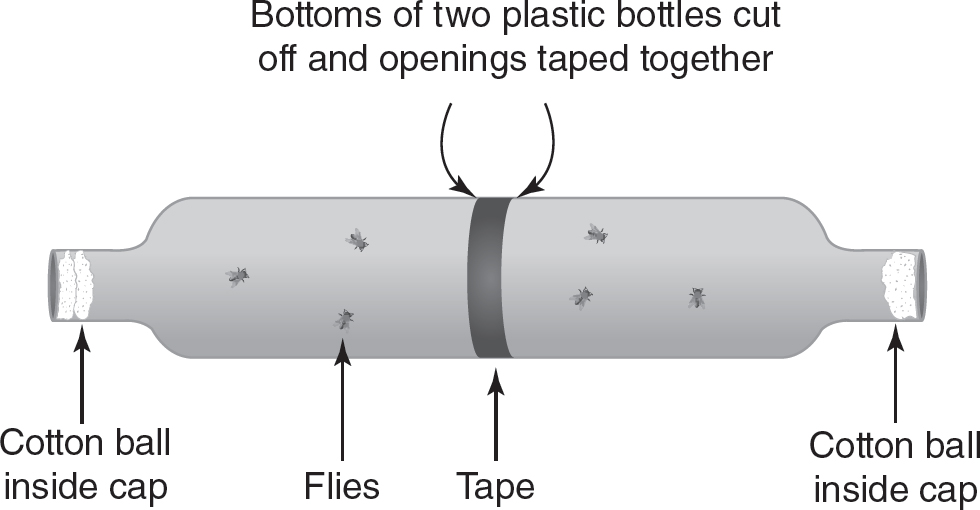
Figure 24.13 Choice Chamber
Drosophila are placed in the middle of the choice chamber, and different environmental conditions are created at each end of the chamber. Several conditions can be created with common classroom materials:
§ Light and dark—cover one half of the choice chamber with foil or black paper
§ Food preference—soak the cotton balls in different fruit juices and place them at opposite ends of the choice chamber
§ Temperature—place one side of the choice chamber on an ice pack
As with all lab investigations, it is important to use appropriate controls and repeat the experiment multiple times in order to obtain the most reliable data.
After a period of time (usually at least 10 minutes), the number of Drosophila on each side of the choice chamber are recorded. The null hypothesis for the experiment is that there would be no statistically significant difference in the preferences of the Drosophila, with roughly equal numbers on each side of the choice chamber. A chi-square test is performed to find out if the null hypothesis is rejected or if you must fail to reject the null hypothesis. A sample data set with the chi-square calculation is shown in the following table.
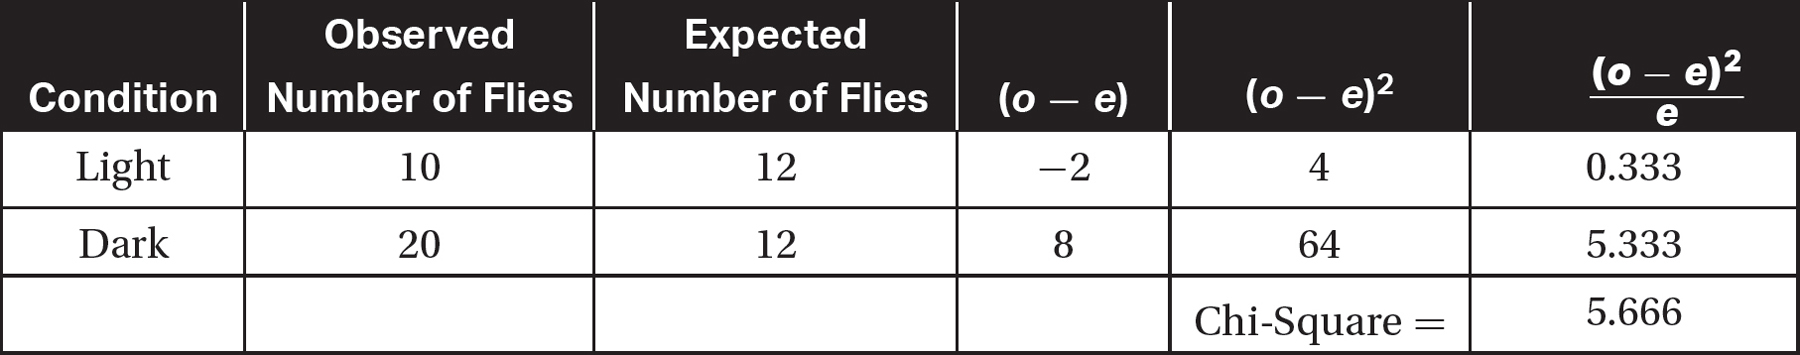
Since there are two possible outcomes, light and dark, there is one degree of freedom (df = number of possible outcomes — 1). Using a p-value of 0.05 and the chi-square table, the critical value is 3.84. The calculated chi-square value of 5.666 is greater than the critical value, so the null hypothesis (that there is no statistically significant difference) is rejected. When the null hypothesis is rejected, an alternative hypothesis is proposed. In this case, an alternative hypothesis might be “Drosophila prefer a dark environment to an environment with light.”
Lab 13: Enzyme Activity
Enzymes speed up the rate of chemical reactions by lowering the activation energy of the reaction. The shape of an enzyme is specific to its substrate and crucial to its function. Enzymes bind to a substrate at the active site and form an enzyme-substrate complex that lowers the activation energy of the reaction. Environmental factors can change the shape of an enzyme and consequently change its function.
Peroxidase is an enzyme that breaks down hydrogen peroxide, a by-product of cellular respiration. Peroxidase can be obtained from many sources, including potatoes, liver, and turnips. In this lab, peroxidase from turnips is used to catalyze the breakdown of hydrogen peroxide. Peroxidase catalyzes the breakdown of hydrogen peroxide according to the following reaction:
![]()
The rate of this reaction can be measured by the rate of the disappearance of the reactant or the rate of production of the products. The chemical guaiacol has a high affinity for oxygen. When guaiacol binds to oxygen, it forms the chemical tetraguaiacol, which is brown in color. The more oxygen produced in the reaction, the darker brown the solution formed will be. By adding guaiacol to the reaction, a colorimetric assay of the relative amounts of oxygen produced can be performed. A spectrophotometer set to measure absorbance at 470 nm, the wavelength most absorbed by tetraguaiacol, can be used to quantify the color of each tube and therefore the relative amount of oxygen produced. If a spectrophotometer is not available, a simple color chart can be used to quantify the relative amount of oxygen produced.
Different environmental conditions can be changed to measure their effects on the production of oxygen by this enzyme-catalyzed reaction. Some common independent variables in this experiment include exposing the enzyme to different pH levels or temperatures. A sample data set from a temperature experiment is shown in the table and in Figure 24.14.
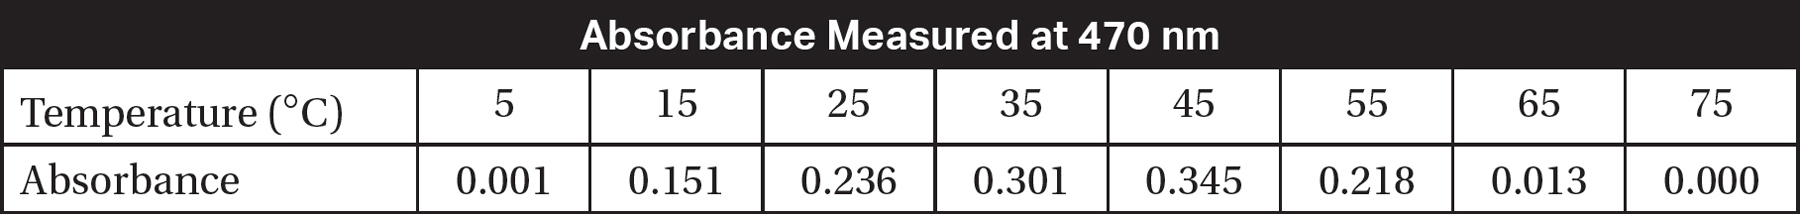
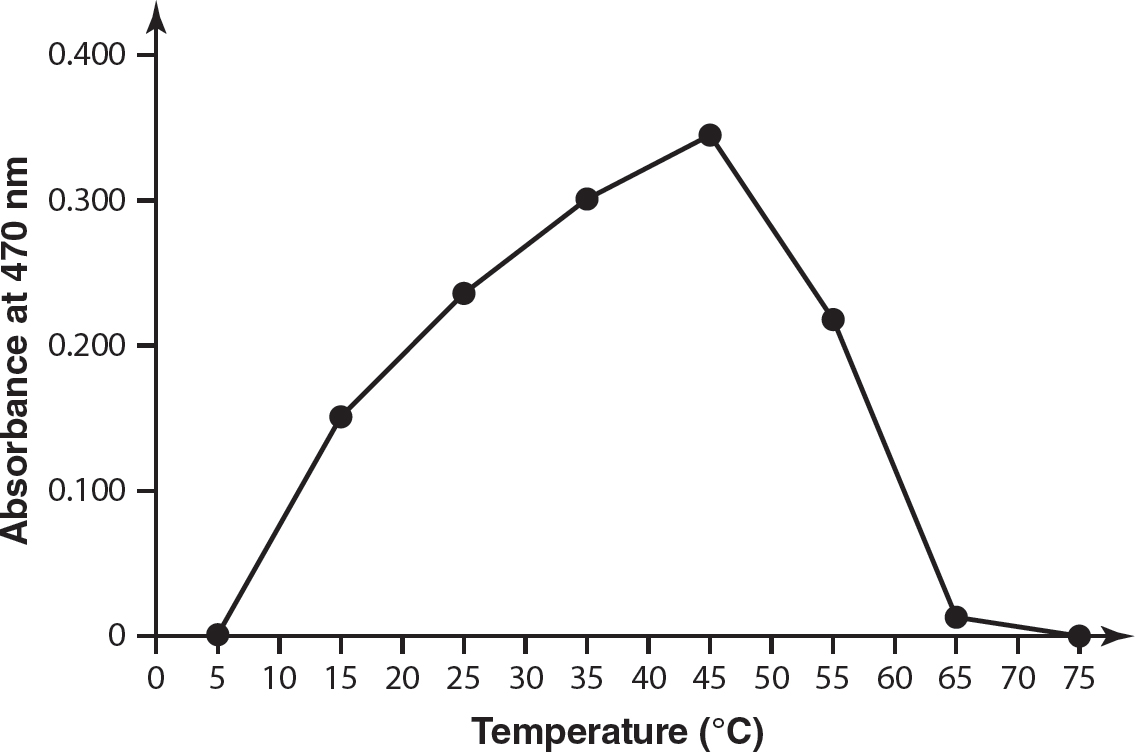
Figure 24.14 Absorbance at 470 nm vs. Temperature in Degrees Celsius
Practice Questions
Multiple-Choice
1.A cube of sugar beet is placed in a beaker of distilled water that is open to the atmosphere, as shown in the figure.
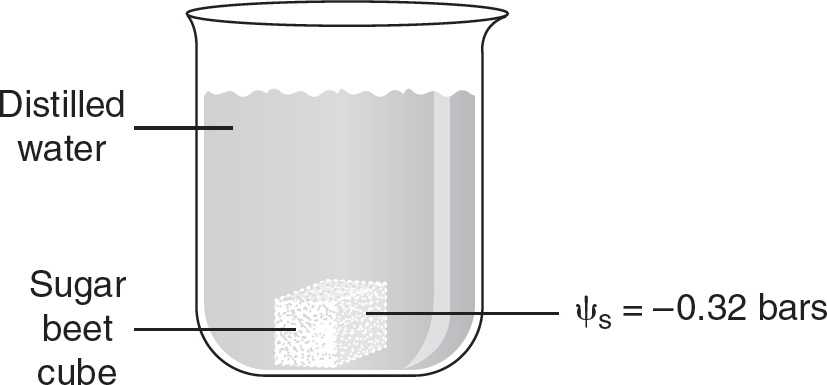
Which of the following statements correctly describes the figure?
(A)The water potential of the distilled water is 0 bars, and the total water potential of the cube of sugar beet is also 0 bars.
(B)The water potential of the distilled water is 0 bars, and the total water potential of the cube of sugar beet is —0.32 bars.
(C)The water potential of the distilled water is +0.32 bars, and the total water potential of the cube of sugar beet is —0.32 bars.
(D)The water potential of the distilled water is —0.32 bars, and the total water potential of the cube of sugar beet is +0.32 bars.
2.A student wants to study the effects of different colors of light on the rate of photosynthesis. The student uses the floating leaf disk method and places 10 leaf disks from a green plant that contains chlorophyll in each of three beakers. The first beaker is placed under white light, the second beaker is placed under green light, and the third beaker is placed under red light. All light sources have equal light intensity and are kept at the same temperature. The number of floating leaf disks at the end of each minute is recorded for 10 minutes and graphed. The estimated time for 50% of the leaf disks to float (ET50) is calculated. Which color of light is expected to produce the highest ET50 value?
(A)white light, because it contains all colors of the spectrum of visible light and chlorophyll will absorb all the wavelengths of light in the visible light spectrum
(B)green light, because chlorophyll absorbs the most energy from wavelengths of green light
(C)red light, because chlorophyll reflects red light and does not absorb energy from wavelengths of red light
(D)green light, because chlorophyll reflects green light and does not absorb energy from wavelengths of green light
3.The table shows cumulative milliliters of oxygen consumed by Drosophila placed in respirometers at different temperatures.
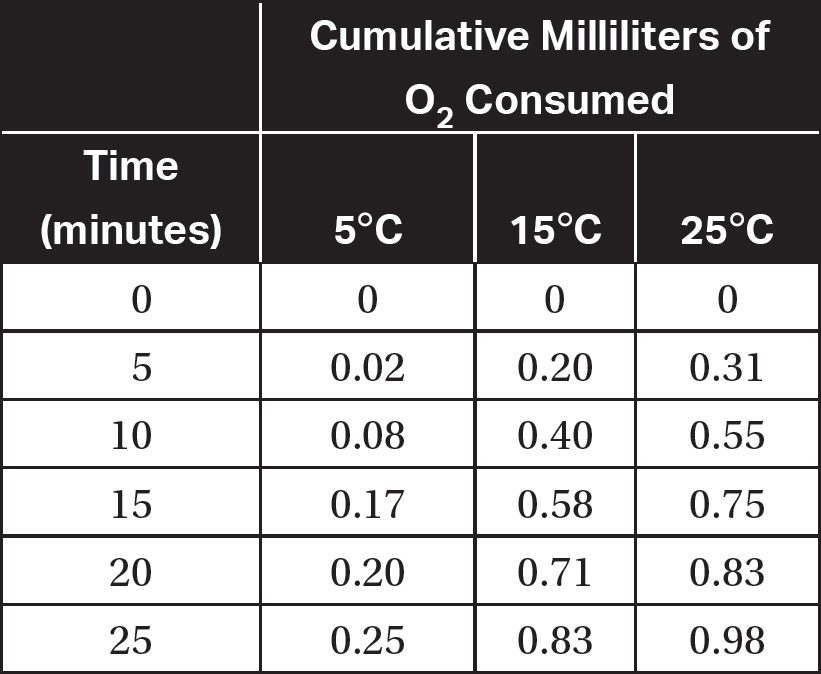
What is the rate of oxygen consumption of the Drosophila at 25°C from 10 minutes to 20 minutes?
(A)![]()
(B)![]()
(C)![]()
(D)![]()
4.Which of the following is a correct statement about mitosis and meiosis?
(A)Mitosis produces genetically identical haploid body cells, and meiosis produces genetically different diploid gametes.
(B)Mitosis produces genetically different haploid body cells, and meiosis produces genetically identical diploid gametes.
(C)Mitosis produces genetically identical diploid body cells, and meiosis produces genetically different haploid gametes.
(D)Mitosis produces genetically different diploid gametes, and meiosis produces genetically identical haploid body cells.
Questions 5 and 6
Two tubes that contain E. coli are transformed by heat shock. Tube 1 contains E. coli and a plasmid that contains the gene for antibiotic resistance to streptomycin. Tube 2 contains E. coli but does not contain any additional plasmid. After the transformation procedure, the contents of the tubes are plated on agar plates, as described in the table.
|
Plate |
Description |
A |
Agar in plate contains LB; 100 microliters from Tube 1 are placed on this plate. |
B |
Agar in plate contains LB and streptomycin; 100 microliters from Tube 1 are placed on this plate. |
C |
Agar in plate contains LB; 100 microliters from Tube 2 are placed on this plate. |
D |
Agar in plate contains LB with streptomycin; 100 microliters from Tube 2 are placed on this plate. |
5.On which plate would you expect to see the least amount of bacterial growth after incubation for 24 hours?
(A)Plate A, because the agar in the plate does not contain any streptomycin
(B)Plate B, because only a small percentage of the E. coli will absorb the plasmid
(C)Plate C, because Tube 2 did not contain the plasmid
(D)Plate D, because Tube 2 did not contain the plasmid, and streptomycin will kill the E. coli
6.What is the most likely explanation for the presence of bacterial colonies on Plate D?
(A)E. coli in Tube 2 absorbed the plasmid and became resistant to streptomycin.
(B)E. coli in Tube 2 learned how to catabolize the antibiotic.
(C)Some of the E. coli in Tube 2 had a rare spontaneous mutation that conferred resistance to streptomycin.
(D)Some of the E. coli in Tube 2 consumed streptomycin as a nutrient source.
7.A map of the sites where restriction enzymes cut a particular segment of DNA is shown in the figure.
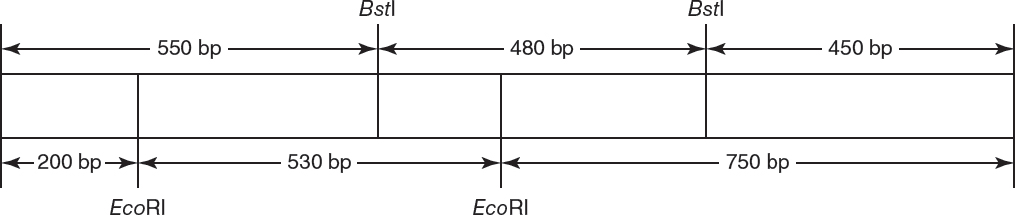
If the 1,480 bp DNA fragment shown in the figure is cut with both the restriction enzymes EcoRI and BstI, what would be the size of the DNA fragments produced?
(A)450 bp, 480 bp, and 550 bp
(B)200 bp, 530 bp, and 750 bp
(C)180 bp, 200 bp, 300 bp, 350 bp, and 450 bp
(D)200 bp, 450 bp, 480 bp, 530 bp, 550 bp, and 750 bp
Questions 8 and 9
A population is in Hardy-Weinberg equilibrium.
8.The frequency of a recessive phenotype in a population is 20%. What will be the frequency of the recessive allele after three generations?
(A)0.200
(B)0.447
(C)0.494
(D)0.800
9.What is the expected frequency of the heterozygotes after three generations?
(A)0.200
(B)0.447
(C)0.494
(D)0.800
10.A student wants to study the effects of salt (NaCl) concentrations on the activity of the enzyme peroxidase. The student sets up four tubes, each with the same starting concentration of the substrate (hydrogen peroxide), a pH of 7, and a temperature of 21°C. What would be an appropriate control in this experiment?
(A)a tube with the same starting concentration of the substrate, a pH of 7, a temperature of 21°C, but a different salt (KCl)
(B)a tube with the same starting concentration of the substrate, a pH of 7, a temperature of 21°C, but with no salt (no NaCl)
(C)a tube with the same starting concentration of the substrate, a pH of 7, and a temperature of 37°C
(D)a tube with water that replaces the enzyme solution
Short Free-Response
11.A student creates a sealed terrarium that contains Fast Plants (Brassica rapa) and cabbage white butterfly (Pieris rapae) eggs in order to study the energy dynamics of a model ecosystem. On December 10th, the terrarium is placed in the classroom under a light source attached to a timer so that the terrarium will be exposed to 12 hours of light each day. On December 17th, winter break starts, and the terrarium is left unattended under the light source. Unfortunately, when school reopens two weeks later, it is discovered that there was a power outage at the school that started on December 19th, and no light was provided to the terrarium from December 19th through January 3rd.
(a)Describe the function of the light source in this experiment.
(b)Explain how plants capture light energy.
(c)Predict what the terrarium might look like on January 3rd.
(d)Justify your prediction from part (c).
12.The DNA sequence in part of the protein hemoglobin from four species are shown in the table.
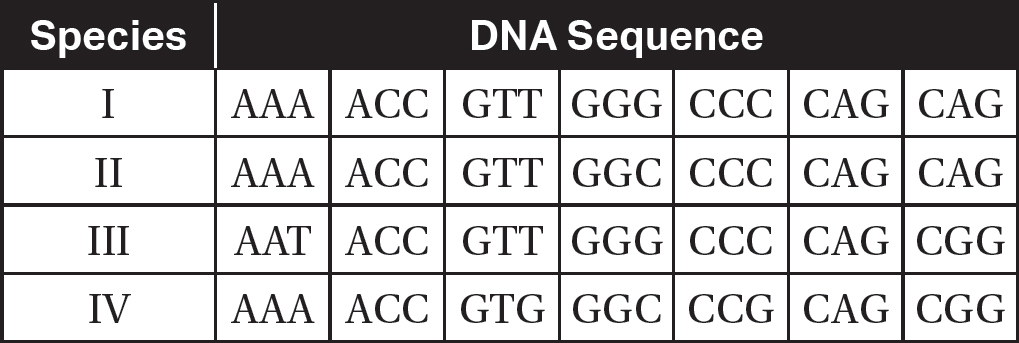
(a)Explain why two organisms with the same amino acid sequence in a protein can have different DNA sequences for the gene coding for that protein.
(b)Explain how DNA sequences can be used to create phylogenetic trees.
(c)Using the data in the table, represent the most likely phylogenetic relationships among these organisms.
(d)Identify two other types of data that could be used to create phylogenetic trees.
Long Free-Response
13.In an experiment, students grow 100 Brassica rapa plants for 10 days. The mean plant height on day 10 and the standard error of the mean are calculated and shown in the table (as Generation 1). The 10 tallest plants are allowed to continue to grow, while the remaining 90 plants are eliminated from the population. When these 10 tallest plants flower, they are cross-pollinated, seed pods form, and their seeds are harvested. These seeds are grown to day 10, and the heights of the resulting plants are recorded. The mean plant height on day 10 and the standard error of the mean are calculated and shown in the table (as Generation 2).
|
Generation |
Mean Plant Height on Day 10 (cm) |
Standard Error of the Mean |
1 |
15.8 |
1.1 |
2 |
20.3 |
0.9 |
(a)Explain the type of selection that was performed in this experiment.
(b)Using the axes provided, construct a graph of the data, showing the means and 95% confidence intervals.

(c)Using the graph you constructed in part (b), analyze the data, and determine whether there is a statistically significant difference in the mean plant height on day 10 between Generation 1 and Generation 2.
(d)On day 10 of Generation 2, the 10 shortest plants are allowed to continue to grow to flowering. These 10 plants are cross-pollinated, and their seeds are collected and planted to create Generation 3. Predict the mean plant height for Generation 3 on day 10. Justify your prediction.
Answer Explanations
Multiple-Choice
1.(B)Total water potential is the sum of the pressure potential and the solute potential. Since the beaker is open to the atmosphere and in equilibrium with the atmospheric pressure, the pressure potential on the sugar beet cube is 0 bars, making its total water potential equal to its solute potential, —0.32 bars. Choice (A) is incorrect because although the water potential of distilled water is 0 bars, the total water potential of the sugar beet cube is not also 0 bars. The water potential of distilled water that is open to the atmosphere is 0 bars, which rules out choices (C) and (D).
2.(D)ET50 values are high when the rate of photosynthesis is low. Chlorophyll appears green because it reflects, not absorbs, wavelengths of green light, so green light will provide the least amount of energy for photosynthesis. White light does contain all colors of the visible spectrum and would provide the most light energy for photosynthesis, so it would have the lowest, not the highest, ET50 value. Thus, choice (A) is incorrect. Choice (B) is incorrect because chlorophyll reflects, not absorbs, green light. Chlorophyll does absorb energy from red light, so choice (C) is incorrect.
3.(A)The rate of oxygen consumption at 25°C from 10 minutes to 20 minutes ![]() . Choice (B) is incorrect because it is the overall rate of oxygen consumption over the 25-minute period. Choice (C) is the cumulative oxygen consumption at 20 minutes, so it is incorrect. Choice (D) is incorrect because it is the cumulative oxygen consumption at 25 minutes.
. Choice (B) is incorrect because it is the overall rate of oxygen consumption over the 25-minute period. Choice (C) is the cumulative oxygen consumption at 20 minutes, so it is incorrect. Choice (D) is incorrect because it is the cumulative oxygen consumption at 25 minutes.
4.(C)The following table summarizes some of the major differences between mitosis and meiosis:
|
Mitosis |
Meiosis |
Produces genetically identical cells |
Produces genetically different cells |
Produces diploid cells |
Produces haploid cells |
Forms somatic (body) cells |
Forms gametes |
Choices (A) and (B) are incorrect because mitosis produces diploid (not haploid) cells and meiosis produces haploid (not diploid) cells. Choice (D) is incorrect because mitosis produces genetically identical (not different) cells and meiosis produces genetically different (not identical) cells.
5.(D)Streptomycin will kill any bacteria that are not resistant to the antibiotic. Since Tube 2 did not contain the plasmid with the streptomycin resistance gene and plate D contains agar with streptomycin, no E. coli will grow on plate D. Choices (A) and (C) are incorrect because both of those plates do NOT contain streptomycin, so many, many E. coli colonies will be found on those plates. Choice (B) is incorrect because although this plate does contain agar with streptomycin, Tube 1 received the plasmid that confers resistance to streptomycin, so some E. coli will grow on that plate. However, not every E. coli cell will absorb the plasmid, so plate B will have fewer bacterial colonies than plates A or C.
6.(C)The E. coli in Tube 2 did not receive the plasmid, so no growth is expected on plate D; however, there is a very small probability that a spontaneous mutation occurred in some of the E. coli cells that gave them resistance to streptomycin. Choice (A) is incorrect because no plasmid was added to Tube 2. There is no evidence that E. coli catabolize the antibiotic and individual bacteria do not learn how to catabolize an antibiotic, so choice (B) is incorrect. Streptomycin is not used as a nutrient source for E. coli, so choice (D) is incorrect.
7.(C)The following figure shows the fragments that would be produced if the DNA was digested with both EcoRI and BstI:
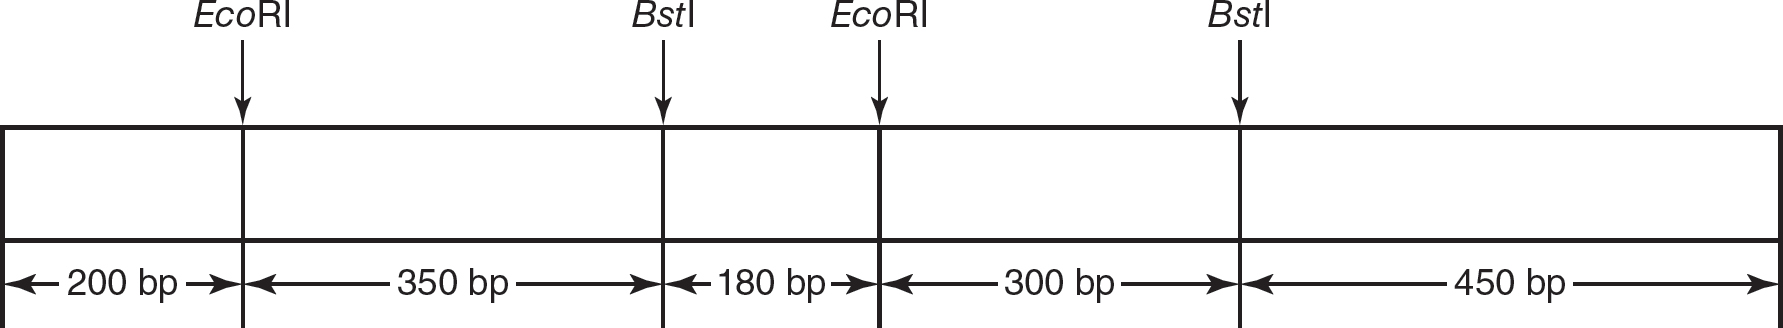
Choice (A) is incorrect because it lists the fragments that would be produced if the DNA was digested with only BstI. Choice (B) in incorrect because it lists the fragments that would be produced if the DNA was digested with only EcoRI. Choice (D) is incorrect because it does not take into account that when both restriction enzymes are used, several of the larger original fragments will be cut and produce smaller fragments.
8.(B)The frequency of the recessive phenotype = q2. If q2 = 0.20, then the frequency of the recessive allele is q = 0.447. If the population is in Hardy-Weinberg equilibrium, the allele frequencies will not change, so q will still be 0.447 after three generations.
9.(C)p + q = 1, so if q = 0.447, then p = 0.553. The frequency of the heterozygotes is 2pq = 2(0.553)(0.447) = 0.494. If the population is in Hardy-Weinberg equilibrium, the allele frequencies will not change, so the frequency of the heterozygotes will still be 0.494 after three generations.
10.(B)An appropriate control for an experiment investigating the effects of different salt concentrations would keep the same starting concentration of the substrate, the same pH and temperature conditions, but would not include salt. Choice (A) is incorrect because using a different salt (with possibly different properties) would confound the results of the experiment. Changing the temperature could affect the results, so choice (C) would not be an appropriate control. Replacing the enzyme solution with water would be an appropriate control for studying the effects of enzyme concentration but would not be an appropriate control for studying the effects of salt concentrations, so choice (D) is incorrect.
Short Free-Response
11.(a)The light source simulates sunlight and functions as a source of light energy for photosynthesis.
(b)Plants capture light energy when photons excite electrons in pigments, such as chlorophyll.
(c)There would be less biomass and probably some dead plants and larvae on January 3rd.
(d)Without light energy, the plants could not perform photosynthesis. Without photosynthesis, there would be no stored organic molecules for the larvae to eat.
12.(a)The genetic code is redundant: more than one codon can code for an amino acid. So two organisms could have the exact same amino acid sequence for a protein but have slightly different DNA sequences in the gene coding for the protein.
(b)The more homology (common sequences) between the DNA sequences of organisms, the more recently they shared a common ancestor. This information could be used to develop phylogenetic trees.
(c)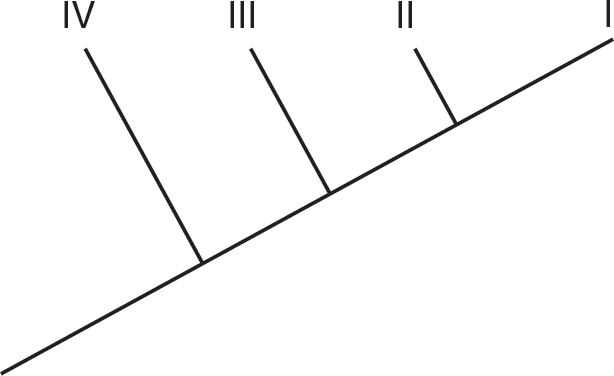
(d)Morphology (body characteristics) and fossil evidence could also be used to generate phylogenetic trees.
Long Free-Response
13.(a)Artificial selection was used in this experiment because the students selected for desired traits and chose which plants would survive and reproduce.
(b)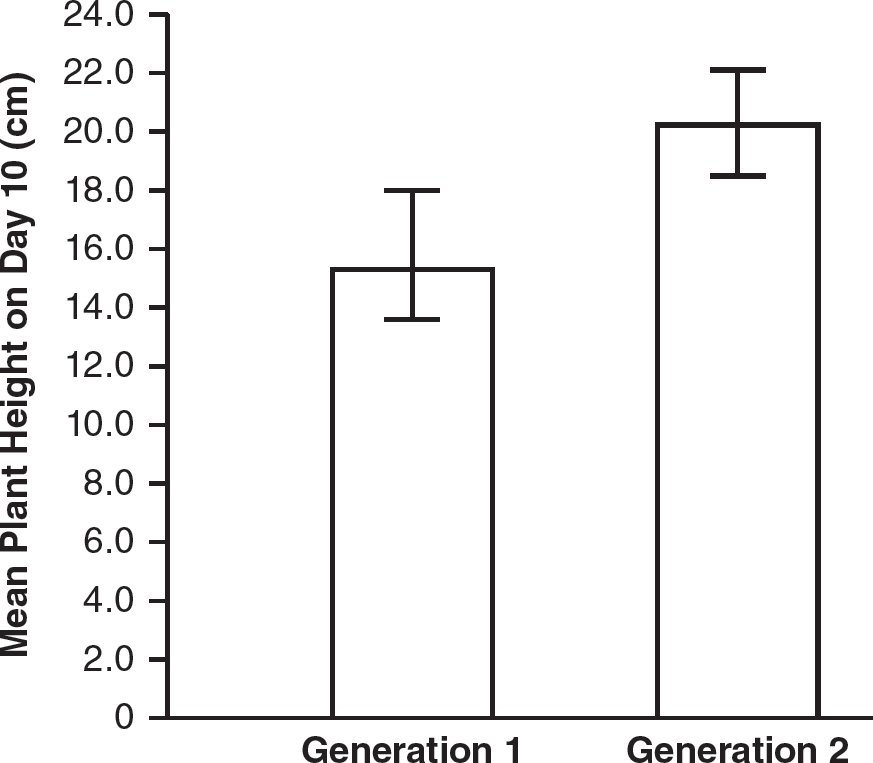
(c)There is likely a statistically significant difference between the two groups because the 95% confidence intervals (CI) of Generation 1 and Generation 2 do not overlap (the upper limit of the 95% CI for Generation 1 is 15.8 + 2(1.1) = 18 and the lower limit of the 95% CI for Generation 2 is 20.3 — 2(0.9) = 18.5).
(d)The mean plant height for Generation 3 would likely be less than the mean plant height for Generation 2 because during this instance of artificial selection, only the plants with the combination of gene(s) for short height were allowed to breed.