Biology For Dummies
Part II Cell Reproduction and Genetics: Let’s Talk about Sex, Baby
Chapter 7
Making Mendel Proud: Understanding Genetics
In This Chapter
Defining heritable traits and why sexually reproducing organisms are so diverse
Exploring Mendel’s discoveries about inheritance
Mastering the lingo of genetics
Walking through the process of studying human traits
Genetics is the branch of biology that looks at how parents pass traits on to their offspring. It all started more than 150 years ago when a monk named Gregor Mendel conducted breeding experiments with pea plants that led him to discover the fundamental rules of inheritance. Although Mendel worked with peas, his ideas explain a lot about why you look and function the way you do.
In this chapter, we show you one of Mendel’s experiments and present some of the most important rules of inheritance.
Why You’re Unique: Heritable Traits and the Factors Affecting Them
Dogs have puppies, hens have chicks, and your parents had you. What do all three sets of parents have in common? They all passed their traits on to their offspring. Traits that are inherited from one generation to the next are called heritable traits.
When living things reproduce, they make copies of their DNA and pass some of that DNA on to the next generation. The DNA is the genetic code for the traits of the organism (see Chapter 3 for more on DNA), which means the characteristics of the next generation are built from the parents’ blueprints. Of course, in sexually reproducing species, offspring aren’t exactly like their parents for several reasons:
Offspring receive half of their genetic information from their father and half from their mother. Parents divide their genetic information in half through the process of meiosis (described in Chapter 6), producing sperm cells and egg cells that join to form a new individual. So each offspring brings together a potentially new combination of its parents’ traits. Plus, each sperm and egg are a little bit different from the others due to crossing-over and independent assortment (we cover these causes of genetic variation in greater detail in Chapter 6), which shuffle up the genetic information as it’s packaged into the sperm and eggs. The result is that there really is only one you — even if you have siblings, you’re all a little bit different.
Even heritable characteristics can change slightly. DNA changes slightly every time it’s copied due to mutation (see Chapters 6 and 8 for the full scoop on mutation). If a mutation is passed from parent to offspring, the offspring may have a new trait. For instance, Queen Victoria of England had children and grandchildren who suffered from hemophilia, a deadly disease in which your blood doesn’t clot properly, but none of her ancestors had the disease. One possibility for why Queen Victoria’s children acquired the disease is that a mutation occurred in the DNA of one of Queen Victoria’s parents, who then passed that mutation on to her. Queen Victoria didn’t have the disease, but she passed the mutation on to several of her children. Her sons who received the mutation suffered from the disease, and her daughters passed the mutation on to their children.
Some traits are acquired rather than inherited. Riding a bicycle, speaking French, and swimming are all acquired traits, abilities you aren’t born with but that you gain during your lifetime. Even if your parents can do these things, you still have to figure out how to do them on your own. For example, you aren’t born with the natural ability to swim (unless of course you’re a fish).
Some inherited traits are affected by the environment. The basic color of, say, your skin or hair is written in the code of your DNA, but if you spend lots of time basking in sunlight, your skin will grow darker, and your hair will become lighter. Even something like height can be affected by your environment — your DNA controls your basic height, but nutrition plays a big role in whether you reach your full potential.
“Monk”ing Around with Peas: Mendel’s Laws of Inheritance
People have probably always realized that parents pass traits on to their children. After all, as soon as a new baby is born, people start trying to decide who the baby looks like. Yet the first person who really figured out the fundamentals of how traits are passed down was an Austrian monk named Gregor Mendel.
Mendel lived in the mid-19th century. During his time, people believed in blending inheritance, meaning they thought that the traits of a father blended with the traits of a mother to produce children whose traits were supposed to be the averages of the parents’ traits. So a tall father and a short mother were expected to have average-size kids. (If the concept of blending inheritance were correct, no one could ever have a child that was taller than his or her parents.)
Mendel, who was very interested in science and math, tested these ideas about inheritance by breeding pea plants in the abbey garden. He studied many of the heritable traits of peas, including flower color, pea color, plant height, and pea shape. Although other people had bred plants and animals for desirable characteristics before, Mendel was extremely careful in his experiments and used math to look at inheritance in a new way, revealing patterns that no one else had noticed. We walk you through the basics of Mendel’s experiments and the results they produced in the next sections.
Pure breeding the parentals
Mendel used pure-breeding plants (plants that always reproduce the same characteristics in their offspring) to ensure that he knew exactly what genetic message he was starting with when he chose a particular plant for his experiments. In other words, if he chose a tall plant, he wanted to know for sure that the plant had genetic messages for the tall trait only.
To make pure-breeding plants for his experiments, Mendel self-pollinated plants that had the characteristic he wanted to study, weeding out any offspring that were different until all the offspring always had his chosen characteristic. (Pea flowers have both male and female parts, so they can be self-pollinated to produce offspring.) For example, Mendel self-pollinated tall pea plants, pulling out any short offspring until he had plants that would produce only tall offspring. He did the same thing for short pea plants, self-pollinating them until they bred purely short offspring.
 Pure-breeding organisms that are used as the parents in a genetic cross are called parentals, or the P1 generation.
Analyzing the F1 and F2 generations
In one of his experiments, Mendel bred tall pea plants with short pea plants. According to the idea of blending inheritance, all the offspring should have been average in height. However, when Mendel mated his parentals and grew the offspring, called the F1 generation, all the offspring were tall. It almost seemed like the short characteristic had disappeared, but when Mendel mated tall pea plants from this new F1 generation and grew their offspring, he saw both tall and short pea plants, indicating that the short characteristic had merely been hidden. The second generation, called the F2 generation, had about three times as many tall pea plants as short pea plants.
 The F1 and F2 generations get their names from the word filial, which means “something that relates to a son or daughter.” Consequently, the F1 generation is the first generation of “sons and daughters” from the parentals, and the F2 generation is the second generation.
Reviewing Mendel’s results
The results of Mendel’s pea plant experiments were very exciting because they didn’t follow what was expected. In other words, they revealed something new about inheritance.
From his results, Mendel proposed several ideas that laid the foundation for the science of genetics:
Traits are determined by factors that are passed from parents to offspring. Today, people call these factors genes.
Each organism has two copies of the genes that control every trait. Parents pass one copy of each gene on to their offspring. The offspring winds up with two copies of each gene because it gets one copy from mom and one copy from dad.
Some variations of genes can hide the effects of other variations. Variations that are hidden are recessive, whereas variations that hide other variations are dominant. In Mendel’s cross between tall and short pea plants, the tall characteristic hid the short characteristic; therefore the tall gene was the dominant one.
The genes that control traits don’t blend with each other, nor do they change from one generation to the next. Mendel knew this because the short characteristic, which had disappeared in the F1 generation, reappeared in the F2 generation.
Sexually reproducing organisms have two copies of every gene, but they give only one copy of each gene to their offspring. Mendel said that this is because the two copies of genes segregate (separate from each other) when the organisms reproduce. Scientists now call this ideaMendel’s Law of Segregation.
Diving into the Pool of Genetic Terminology
Mendel’s fundamental ideas have stood the test of time, but geneticists have discovered a great deal more about inheritance since Mendel’s day. As the science of genetics grew and developed, so did the language used by geneticists.
A few key genetics terms are particularly useful when talking about inheritance:
Genes: Defined as factors that control traits, each gene is a section of nucleotides along the chain of DNA in a chromosome (refer to Chapter 4 for more about chromosomes). Some genes are thousands of nucleotides long; others are less than a hundred. Your cells have about 25,000 different genes scattered among your 46 chromosomes. Each gene is the blueprint for a worker molecule in your cells, usually a protein. Genes determine protein shape and function, and the actions of proteins control your traits.
For example, the darkness of your skin, hair, and eyes is determined by how much of the brown pigment melanin is deposited there. Proteins called enzymes help make the melanin, and other proteins help deposit the melanin in the right locations. If your genes contain the code for proteins that do these jobs well, your coloring is darker. If your genes code proteins that don’t make as much melanin or don’t deposit it in your skin, hair, or eyes, your coloring is lighter.
Alleles: Different forms of a gene are called alleles; they explain why Mendel saw both tall and short pea plants. Logically, the gene that controls pea plant height has two variations, or alleles — one for tallness and one for shortness. Plants with two alleles for tallness are tall; plants with two alleles for shortness are short. As Mendel saw, plants that have one of each kind of allele are also tall, indicating that the tall allele can hide the effects of the short allele. In other words, the allele for tall is dominant to the allele for short in pea plants.
In people, alleles for dark coloring are usually dominant to alleles for lighter coloring. So, for a gene that controls skin color, alleles for dark color are dominant to alleles for light color. The color of any individual person’s skin depends on his or her unique combination of light and dark alleles.
Loci: These are the locations on a chromosome where genes are found. Each gene is located at a specific place, or locus, on its chromosome. In organisms of the same species, the same gene is found at the same locus in every organism. In humans, for example, each gene is found on the same chromosome in all people. The gene for blood type A, B, or O is always found on the same locus on Chromosome 9, and the gene for cystic fibrosis is always found on the same locus on Chromosome 7.
Many human traits aren’t controlled by just one gene. Traits such as your height, weight, and the color of your skin, hair, and eyes result from the interaction of several genes. These traits are called polygenic traits (poly means “many,” and genic means “genes”). Polygenic traits usually show a wide range of variety in the population. Pea plants, for example, are either short or tall with nothing in between, whereas adult humans range over a wide variety of heights. This difference is because human height is polygenic and pea height is controlled by just one gene.
Bearing Genetic Crosses
Geneticists use their own unique shorthand when analyzing the results from a genetic cross (a mating between two organisms with characteristics that scientists want to study). They use a letter to stand for each gene, capitalizing the letter for dominant alleles (for a definition of alleles, see the preceding section). The same letter of the alphabet is used for each allele to show that they’re variations of the same gene.
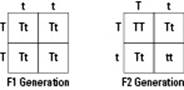
For the cross Mendel did between tall and short pea plants, see the earlier “‘Monk’ing Around with Peas: Mendel’s Laws of Inheritance” section for more on this experiment, the letter T can be used to represent the gene for plant height. In Figure 7-1, the dominant allele for tallness is shown as T, whereas the recessive allele for shortness is shown as t.
Figure 7-1:Mendel’s crossbetween tall and short pea plants.
Geneticists also have special terms for describing the organisms involved in a genetic cross. Here they are:
Genotype: The combination of alleles that an organism has is its genotype. The genotypes of the two parental plants shown in Figure 7-1 are TT and tt.
Phenotype: The appearance of an organism’s traits is its phenotype. The phenotypes of the two parental plants shown in Figure 7-1 are tall and short.
A tool called a Punnett square helps geneticists predict what kinds of offspring might result from a particular genetic cross. In Figure 7-1, a Punnett square shows the cross between the peas of the F1 generation. The alleles that each parent can contribute to the offspring are written along the sides of the square where it says Sperm and Eggs. All possible combinations of alleles that could result from the meeting of sperm and egg are drawn within the square.
If Mendel had used modern genetic notation and terminology, he might have analyzed his experiment like this (look to Figure 7-1 for reference if you need it):
1. The parental pea plants are purebred, so they have only one type of allele, but each individual plant has two alleles for each gene. The tall parent’s alleles are shown as TT, and the short parent’s alleles are shown as tt. Because both of their alleles are the same, the parental pea plants are homozygous for the plant height trait (homo- means “same,” and zygous comes from a Greek root that means “together”).
2. Each parental pea plant gives one allele to each offspring. Because the parentals are purebred, they can give only one type of allele. Tall pea plant parents always give a copy of the tall allele (T) to offspring, and short parents always give a copy of the short allele (t). Copies of these alleles are packaged into gametes (sperm and egg cells) as the pea plants reproduce.
3. The sperm and egg of the parents combine, giving their F1 offspring two alleles for the height gene. All the F1 offspring have one copy of each allele, so their alleles are written as Tt. Because their alleles are different, the F1 pea plants are heterozygous for the plant height trait (hetero- means “other”). Although the F1 plants are heterozygous, they should all look tall because the tall allele is dominant to the short allele. This is exactly what Mendel saw — the short trait from his parentals seemed to disappear in the F1 generation.
4. When F1 plants are crossed, they can each make two kinds of gametes — those that carry a dominant allele and those that carry a recessive allele. To figure out all the possible combinations of offspring the F1 plants could have, you use a Punnett square like the one shown in Figure 7-1.
5. The completed Punnett square in Figure 7-1 predicts that the F2 offspring will have three different genotypes: TT, Tt, and tt. For every one TT offspring, there should be two Tt offspring and one tt offspring. In other words, the genotypic ratio (the ratio of expected numbers of genotypes for the cross) predicted for the F2 generation is 1:2:1 for TT:Tt:tt.
6. The tall allele is dominant to the short allele, so F2 plants that are TT or Tt will be tall, and only F2 plants that are tt will be short. So, the Punnett square predicts that for every three tall plants, there’ll be just one short plant. In other words, the phenotypic ratio (the ratio of expected numbers of phenotypes for the cross) for the F2 generation is 3:1 for tall:short. This is precisely what Mendel saw — for every one short plant he saw in his F2 generation, he saw about three tall ones.
When two organisms that are heterozygous for one trait are crossed with each other, that combination is called a monohybrid cross. (Mono- means “one,” and hybrid means “something from two different sources,” so a monohybrid is an organism that has two different alleles for one trait.) The cross between F1 pea plants in Figure 7-1 is an example of a monohybrid cross.
Studying Genetic Traits in Humans
One of the reasons plants make good subjects for genetic studies is because you can control their mating. From a genetics standpoint, humans aren’t nearly so cooperative. Also, humans don’t produce as many offspring as plants do, and human children take a very long time to grow up so you can evaluate the appearance of traits. Consequently, when geneticists want to study human traits, they have to rely upon families that already exist.
The sections that follow show you how geneticists go about studying family trees and how they test for different inheritance scenarios. You also find out the conclusions geneticists have made about dominant and recessive traits in humans.
Creating pedigree charts
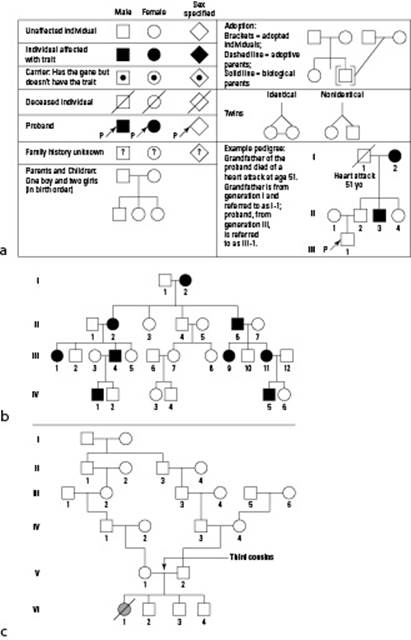
The first steps in understanding the inheritance of a human trait are to gather information on which people in a family have the trait and record that information in a geneticist’s version of a family tree, which is called a pedigree chart. The symbols in a pedigree chart (see Figure 7-2a) represent information about the family and the trait being studied.
Squares indicate males; circles indicate females.
A line drawn between two symbols represents marriage.
A line drawn down from a marriage indicates that the marriage produced a child. Children are arranged in birth order from left to right.
A filled-in symbol indicates people whose traits are being studied; an open symbol is used for people who don’t have those traits.
A diagonal line through a symbol represents someone who is deceased.
Roman numerals shown to the left of each row represent the different generations. Each person in a generation is assigned an Arabic number so that any person in a pedigree chart can be identified by the combination of his or her generation number and individual number. The deceased person in Figure 7-2c, for example, is identified as Individual VI-1.
By studying a pedigree chart, geneticists can often figure out whether a trait is caused by a dominant or recessive allele. The trait shown in Figure 7-2c, for example, must be caused by a recessive allele. The symbol of Individual VI-1 is shaded, which means this person had the trait being studied. However, neither of this person’s parents shows the trait. The parents must have carried the allele because children get their alleles from their parents, but the allele wasn’t visible in either parent. When an allele is present but not seen in a person’s phenotype, the trait must be recessive.
Figure 7-2:Human pedigree charts and symbols.
Testing different inheritance scenarios
One pedigree chart alone doesn’t always provide enough information to determine the inheritance pattern of a trait. In order to test whether a particular type of inheritance works for a pedigree, follow these steps:
1. Decide which type of inheritance you want to test.
Say, for example, that you want to test the hypothesis that the trait in Figure 7-2b is caused by a dominant allele.
2. Set up your notation for the alleles.
If you’re testing to see whether the trait is dominant, then you can propose that A should represent the dominant allele and a should represent the recessive allele.
3. Assign genotypes to people whose genotype is certain.
Because you’re suggesting that the trait is dominant, then people who don’t show the trait must have two copies of the recessive allele. (If they had even just one copy of the dominant allele, then you’d see the trait, and their symbols would be shaded.) In Figure 7-2b, all the individuals with open symbols must be homozygous recessive, or aa. Write their genotypes under their symbols.
4. Work from the individuals whose genotypes are certain to figure out the genotypes of the other individuals.
Use the clues of parents and other children to figure things out. For example, Individual I-2 has the trait, which means she must have at least one copy of the dominant allele. Right away you know that her genotype is A– (the dash represents her second, unknown allele). To figure out her second allele, look at her children. If she was homozygous dominant, or AA, then she could only ever give one type of allele to her kids — the A allele. Because you’re testing whether this trait could be dominant, then any kid who has even just one A is going to show the trait. However, two of I-2’s children don’t have the trait. Consequently, she must be able to give the little a allele too, which makes her genotype Aa.
 If you can’t figure out someone’s complete genotype by looking at the genotypes of people whose information is certain, you can leave a dash in that person’s genotype to represent the uncertain allele.
5. If you find a place in the pedigree chart where the genotypes of parents and children have a conflict, you must reject your hypothesis about the inheritance of the trait.
For example, if you proposed that the trait in Figure 7-2c was caused by a dominant allele, then Individual VI-1 would have to have had at least one dominant allele. This is impossible because neither of VI-1’s parents shows the trait, and one of the parents would have to carry at least one dominant allele in order to pass that on to VI-1. Because the proposed genotypes are impossible, you must reject the hypothesis that this trait could be carried by a dominant allele.
The trait shown in Figure 7-2b looks like it’s caused by a dominant allele because someone in every generation has the trait. In other words, the trait never hides like a recessive trait does. However, from just this one pedigree chart, you can’t be absolutely sure. If you set up a hypothesis that the trait is recessive and test your idea using the preceding steps, you can give everyone a genotype without encountering an impossible conflict. In situations like this one, in which more than one type of inheritance is possible based on one pedigree chart, geneticists gather more information from other families. In fact, sometimes they have to study many pedigrees before they can prove the inheritance of a particular trait.
Drawing conclusions about traits
In general, dominant and recessive inheritance show two distinct patterns in a human pedigree:
Traits carried by recessive alleles often skip generations. For example, a red-headed child may have a red-headed grandparent but blonde-haired parents. Any time parents who don’t show a certain trait have children who do show the trait, that’s proof of a recessive trait.
Traits carried by dominant alleles often show up in every generation. Brown-eyed parents who have more than one child usually have some children with brown eyes. However, people showing the dominant brown-eyed trait may have only one copy of the dominant allele, so they could potentially pass on recessive alleles to their children. This fact is why two brown-eyed people can produce some blue-eyed children. In fact, whenever two parents who show a particular trait have kids who don’t show the trait, then you know for sure that the trait is dominant.