The MCAT Chemistry Book - Aryangat A. 2012
Organic Chemistry
Separation, Purification, and Structural Analysis of Organic Compounds
A. INTRODUCTION
For the MCAT, we should be familiar with the basic features of separation and purification of organic compounds. In this chapter, we will review some of the techniques that are commonly used by organic chemists.
B. EXTRACTION
Simple extraction involves the mixing of the organic solution with water in a separating funnel. Thorough mixing of the two phases (organic and aqueous) is done, and then the mixture is allowed to settle for sometime until the two phases separate. Then the lower layer can be poured into another flask. This procedure can separate water soluble impurities such as inorganic salts, low molecular weight carboxylic acids, and alcohols. Similarly, extraction can be done with dilute aqueous acids to remove organic bases, and with dilute aqueous bases to remove organic acids.
C. CRYSTALLIZATION
Organic compounds (solids) can be purified by a method called crystallization. Crystallization works by dissolving the material to be purified in a solvent (under hot conditions), followed by slow cooling of the solution. If the impurities are also soluble just like the substance we are purifying, obviously the purification will not be that effective. After the crystallization by slow cooling is completed, the crystals are collected by vacuum filtration. Then the crystals are dried.
Qualities of the Solvent Used for Crystallization
(i) The compound that is purified should be soluble in the selected solvent, only at high temperatures. At low temperatures, the compound should be insoluble.
(ii) The solvent used should have a relatively low boiling point. The boiling point of the selected solvent should not be higher than the melting point of the compound to be purified.
Solubility depends on the polarities of the solute and the solvent. According to the principle “like dissolves like,” if the solute is polar, the solvent required should be polar too. On the other hand, if the solute is nonpolar, a nonpolar solvent should be used.
Some of the solvents commonly used for crystallization include acetone, chloroform, methanol, benzene, diethyl ether, carbon tetrachloride, and water.
D. DISTILLATION
Distillation is a technique that can be employed if the compounds to be separated have reasonably different boiling points. Distillation involves boiling of the mixture to vaporize it. This is followed by condensation to get the distillate. The distillates are eventually collected in the order of their condensation. There are different types of distillations.
Simple distillation is used to separate compounds, which have boiling points that sufficiently differ (difference of about >500C).
Vacuum distillation is used for the separation of compounds that have very high boiling points.
Fractional distillation is used for the separation of compounds that have very close boiling points.
E. CHROMATOGRAPHY
Chromatography is a popular and widely used method of purification. Chromatography is based on the differences in the adsorption and the solubility of the compounds to be separated. It involves two phases — a stationary phase and a moving (mobile) phase. The moving phase actually carries the compounds along the stationary phase. Depending on the interactions between the compounds and the stationary phase, the compounds get held up or slowed down by the stationary phase.
Thin-layer Chromatography (TLC)
Thin-layer chromatography is used for the separation of small quantities of the desired compound, especially for qualitative analysis. It is a widely used technique. In TLC, the liquid (mobile) phase is allowed to run along a layer of adsorbent. This thin layer of adsorbent (usually alumina or silica gel) is usually coated on a plate. After the sample (mixture dissolved in a solvent) is put onto the plate (usually a spot of sample is placed at the bottom of the plate), the plate is held vertical with a small amount of the solvent just touching the bottom of the plate. Due to capillary action, the solvent will ascend up the plate.
The sample will be separated between the various phases. The separation occurs as a result of differences in the rate of mobilities of the individual components of the sample. This is because of the difference in the affinities of the solute with respect to the two phases. As a rule of thumb, the higher the polarity of the compound (component) is, the lesser the rate of upward mobility of that compound. This generalization is based on the fact that the stationary phase used is highly polar. Polar substances bind strongly to the stationary phase. Also, the moving phase generally used is less polar with respect to the adsorbent. The separated and migrated components will appear as a series of spots on the plate. If the components are colorless, certain reagents are used to make the spots visible. Choosing the correct solvent is extremely important, and is best achieved by experience. Sometimes the best choice of solvent can be attained only by trial and error.
Rf value is the ratio of the distance traveled by a compound to the distance traveled by the solvent.
Using known Rf values of compounds under the same conditions, we can make sure that the desired compound is present in the mixture and can be separated. Rf value is a constant (under specific conditions) for a given compound, and if the TLC is done exactly under the same conditions specified, we can be reasonably sure about the identity of the compound. Keep in mind that it is always safe to make sure of the identity of a compound with other qualitative analysis as well.
In addition to the function of identifying compounds, TLC is also used to monitor the progression of reactions, and to test the authenticity or the effectiveness of other separation techniques.
Gas-liquid Chromatography (GLC)
As the name implies, a gas phase (moving phase) and a liquid phase (stationary phase) are involved in gas-liquid chromatography. Gas-liquid chromatography is usually employed for the separation of volatile compounds. The device used for this is called a gas chromatograph. Usually a syringe is used to inject the sample into the device, and the sample injected is readily turned into vapor form. This vaporized form of the sample is carried along the flow of an inert gas. The sample is passed through a column containing the adsorbent (liquid-stationary phase). The column is the site where the separation of the components occurs. The separated samples as they emerge from the column are detected using a detection device.
The maintenance of the correct temperature of the column is extremely important for an efficient separation of the components. The choice of the stationary liquid phase is also important, and so is the maintenance of an optimum rate of flow of the sample through the column. The latter can be maintained by controlling the flow of the carrier gas. This technique is highly sensitive. Hence, it can be used to detect compounds even if very little of the compound is present (as low as in the order of micrograms).
Technological developments in the field of identification of compounds using infra red and NMR techniques have revolutionized the ease with which we can analyze and identify even the most complex structures in organic chemistry. For the MCAT, we should be familiar with the techniques and the basic principles that are used in this field.
F. INFRARED (IR) SPECTROSCOPY
Infrared spectroscopy is a widely used tool to identify and analyze compounds. As you know, the infrared radiation is part of the electromagnetic spectrum. The IR has wavelengths between those of the visible light and the microwaves. From the analytical point of view, only a portion of the entire infrared range is actually useful for the spectroscopic analysis.
In order to analyze organic compounds, certain properties at the molecular level are put to use in the infrared spectroscopy. In this technique, the infrared light is passed through organic compound samples. By doing this, some of the frequencies are absorbed by the sample and the other frequencies simply pass through. The percentage absorbance or transmittance is plotted against the frequency or, to be more precise, the wave number. The wave number (cm-1) is the reciprocal of wavelength expressed in centimeters. The plot can be used to analyze the structure of a compound by identifying the peaks that are characteristic to the groups present in the compound.
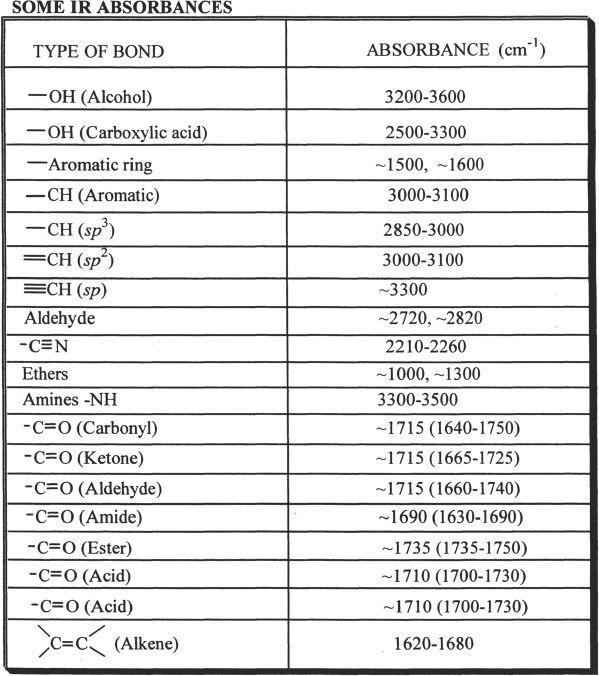
For example, the carbonyl group (>C=O) shows absorbance close to 1700 cm-1 in the IR spectrum. The peaks around this value indicate the presence of carbonyl group in the compound that is analyzed. By knowing the IR values, we can predict the structure of a compound. Our discussion from the MCAT point of view will be limited to some of the common and important IR peaks.
Other very complex IR diagrams can only be interpreted by skilled and experienced professionals.
Vibrational Modes
Chemical bonds have characteristic natural frequencies with which they vibrate (bending and stretching) in certain specific energy levels. The special range of frequencies used in IR spectrometry is within the range of the natural vibrational frequencies of the bonds in organic compounds. By looking at the peaks, we can tell whether a particular functional group is present or absent in the compound that we are analyzing. The bonds present in the molecules of the sample vibrate when they absorb characteristic frequencies.
Molecules are always in a state of vibration. The bonds present in molecules have their own unique stretching and bending modes. Let’s consider a hypothetical molecule A which has n atoms per molecule. Then, theoretically molecule A will have 3n — 6 modes of vibration. But this does not mean that the vibrational modes strictly follow this rule. Some of the vibrational modes have frequencies that do not coincide with the frequencies of the IR that we use. We will consider the vibrational modes of the methylene group.
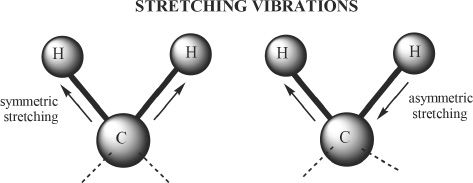
Figure 32-1
The stretching vibrational modes of methylene group. The two drawings show stretching vibrations — symmetric (on the left) and asymmetric on the right.
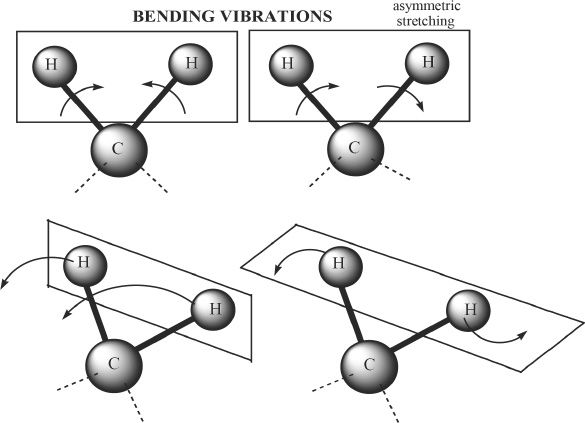
Figure 32-2
The bending vibrational modes of methylene group The top two diagrams from the left are scissoring and rocking modes. The bottom two diagrams show wagging and twisting modes.
Besides the fundamental vibrational frequencies, overtones and combination tones can appear in the IR spectrum. For example, the overtone of a carbonyl group can appear close to 3400cm-1 (the carbonyl peak is close to 1700 cm-1). Combination frequencies are peaks that appear when two frequencies intermingle, resulting in two weak frequencies.
Table 32-1
Example 32-1
Analyze the IR diagram shown below.
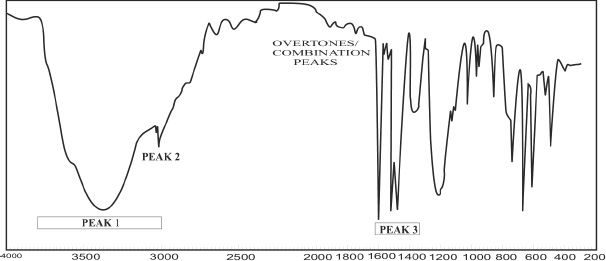
The given IR spectrum is that of phenol. Look at some of the important peaks that are present in this IR spectrum of phenol.
Analysis:
1) The peak 1 around 3400 cm-1 represents the peak caused by the -OH group.
2) The peak 2 at 3050 cm-1 represents the aromatic -CH.
3) The peak 3 denotes the benzene ring stretch.
Problem 32-1
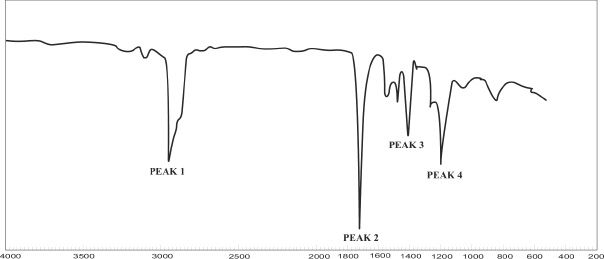
In the IR spectrum shown above, identify the most likely peak which represents the carbonyl group.
Solution:
The carbonyl peak is roughly around 1700 cm-1. So Peak 2 indicated in the IR diagram is the correct answer.
G. NUCLEAR MAGNETIC RESONANCE (NMR) SPECTROSCOPY
Nuclear magnetic resonance spectroscopy (NMR) is a type of analysis with which we can identify the positions of certain atoms in a compound. Only those atoms which possess nuclear spinning properties can exhibit NMR behavior. NMR spectroscopy is based on the magnetic properties exhibited by the nuclei of certain atoms. We will limit our discussion to the resonance spectroscopy (proton NMR) involving the nuclei of hydrogen atoms. With proton NMR, we can find or recognize the characteristic groups in the unknown compound, to which the specific protons are attached. In addition, we can also identify the number of different types of equivalent protons in a compound that we are analyzing.
The Basics of Proton NMR
The nucleus of an atom has an electric charge. Nuclear spin properties lead to nuclear magnetic moments. When hydrogen nuclei are exposed to a magnetic field, the nuclei will align themselves in coherence with the applied magnetic field as if they were tiny magnets. The alignment can be either along or opposite to the direction of the applied magnetic field. Among these two orientations, the one with the lower energy occurs when the alignment is along the direction of the field compared to the other orientation.
When sufficient energy (in the form of radio-frequency of the electromagnetic spectrum) is applied, the nuclei that are aligned along the magnetic field can reverse their orientation to align opposite to that of the applied magnetic field. The extent to which the nucleus is shielded from the magnetic field dictates the amount of energy required to change the orientation to a higher energy level. Based on this principle, we have to understand that depending on the extent of shielding they will absorb different frequencies. The energy that is absorbed is monitored and is recorded in the form of NMR spectrum. Thus protons in different regions of a molecule have different shifts (chemical shifts).
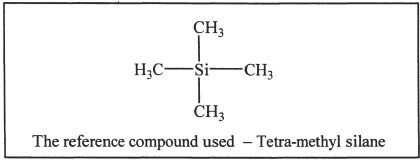
For the standard applied magnetic field, the absorption of frequencies differ only in terms of a few parts per million (ppm). In NMR spectroscopy, the relative standard molecule used is tetramethyl silane (TMS), and thus chemical shift (d) is measured in ppm relative to the proton signal of TMS. Note that all the protons of TMS are equivalent, and thus have the same frequency of absorption, and it is considered to have a standard arbitrary value of “0 ppm” — the reference standard.
Spin-Spin Coupling
Spin-spin coupling results from the possibility of the coupling of the neighboring protons. Signals often appear as groups of peaks as a result of spin-spin coupling. This results in what is called signal multiplicity. The number of peaks in a signal is dictated by the following means. Consider this hypothetical situation. Let’s say there are N1 equivalent protons in set 1, and N2 equivalent protons in the adjacent carbon (set 2). (Note: Equivalent protons do not split themselves.) If this is the case, signal 1 will have (N2 + 1) peaks, and signal 2 will have (N1 + 1) peaks. The intensities of a split pattern are symmetrical (bilaterally symmetrical). The relative intensities of the peaks in a signal follow a pattern. A singlet has only one peak. There is no splitting in singlets. So there is no relative ratio to compare with. A doublet has a 1 : 1 proportion of relative intensities. A triplet has 1 : 2 : 1 proportion of relative intensities. A quartet has 1 : 3 : 3 : 1 proportion of relative intensities, and so on.
The different types of equivalent protons reflect the total number of signals. In the NMR spectrum of a compound, the levels of intensities of the signals denote the proportion of equivalent protons present in the compound. For example, the intensity of a signal resulting from six equivalent protons will be greater than the intensity of a signal resulting from two equivalent protons. The intensity is equivalent to the areas under the signals, and is proportional to the number of protons creating that particular signal.
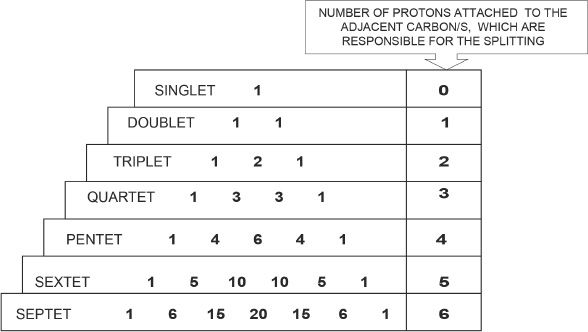
Figure 32-3 Relative intensities of the peaks
Proton Chemical Shifts
Table 32-2
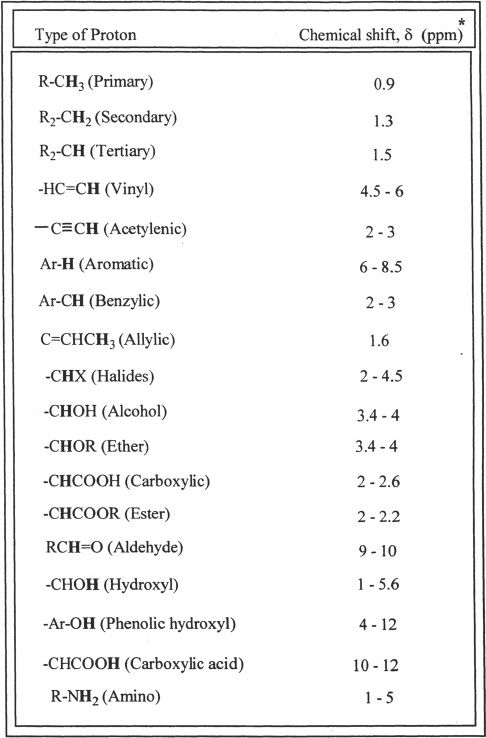
*Approximate values with respect to TMS
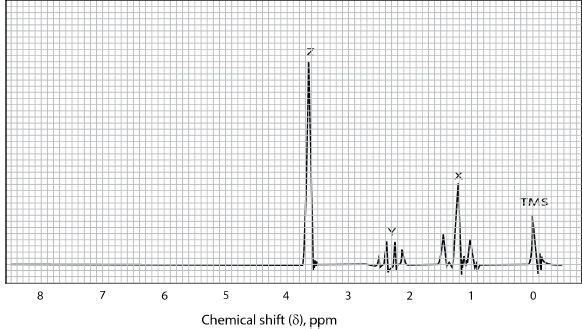
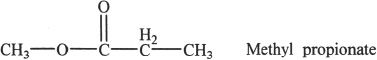
Figure 32-4 The NMR spectrum of methyl propionate
Look at the NMR spectrum of methyl propionate given in Figure 32-4.
In the NMR spectrum, the signal at 0 ppm represents tetra methyl silane (standard). There are three distinct signals (sets of peaks). Altogether, there are 8 peaks — a set of three just after 1 ppm, a set of four just after 2 ppm, and a single peak around 3.5 ppm, totaling eight peaks. The set X is a triplet. The set Y is a quartet, and the set Z is a singlet. Sometimes it is hard to recognize the peaks distinctly because of interference between the nuclei, especially when there are multiple number of peaks.
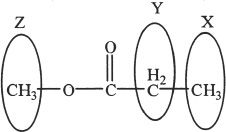
In methyl propionate, there are three different types of protons denoted by X, Y, and Z. In the NMR spectrum, the set X is represented by the triplet in the nmr spectrum, the set Y is denoted by the quartet, and the set Z is denoted by the singlet.
CHAPTER 30 PRACTICE QUESTIONS
1. All the following are true regarding the process of crystallization, except:
A. The solvent used should easily dissolve the compound when cold.
B. Minimum amount of solvent should be used.
C. Crystallization process is generally used when there aren’t many impurities in the material purified.
D. Hexane is a good solvent that can be used to purify hydrocarbons.
2. Distillation is a very widely used technique for purifying compounds. Which of the following processes is involved?
A. Vaporization is involved.
B. Boiling is involved.
C. Condensation is involved.
D. All the above
Questions 3-8 are based on the following passage.
Passage 1
A set of qualitative experiments were conducted in an organic chemistry lab.
Experiment 1
Chemist 1 treated cyclohexene with 1% aq. KMnO4. One of the products was a cis-glycol.
Experiment 2
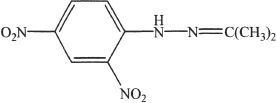
Chemist 2 conducted qualitative tests for some carbonyl compounds. Aldehydes and ketones gave a positive test for the reagent 2, 4-dinitro- phenyl hydrazine.
The compound tested for the confirmation was propanone. The product formed as a result of this test involving propanone is shown below.
Experiment 3
In Experiment 3, three compounds were tested. These three compounds were treated with concentrated hydrochloric acid in the presence of zinc chloride (ZnCl2). Compound A was ethyl alcohol, Compound B was tert-butyl alcohol, and Compound C was 2-propanol. The reactions were based on unimolecular substitution mechanism.
Experiment 4
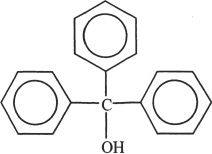
In Experiment 4, the chemists synthesized the following compound.
3. Based on Experiment 3, choose the true statement from the following choices.
A. Compound A had the fastest reaction rate among the compounds tested.
B. Compound B had the slowest reaction rate among the compounds tested.
C. Compound C did not undergo the reaction.
D. Compound A did not undergo the reaction.
4. In Experiment 2, which of the following IR peaks must have disappeared after the treatment of the compound with the reagent?
A. A broad IR band at 3400 cm-1
B. A peak at 1700 cm-1
C. A peak at 800 cm-1
D. All the above peaks will be present for the product formed as a result of the reaction with the reagent.
5. Which of the following best describes the process involved in Experiment 1?
A. Reduction
B. Esterification
C. Oxidation
D. Dehydrohalogenation
6. Which of the following is true regarding Compounds A, B and C?
A. They all have carboxyl groups.
B. They all have double bonds.
C. They all have IR peaks close to 3400 cm-1.
D. They all have the same reaction rate in terms of substitution reactions.
7. How many sets of peaks (signals) are expected for the Compound B?
A. 2
B. 3
C. 4
D. 10
8. Which of the following are true for the compound synthesized in Experiment 4?
I. The compound is insoluble in H2O.
II. The compound is soluble in 5% aqueous solution of NaOH.
III. The compound is an aromatic compound.
IV. The compound is a strong base.
A. I & II only
B. I & III only
C. II & IV only
D. II & III only