The MCAT Chemistry Book - Aryangat A. 2012
General Chemistry
Liquids, Solids, and Phase Transitions
A. INTRODUCTION
In this chapter, we will explore the other two important phases of matter; liquids and solids. From your own experience, you probably have noticed that it is easier to handle liquids and solids than to handle gases. Gases have negligible intermolecular interactions and attractive forces. But this is not the case with either liquids or solids. They both have much stronger intermolecular forces than gases. These forces make substances exist as liquids and solids. As we go along, we will explore the ideas such as hydrogen bonding, London dispersion forces, and dipole interactions.
In addition to just knowing these phases, you will have to know the different theories and their implications, and how to work with some of the formulas involved. We will review the different kinds of molecular interactions that dictate the phase characteristics of molecules. The phase diagram that is discussed in this chapter is also important from the MCAT point of view.
B. THE LIQUID STATE
Liquids are considered to be relatively incompressible. Unlike gas molecules, liquid molecules are tightly packed. Liquids have a fixed volume, whereas gases do not. Liquids do not have a definite shape. The properties of liquids can be attributed to the presence of various types of intermolecular forces.
C. INTERMOLECULAR FORCES
Intermolecular forces are weak attractive forces that contribute to many of the physical properties exhibited by liquids. From the MCAT point of view, you have to be familiar with the main three types of attractive forces:
1) Hydrogen bonding
2) Dipole-dipole interactions
3) London forces
Hydrogen Bonding
Hydrogen bonding is an intermolecular attractive force that exists between a hydrogen atom covalently bonded to an electronegative atom (fluorine, oxygen, nitrogen), and another electronegative atom (fluorine, chlorine, nitrogen) in the neighboring molecule. Hydrogen bonding in water is shown below:
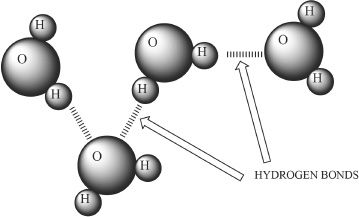
Figure 7-1 Hydrogen bonding in water
As you can see in Figure 7-1, the hydrogen which is covalently bonded to the electronegative atom (in this case it is oxygen), can undergo hydrogen bonding with an electronegative atom (the oxygen of another water molecule) present in the neighboring molecule.
Dipole-Dipole Interactions
Polar molecules have negative and positive polarity. This is because of the difference in electronegativities of the bonded atoms in such molecules. This polarity results in the formation of attractive forces among molecules. Such interactions are called dipole-dipole interactions. Consequently, the positive end of one molecule is attracted to the negative end of another. Figure 7-2 illustrates the dipole-dipole interactions between hydrogen chloride molecules.
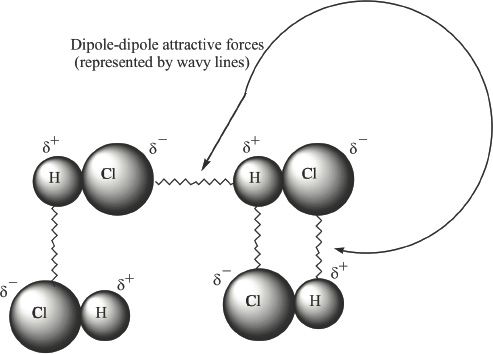
Figure 7-2 Dipole-dipole interaction between HCl molecules
London Forces
London forces are weak attractive forces that exist between instantaneous dipoles. What is an instantaneous dipole? In order to understand this, let us talk about atoms. Atoms have a central positively charged nucleus surrounded by electrons. These electrons are constantly moving and the electronic cloud may not be always perfectly distributed. In other words, the electrons at any given moment may be distributed more on one side and less on the other, creating an instantaneous dipole. The side which has more electrons at any moment will have a slight negative charge, whereas the side which is electron deficient will have a slight positive charge. The polarity that results from such charge separations in a molecule can induce polarity in other molecules when they are close enough to the instantaneous dipole molecule. For this reason, London forces are often called instantaneous dipole-induced dipole interactions. London forces are more pronounced in bigger molecules, because they are more polarizable.
Let us talk about the importance of these ideas. It is more likely that a polar molecule will exist as a liquid or solid than a nonpolar molecule. Why is it so? It is because of the intermolecular interactions that are possible among polar molecules.
D. THE SOLID STATE
A solid has a well-defined shape. Because of the tight packing of the molecules, solids can be considered almost incompressible. There are four types of solids:
1) Ionic solid
2) Metallic solid
3) Molecular solid
4) Network solid
Ionic Solid
An ionic solid consists of cations and anions which are held together by the electrostatic attraction between them. These attractive forces are very strong and thus ionic solids have high melting points. Sodium chloride (NaCl), and cesium chloride (CsCl) are examples of ionic solids.
Metallic Solid
A metallic solid consists of positive atomic cores surrounded by electrons. Almost all metals are solids at room temperature. The free electrons in metallic solids account for their superior electrical conductivity (e.g., iron, gold, silver).
Molecular Solid
A molecular solid consists of atoms or molecules held together by intermolecular attractive forces. In molecular solids, the attractive forces include hydrogen bonds and dipole-dipole forces (e.g., Ice [H2O (s)]).
Network Solid
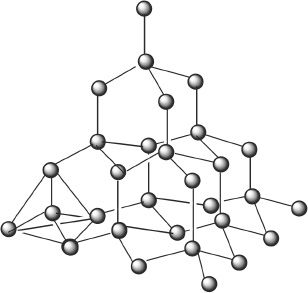
Figure 7-3 Structure of diamond
In a network solid, the atoms are held together by large networks of covalent bonds. A perfect example is diamond. Because of such an intricate network (see Figure 7-3) of covalent bonding through the entire crystal, the diamond crystal itself can be considered as one big molecule. Each and every carbon in a diamond is covalently linked to four other carbon atoms. For these reasons, network solids have very high melting points. Other examples of network solids include graphite and asbestos.
E. PHASE TRANSITIONS
Phase transition or change of state refers to the change of a substance’s phase from one state to another. In this section, we will talk about the different phase changes, the associated terminology, and the key ideas related to all these.
Types of Phase Transitions
There are different types of phase transitions. From the MCAT point of view, you should have a good grasp of phase transitions. Let’s look at the basic terminology.
The conversion of a solid to a liquid is called melting.
The temperature at which a substance changes from solid state to its liquid state is called its melting point.
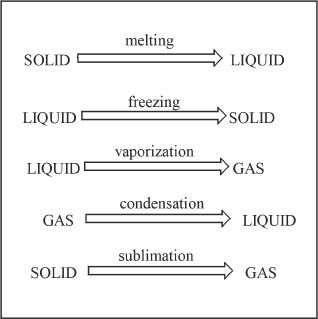
The conversion of a liquid to a solid is called freezing. |
The temperature at which a substance changes from liquid state to its solid state is called its freezing point. |
The conversion of a liquid to a gas is called vaporization. |
The temperature at which a substance changes from liquid state to its gas state is called its boiling point. |
The conversion of a gas to a liquid is called condensation. |
The direct conversion of a solid to a gas is called sublimation. |
F. HEAT TRANSFER
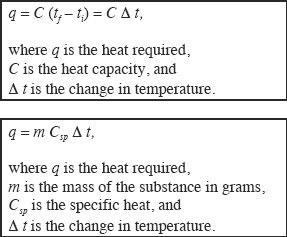
In order to increase the temperature of a substance, we have to supply heat. The heat that should be supplied to increase the temperature varies from one substance to another. So scientists have come up with a way to define this - the specific heat. The specific heat (J/g.C°) of a substance is the amount of heat that should be added to one gram of that substance to raise its temperature by one degree Celsius. The Heat capacity of a given sample substance is the amount of heat that is required to increase the temperature by one degree Celsius. Heat capacity, specific heat, and temperature are related according to the following relations:
Let’s now talk about the temperature change when heat is added to a substance - the changes in temperature that occur during the change of a substance from its solid state to gaseous state or vice versa. It is easier to understand this from the Figure 7-4.
Let’s say we are adding heat to a substance which is in its solid state. As the heat increases, the temperature increases until the melting point is attained. Then the temperature will not rise until the substance has melted. Keep in mind that the process of melting requires energy. As more heat is supplied, the temperature again starts increasing until the boiling point has been reached. Then again the temperature will not rise during the process of boiling or vaporization, because the energy that is supplied is used for the process of vaporization. After vaporization is completed, as more heat is supplied, the temperature again starts increasing.
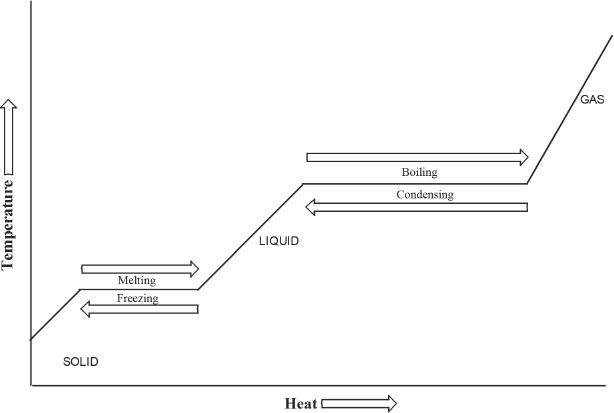
Figure 7-4
Some related terms:
Heat of fusion of a solid substance is the quantity of heat required to melt one gram of that substance at its melting point. The usual unit used is J/g.
Heat of vaporization of a liquid substance is the quantity of heat required to vaporize one gram of that substance at its boiling point. The unit used is J/g.
Heat of condensation of a substance is the quantity of heat that should be removed to condense one gram of that substance at its condensation point. The unit used is J/g.
Heat of crystallization of a substance is the quantity of heat that should be removed to crystallize one gram of that substance at its freezing point. The unit used is J/g.
G. PHASE DIAGRAMS
A phase diagram is a graphical representation of phase transitions under different pressures and temperatures. By analyzing the phase diagram of a substance, we can predict the state of that substance at a given temperature and pressure. For the MCAT, you should be familiar with the phase diagram and what exactly it represents, and also be able to predict some of the related trends from a given phase diagram.
In a phase diagram, there are three sections representing the solid, the liquid, and the gas phases. The phase diagram of a substance enables us to determine the phase of that substance at a given temperature and pressure. The phase diagram is actually plotted using experimentally determined values at different temperatures and pressures. Let’s take a look at the phase diagram (Figure 7-5) of water.
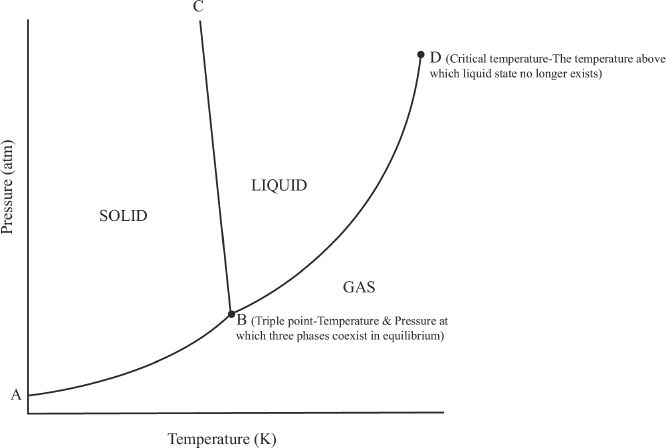
Figure 7-5 Phase diagram of water (diagram not drawn to scale)
As you can see in the phase diagram of water shown above, there are three regions in the graph representing solid, liquid, and gas phases. The segment BC divides the solid and the liquid phases of water. This segment represents the equilibrium region between the solid and the liquid phases. Because water is denser than ice, the segment BC is slightly slanting toward the left. For most phase diagrams (Figure 7-6), the segment BC will be slightly slanting toward the right (positive slope), since the liquid phase is usually less dense than the solid phase.
The segment BD divides the liquid and the gas phases in the graph. It also denotes the vapor pressures at different temperatures. The intersecting point of the curves represented by point B is called the triple point. This point represents the temperature and pressure at which the three phases of a substance are in equilibrium. How many triple points are likely to exist for a substance? The answer is one. There is only one pair of temperature-pressure combination for a substance at which the three states will be in equilibrium. Figure 7-6 shows a phase diagram representing the majority of other compounds that we see in nature.
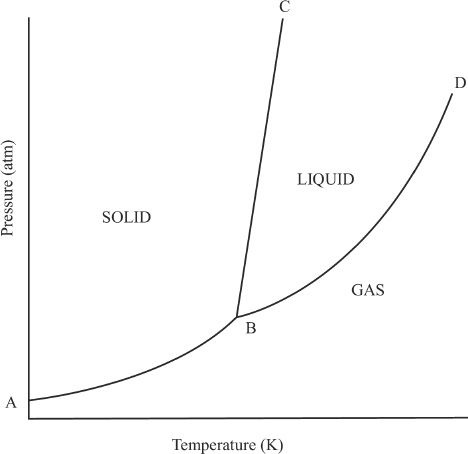
Figure 7-6 Phase diagram of most substances (diagram not drawn to scale)
(Notice the positive slope of segment BC, unlike that of water which has a negative slope)
Substances in their gas phase can usually be liquefied by increasing the pressure. But it reaches a point where this conversion is not possible. The temperature above which liquid phase cannot be achieved regardless of the applied pressure is called the critical temperature. The vapor pressure at the critical temperature is called the critical pressure.
H. COLLIGATIVE PROPERTIES
Colligative properties are properties that depend only on the number (concentration) of solute particles present in a solution. These properties do not depend on the identity of the solute. As an example let’s talk about two aqueous solutions; one containing glucose and the other containing urea. As far as the colligative properties are concerned, the two solutions are not different as long as the number of glucose and urea particles are the same. In other words, if the concentration of the given samples of urea and glucose are the same, the colligative properties of both solutions will be the same.
The colligative properties that you have to be familiar with for the MCAT are:
1) vapor-pressure lowering
2) boiling-point elevation
3) freezing-point depression
4) osmotic pressure generating
Vapor-pressure Lowering
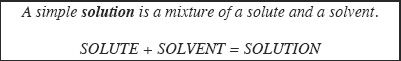
When a solvent contains impurities (solutes), there will be a reduction in its vapor pressure. This means the vapor pressure shown by a solvent when it is pure is lowered by the addition of solutes. The change in vapor pressure is proportional to the quantity of the dissolved solute. Raoult’s law explains this relationship.
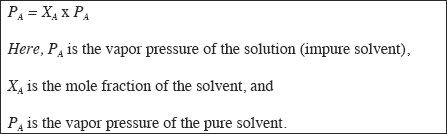
According to Raoult’s law, the mole fraction of the solvent times the vapor pressure of the pure solvent is numerically equal to the vapor pressure of the solution. This is mathematically represented as shown below:
Example 7-1
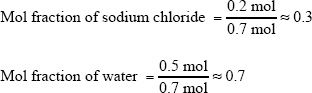
Calculate the mole fractions of sodium chloride and water in a solution containing 11.7 g of sodium chloride and 9 g of water.
Solution:
In this solution, we have 11.7 grams of NaCl and 9 grams of H2O. First, you have to find the number of moles of NaCl and H2O.
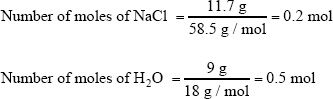
The total number of moles in the solution = 0,2 + 0.5 = 0.7 mol
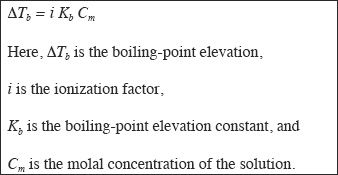
Boiling-point Elevation
The boiling point of a liquid is defined as the temperature at which its vapor pressure equals the prevailing pressure. The prevailing pressure is normally
the atmospheric pressure, provided that the container in which the liquid is present is kept open while boiling. When a nonvolatile solute is added to a pure solvent, the boiling point increases. The increase is proportional to the number of moles of the solute added to the solvent. The relationship is mathematically represented as shown below:
Example 7-2
Calculate the boiling point of 0.2 m aqueous solution of glucose. (Kb of water is 0.512°C/m.)
Solution:
The formula for finding the boiling-point elevation is:
ΔTb = i Kb Cm
In this problem, we have all the necessary values to find the boiling-point elevation. Here, the ionization factor is 1, since glucose doesn’t ionize. Let’s substitute the values into the formula.
ΔTb = Kb Cm = 0.512° C/m x 0.2 m ≈ 0.1°C
The boiling point of 0.2 m solution of glucose is 100 + 0.1 = 100.1°C
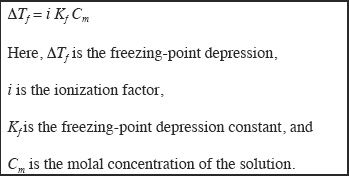
Freezing-point Depression
The solute concentration affects the freezing point of a solvent. The freezing point of a pure solvent is decreased when solutes are added to it. Just like the boiling-point elevation, freezing-point depression is proportional to the molal concentration. The relationship is shown:
Example 7-3
Calculate the freezing point of 2 m aqueous solution of glucose. (Kf of water is 1.86°C/m)
Solution:
The formula for finding the freezing-point depression is:
ΔTf = i Kf Cm
In this problem, we have all the necessary values to find the freezing-point depression. The ionization factor is 1.
ΔTf = Kf Cm = 1.86° C/m x 2 m ≈ 3.7°C
So the freezing point of 2 m solution of glucose is 0.0 — 3.7 = — 3.7°C
Osmotic Pressure
Osmotic pressure is also a colligative property. Before we talk about osmotic pressure let’s turn our attention to the process of osmosis. Consider two solutions that are made out of the same solvent with different concentrations of solute separated by a semipermeable membrane. The solvent will flow through the semipermeable membrane from the solution of lower concentration to the solution of higher concentration. Thus, osmosis is defined as the flow of solvent through a semipermeable membrane resulting in the equilibrium of concentrations on both sides of the semipermeable membrane.
We will explore the process of osmosis with an experiment. A dilute solution of sodium chloride is taken in a funnel. The mouth of the funnel is covered by a semipermeable membrane. The funnel is then placed upside down into a beaker which is filled with pure distilled water. The set up is done according to the diagram shown (Figure 7-7):
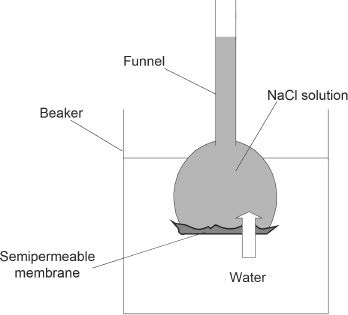
Figure 7-7 Osmosis experiment
The arrow indicates the direction of flow of the solvent (H2O).
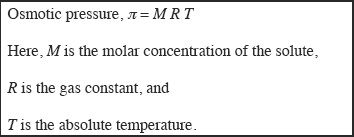
Water will flow into the funnel through the semipermeable membrane, and the liquid level of the funnel will gradually increase. The osmotic pressure is the pressure required or applied to the solution to stop the flow of the solvent, or in other words, to stop the process of osmosis. The osmotic pressure and concentration are related by the following equation:
CHAPTER 7 PRACTICE QUESTIONS
1. The phase change that involves the conversion of a gas to a solid is called:
A. sublimation.
B. condensation.
C. freezing.
D. deposition.
2. Which of the following processes accompanies a release of heat?
A. Vaporization
B. Condensation
C. Sublimation
D. Melting
3. Potassium fluoride is: A. a covalent solid.
B. a metallic solid.
C. a network solid.
D. an ionic solid.
4. Which of the following is the strongest type of force that is present in an ionic bonding?
A. London forces
B. Covalent forces
C. Electrostatic forces
D. Hydrogen bonding forces
Questions 5-10 are based on the following passage.
Passage 1
A phase diagram illustrates the physical state of a substance with respect to the temperature and the pressure of the surroundings. The points plotted to draw the phase diagram are derived experimentally, and are usually plotted with temperature on the x-axis and pressure on the y-axis. A typical phase diagram is shown below in Figure-1.
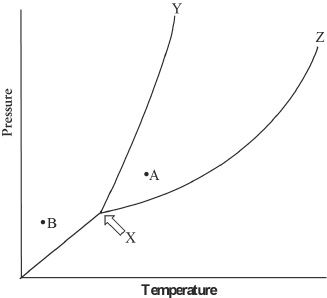
Figure 1
5. Which of the following represents the correct phase diagram of water?
A. 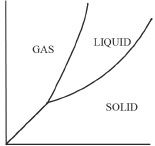
B. 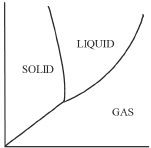
C. 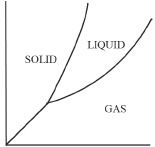
D. 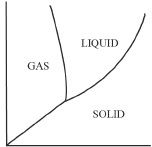
6. The phase diagram given in the passage cannot be that of:
A. CO2
B. H2O
C. CO
D. O2
7. From the phase diagram given in the passage, predict the likely phase change if the following changes happen. Consider point A as the current phase of substance M. What is the most likely effect on substance M, if the pressure was decreased without changing the temperature of the system?
A. Gas to liquid
B. Liquid to gas
C. Liquid to solid
D. Solid to liquid
8. The point marked ’X’ in the phase diagram given in the passage is called:
A. the critical point.
B. the maximum point.
C. the triple point.
D. the critical pressure point.
9. The critical temperature of a substance is best defined as:
A. the temperature below which a gas cannot be liquefied.
B. the temperature above which a liquid cannot be vaporized.
C. the temperature above which a substance exists only as gas.
D. the temperature which is essential for a substance to obey ideal gas laws.
10. The segment XZ in the phase diagram given in the passage represents the equilibrium between:
A. gas and liquid.
B. liquid and solid.
C. solid and gas.
D. gas and plasma.