Physical Chemistry Essentials - Hofmann A. 2018
Mixtures and Phases
3.3 Phase Equilibria
3.3.1 Phase Diagrams and Physical Properties of Matter
Phase diagrams tell us the state of a system under various conditions. The states of a system at various pressures and temperatures can be depicted in a p-T diagram (see for example Fig. 3.2). In phase diagrams, lines separate regions where various phases are thermodynamically stable. These lines are called phase boundaries and show values of p and T where two phases coexist in equilibrium. When changing one of the two parameters (p or T), in order to maintain the state of equilibrium, the other parameter needs to follow suit. Phase boundaries are therefore univariant (one parameter can be freely chosen).
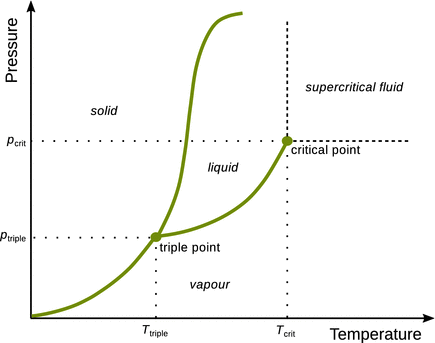
Fig. 3.2
Pressure-temperature phase diagram of a one-component system. Lines in a p-T phase diagrams have the same volume all along the way (isochores)
From the ideal gas equation, we know that
![]()
(2.6)
If we assume a system with constant molar amount n, then the above equation relates the three variables p, V and T. For a given state, the third variable is determined by choosing the two other—a characteristic of equations of state that we have introduced earlier. As a consequence, the lines in a p-T phase diagram need to describe conditions of constant volumes; these lines are thus called isochores.
There are several points of interest in a phase diagram, illustrated in the p-T diagram in Fig. 3.2.
Boiling Point
The boiling point is the temperature at which the vapour pressure of the liquid is equal to the external pressure. Note that the frequently used term ’boiling point’ is strictly speaking not correct, as it is not a single point in the phase diagram. It is a temperature extrapolated from the isochore branch that separates liquid and vapour phases. If the external pressure is the normal pressure
![]()
If the external pressure is the standard pressure
![]()
Melting Point
The melting point is the temperature at which the liquid and solid phases coexist; it equals the freezing temperature. As above, please note that the frequently terms ’boiling/freezing points’ are strictly speaking not correct, as it is they are not single points in the phase diagram. It is a temperature extrapolated from the isochore branch that separates solid and liquid phases. If the external pressure is the normal pressure
![]()
If the external pressure is the standard pressure
![]()
Critical Point
At the critical point, there is no physical interface between the liquid and the vapour; both phases coalesce and there is no liquid phase. At pressures and/or temperatures beyond the critical point, the system is said to be in the supercritical state, which is neither vapour nor liquid. Note that the isochore branch stops at the critical point, i.e. this isochore branch does not continue beyond the critical point. Since the critical point is defined by two discrete values on the p- and T-axes, it is indeed a point in the p-T diagram. The critical point of water occurs at:
![]()
Triple Point
At a single definite pressure and temperature, three phases can exist in equilibrium; this is called a triple point. There may be more than one triple points in a phase diagram. Since triple points are defined by two discrete values on the p- and T-axes, they are indeed points in the p-T diagram. One important triple point of water is observed at
![]()
Here, solid, liquid and gaseous water exist at the same time; this triple point has a general importance as it is used to define the thermodynamic temperature scale.
3.3.2 Phase Diagrams with Isotherms
Phase diagrams may also be constructed by plotting the pressure versus the volume of a system; a useful method especially when analysing gases. As discussed in the previous section, the third parameter, now the temperature, needs to be constant when characterising a system under varying pressures and volumes. The lines in the p-V diagram are thus called isotherms; the temperature is the same all the way along (see Fig. 3.3).
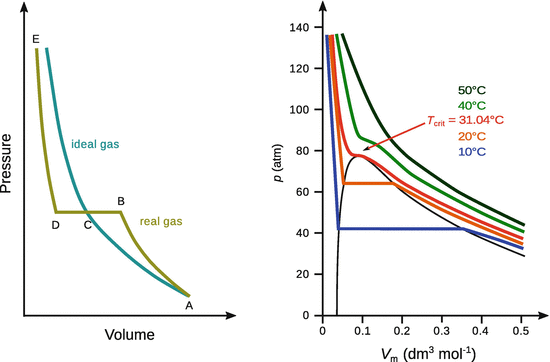
Fig. 3.3
Lines in phase diagrams that plot pressure versus volume have the same temperature all along the way (isotherms). Left: The condensation observed with real gases gives rise to a horizontal section in the p-V diagram. Right: Isotherms of CO2 at different temperatures. At sufficiently high temperature, the condensation behaviour of real gases disappears
In Fig. 3.3 (left), the behaviour of a real gas is compared to that of an ideal gas. The real gas undergoes condensation. At a certain pressure, the volume collapses (B—C—D) and the gas turns into a liquid, but the system maintains the same pressure (Fig. 3.4). The pressure at B—C—D is called the vapour pressure of the liquid. For condensation to occur, the molecules must be close enough and slow enough to aggregate.
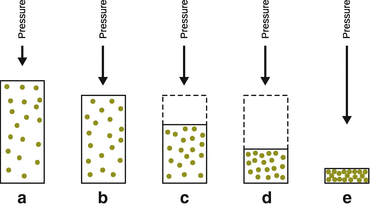
Fig. 3.4
In real gases, condensation occurs due to inter-molecular interactions, which gives rise to a volume decrease at constant external pressure (points B—C—D in Fig. 3.3). The lengths of the vectors indicate the magnitude of the pressure
High temperatures imply high molecular velocities. Therefore, at sufficiently high temperatures (above T crit), the individual gas molecules possess too high velocity in order to engage in intermolecular interactions and thus no condensation will occur, no matter how small the volume is made.
At the critical point, when the boundaries between liquid and gas phase vanish, the isotherm in the p-V diagram has zero slope (Fig. 3.3, right; red isotherm). Since the critical point is indeed a point in the phase behaviour of compounds, it possesses three discrete values for pressure, temperature and volume: p crit, T crit and V crit. The critical point is a characteristic of a particular substance (Table 3.1).
Table 3.1
Critical constants for selected gases
|
Gas |
p crit (kPa) |
V crit (cm3 mol−1) |
θcrit (°C) |
Ar |
4862 |
75.3 |
−123 |
CO2 |
7385 |
94.0 |
31.0 |
He |
228.9 |
57.8 |
−268 |
O2 |
5075 |
78.0 |
−118 |
3.3.3 Phase Transitions
A form of matter that is uniform throughout in chemical composition and physical state of matter is called a phase. The fundamentally different phases are solid, liquid and gas; with water, for example, ice, liquid water and water steam. However, there may also be various solid phases, conducting and superconducting phases, superfluid phases. A phase transition is the conversion of one phase into another. The possible phase transitions between the three states of matter—solid, liquid and gas—are illustrated in Fig. 3.5. Some compounds possess more than one liquid or solid phase; transitions are then also possible between those.
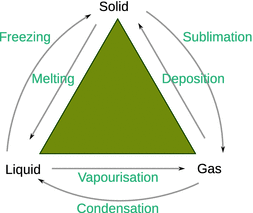
Fig. 3.5
Phase transitions
When two or more phases are in equilibrium, the chemical potential of a substance is the same in each of the two phases and at all points in each of the phases. This is a consequence of the 2nd law of thermodynamics. For a given pressure, the temperature at which two phases are in equilibrium (and thus matter spontaneously transitions from one to the other) is called transition temperature.
3.3.4 The Gibbs Phase Rule
In Sect. 3.3.1, we introduced phase boundaries is univariant regions in the phase diagram: it is possible to freely choose one parameter in order to maintain this particular state of the system. The Gibbs phase rule allows calculation of the number of intensive parameters (i.e. independent of the amount of substance) that can be varied independently (F) while the number of phases (P) remains constant, given a system with a particular number of components (C) of a system:
![]()
(3.14)
For example, if two phases (P = 2) in a system consisting of one component (C = 1) are in equilibrium, then
![]()
parameter (e.g. T) can be changed, but the other parameters (e.g. p) will follow suit. Systems with F = 1 are called univariant.
Gibbs phase rule examples
Water steam
Water steam describes one phase (P = 1) in the one-component system water (C = 1). Therefore:
![]()
With two degrees of freedom, water steam constitutes a bivariant system. It corresponds to an area in an x—y plot (for example, in a p-T diagram). We can vary the temperature of the steam without having to change the pressure at the same time, but still maintain the gas phase.
Liquid water in equilibrium with its vapour
Here, we again deal with the one-component system water (C = 1), but now have to consider two phases, liquid and vapour, i.e. P = 2. Therefore:
![]()
With one degree of freedom, this constitutes a univariant system. It corresponds to a line in an x—y plot. The temperature can be varied, but the pressure needs to be varied accordingly to in order to preserve the equilibrium between liquid and vapour phase.
3.3.5 One Component Systems: Carbon Dioxide
The phase diagram of carbon dioxide is shown in Fig. 3.6, annotated with the three states of matter. as well as the triple and critical points. The degrees of freedom for the different areas in the phase diagram are also shown.
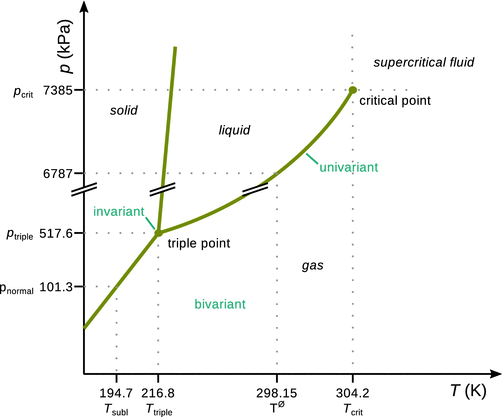
Fig. 3.6
Phase diagram of CO2
A closer look at the numerical values of the p- and T-axes shows that solid CO2 sublimes (i.e. transitions to the vapour phase). Since the solid and liquid phases of CO2 do not co-exist at normal pressure, solid CO2 is also called dry ice. The liquid phase does not exist below a pressure of 518 kPa. In other words, if liquid CO2 is required, a pressure of at least 518 kPa must be applied.
At a pressure of 101.3 kPa, which constitutes the normal atmospheric pressure, the transition temperature between solid and gas phase is 195 K (−78 °C), so solid CO2 evaporates under normal conditions.
Inspection of the phase boundary between solid and liquid CO2 shows that an increase in pressure results in an increase in the melting temperature; the slope of the solid—liquid isochore is positive. This is due to solid CO2 being denser than the liquid. An increase in pressure promotes the denser phase, so higher pressures stabilise the solid state. This behaviour is typical of most substances.
The phase changes when approaching the critical point and formation of supercritical propane is illustrated in Fig. 3.7. In the supercritical fluid, one homogenous phase is formed which shows properties of both liquids and gases.
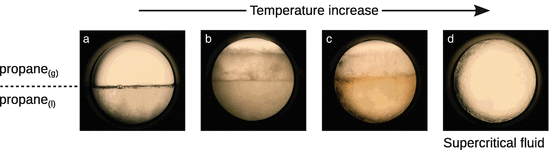
Fig. 3.7
Formation of supercritical propane. (a) Liquid and gas phases of propane are visible and the meniscus is easily observed. (b) With an increase in temperature the meniscus begins to diminish. (c) Increasing the temperature further causes the gas and liquid densities to become more similar. The meniscus is less easily observed but still evident. (d) Once the critical temperature and pressure have been reached, the two distinct phases of liquid and gas are no longer visible and the meniscus can no longer be observed. Images obtained from CM Rayner, AA Clifford and KD Bartle, University of Leeds, UK and reproduced with permission
3.3.6 One Component Systems: Water
The p-T phase diagram for water is shown in Fig. 3.8. The thick lines indicate the main phase boundaries between solid, liquid and vapour states. Especially at high pressures, water can form several different solid phases, the boundaries of which are shown by the thin lines. Therefore, the phase diagram contains several triple points, where three phases are in co-existence. The main triple point, where solid, liquid and vapour water are in equilibrium, is observed at T = 273.16 K and p = 611 Pa. This triple point has fundamental importance, as it is used to define the zero point on the Celsius temperature scale.
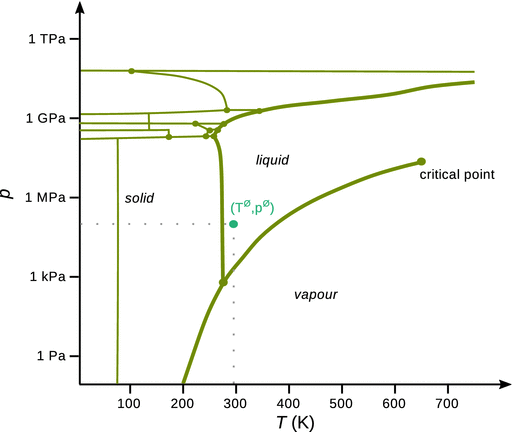
Fig. 3.8
Phase diagram of H2O. Thick lines show the main phase boundaries; thin lines indicate phase boundaries of the various solid phases. The critical point is labelled; all other indicated points are triple points. The phase at normal conditions (Tnormal = 298.15 K, pnormal = 101.3 kPa) is marked
Of particular importance is the rather exceptional property of water arising from the steep slope of the solid—liquid phase boundary (the melting temperature curve): it not only has a very steep, but a negative slope. The negative slope indicates that the liquid phase has a higher density than the solid phase. Therefore, solid ice floats on liquid water (due to the lower density of the former; see also Sect. 3.4.6), and the possibility of ice skating also arises form this unusual behaviour. A skater on ice of about 70 kg exerts a pressure of about 7 MPa (assuming a contact area of 1 cm2). At that high pressure, the melting temperature of ice is no longer 0 °C but −1 °C. The high pressure leads to disruption of hydrogen bonds that hold the water molecules in the solid structure. The generated film of liquid water enables the smooth skating process.
Water: not one, but two liquids?
The list of anomalies of water is constantly increasing, and currently includes some 72 properties that distinguish water from conventional liquids (Chaplin 2014). Among the best known anomalies are the density maximum of water in its liquid state at 3.98 °C, as well as the so-called Mpemba effect which describes the phenomenon that hot water freezes faster than cold water (Mpemba and Osborne 1969).
The reason for such extra-ordinary behaviour lies in discontinuities in the heat capacity C p (see also Sect. 3.4.9). Such a discontinuity gives rise to the critical point, where fluctuations happen at all length scales and thus light cannot penetrate the system—it becomes opaque. The critical point indicates the end of the boiling curve, and liquid and gas state are no longer distinguishable (supercritical fluid). In supercritical water, salts can no longer be dissolved, but mixture with apolar solvents is observed. However, the C p discontinuity at the critical point cannot explain anomalies that occur at lower pressures and temperatures.
Based on simulations (Poole et al. 1992), it has thus been proposed that a so far non-identified equilibrium curve exists in water that separates the liquid phase into two liquids, a high-density and a low-density liquid. Similar to the boiling curve, this postulated equilibrium curve may contain a critical point at approx. −50 °C and atmospheric pressure.
This hypothesis is a matter of ongoing debate, but may have notable implications. If this second critical point exists, then water under standard conditions would constitute a supercritical fluid that fluctuates between a low- and a high-density liquid state. At lower temperatures, the mixture of the two phases should spontaneously separate into a low-density liquid that flows on top of the high-density liquid.
3.3.7 One Component Systems: Helium
Compared to the two substances we have looked at so far, the phase diagram for helium shows further unusual behaviour. The two isotopes of helium, 3He and 4He, have different phase diagrams; the p-T diagram of 4He is illustrated in Fig. 3.9. In contrast to its lighter isotope, 4He has two liquid phases, called He-I and He-II, with a transition between them. This transition line is called the λ-line. Whereas the liquid phase He-I forms a normal liquid, He-II has properties of a superfluid: it flows with zero viscosity (Figure 3.10). At the low temperature triple point of helium, the phases He-II(l), He-I(l) and He(g) coexist. Another unusual observation is that solid and gas are never in equilibrium, due to the light He atoms having large amplitude vibrations. Therefore, helium needs very high pressures to form a solid.
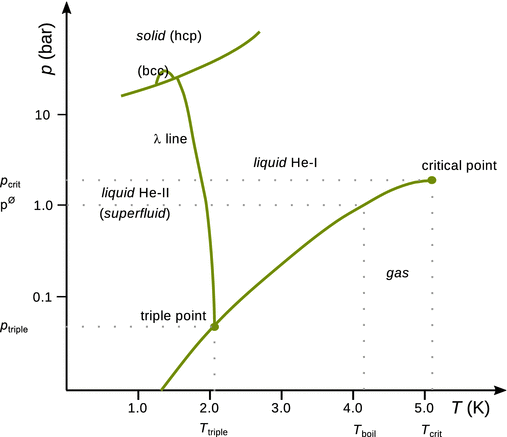
Fig. 3.9
Phase diagram of 4He. hcp: hexagonal closed packing, bcc: body-centred cubic packing
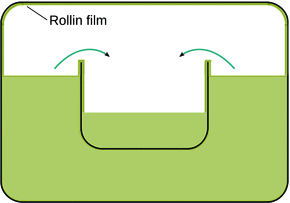
Fig. 3.10
Superfluid He-II flows with zero viscosity. It will “creep” along surfaces in order to equally level the two compartments in the container. The Rollin film also covers all interior surfaces of the container. If the container was not closed, He-II would creep out and escape
3.3.8 Other Phases
In addition to the three fundamental phases (solid, liquid, gas), there a few unusual phases:
✵ Plasma is a phase formed by an ionised gas when electrons are stripped from atoms at high temperatures. Plasmas are an important phase in high-temperature processes such as nuclear fusion and stellar atmospheres. They have a practical importance in spectroscopic instruments where they are used as ionisation devices (e.g. inductively-coupled plasma atomic emission spectroscopy, ICP- AES).
✵ Supercooled liquids constitute a phase that is established by cooling a liquid below the freezing temperature but without crystallisation. The most prominent example for a supercooled liquid is glass. Albeit these materials appear solid, the particles form an amorphous (formless) structure.
✵ Liquid crystals flow like ordinary liquids, but the molecules form swarms with some low-order structure. As such, the liquid crystalline phase is an intermediate between the crystalline and liquid phase. The liquid crystalline phase is of eminent importance for the physics of membranes. It also has important practical applications since the low-order structure of liquid crystalline materials can be changed by orienting the molecules by applying a small electric potential; the change of orientation results in different optical properties of the liquid crystal. These phenomena are used in liquid crystalline displays ( LCDs), which makes this phase a highly important phenomenon for microelectronic devices (displays, computer and TV screens).