Process Technology: An Introduction - Haan A.B. 2015
10 Solid-liquid separation
10.4 Filtration fundamentals
10.4.1 Flow through packed beds
During its flow through a packed bed of solids a liquid passes through the open space between the particles. The part of the total bed volume available for fluid flow is called the porosity:
![]()
(10.18)
As the liquid flows through the bed, friction with the surface of the solid packing leads to a pressure drop. Darcy discovered that during filtration the filtrate velocity vF is proportional to the imposed pressure difference ΔP and inversely proportional to the viscosity of the flowing fluid η and the sum of the cake resistance Rc and the resistance of the filter medium RM. This is schematically shown in Fig. 10.23 and may be written as
![]()
(10.19)
Implicitly it is assumed that the resistance of the filter medium does not change during the process. Although true for the medium, filter cake resistances can vary over a wide range depending on porosity, particle shape and packing, particle size and distribution, cake formation rate, and slurry concentration. This is the reason that the relations derived for the resistance of idealized particle beds should only be used as guidelines and are not applicable to practical filtration operations. In filtration it is common practice to deduce an empirical permeability from simple laboratory tests or existing operating data. Finally, the filtrate velocity is replaced by the amount of filtrate dV collected in period dt divided by the filter cross-sectional area A:
![]()
(10.20)
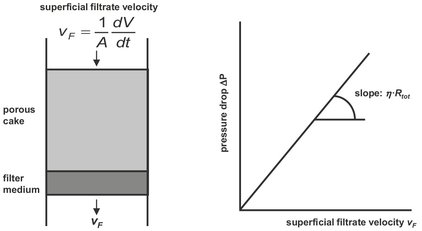
Fig.10.23: Schematic of flow through a porous medium.
10.4.2 Cake filtration
The mathematical description of the cake filtration process already shown in Fig.10.3a starts by combining both relations for the filtrate velocity into Darcy’s law to relate the filtrate flow rate and pressure drop:
![]()
(10.21)
During filtration the deposition of solids increases the cake height, which is accompanied by an increase in the total cake resistance. A material that exhibits the linear increase in cake resistance with the cake height shown in Fig. 10.24 is known as an incompressible cake. In an incompressible cake filtration process the solids concentration or porosity of the filter cake remains constant and the cake volume increases by a constant amount for each unit volume of suspension. However, when filtering at constant pressure the rate of filtration and solids deposition declines, as shown in Fig. 10.25, because each new element of filter cake increases the total resistance to filtrate flow through the deposited cake. The total resistance of the cake can be represented through the proportionality constant α and the deposited mass of dry solids per unit area of the filter w:
![]()
(10.22)
The proportionality constant α is known as the specific cake resistance and has the units m/kg. The amount of deposited dry solids per unit area can be obtained from the dry solids concentration c in the suspension and the total amount of filtrate V divided by the filter area:
![]()
(10.23)
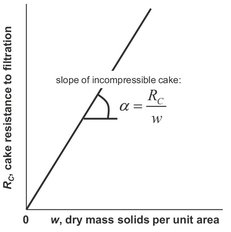
Fig. 10.24: Specific resistance of an incompressible cake.
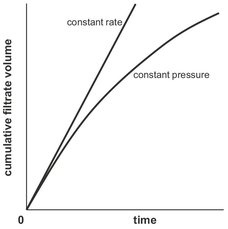
Fig. 10.25: Declining filtrate rate during constant pressure filtration.
Introduction of the specific cake resistance into eq. (10.21) provides the two resistances in series form of Darcy’s law we will use in the further analyses of filtration processes:
![]()
(10.24)
10.4.3 Constant pressure and constant rate filtration
For an incompressible cake this modified Darcy’s law equation contains three variables and five constants. The equation can be solved analytically only if one of the three variables (time, filtrate volume, pressure) is held constant. This reflects the two main operation modes of industrial filters. Vacuum filtration tends to be under constant pressure and pressure filtration is often under constant rate. Under constant differential pressure, eq. (10.24) can be rearranged and integrated using the boundary condition of zero filtrate at zero time. After integration the following equation, known as the linearised parabolic rate law for constant pressure filtration, is obtained:
![]()
(10.25)
This is a straight line, where t/V is the dependent and V is the independent variable. Thus a graph of the experimental data points of t/V against V permits determination of the slope and the intercept, from which the specific cake resistance and resistance of the filter medium can be calculated. Constant rate filtration is encountered when a positive displacement pump feeds a pressure filter. Due to the increasing cake resistance the pressure delivered by the pump must increase during the filtration process to maintain a constant filtration rate. Constant-rate filtration is easily observed on a plot of filtrate volume against time, as illustrated in Fig. 10.26. Because under these circumstances
![]()
(10.26)
eq. (10.24) can be rearranged to give:
![]()
(10.27)
which is again a straight line when the filtration pressure is plotted against the filtrate volume. In the same manner as with constant pressure filtration, the slope and the intercept taken from the graph provides the values for the specific cake and filter medium resistance.

Fig. 10.26: Constant-rate filtration.