High School Algebra I Unlocked (2016)
Chapter 5. Systems of Equations and Inequalities
Lesson 5.3. Solving Linear Inequalities
Now that you’re a pro at graphing and finding solutions for linear equations and simultaneous equations, let’s turn our focus to graphing and solving linear inequalities. The approach for working with linear inequalities is similar to that for working with linear equations, with one slight difference: Since an inequality provides a range of values, your solution will also be a range of values, rather than a single value, graphed on the coordinate plane.
Graphing a System of Inequalities
1.Solve each inequality for y.
2.Graph each inequality independently from one another.
•If the inequality contains a ≥ or ≤, the boundary line will be solid.
•If the inequality contains a > or <, the boundary line will be dashed.
3.Select a point not on the line and see if the inequality holds true.
•If the inequality holds true, shade the area on the side of the boundary line that contains the test point.
•If the inequality is false, shade the area on the side of the boundary line that does not contain the test point.
If boundary lines enclose the solution region, and the shaded region is contained, the solution is bounded.
If boundary lines do not enclose the solution region, and the shaded region extends forever, the solution is unbounded.
If your boundary
line does not go
through the origin,
use the point (0, 0)
as your test point—it
will make your life
much easier!
Let’s see how we’d use this process to solve a system of linear inequalities.
EXAMPLE 
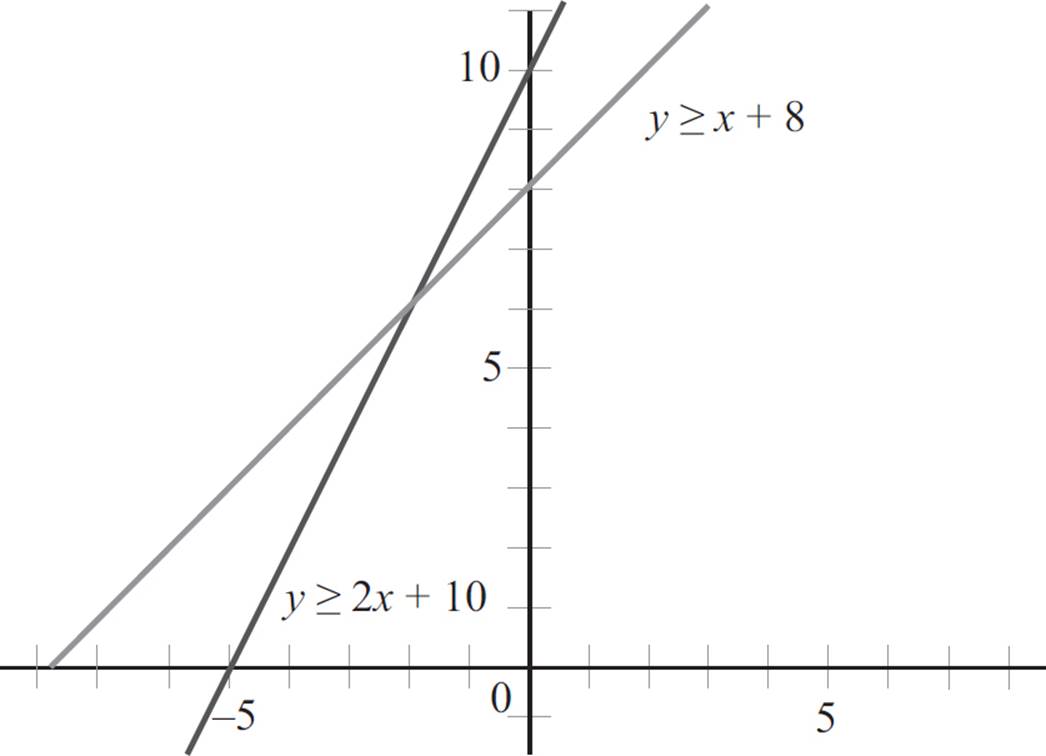
y ≥ 2x + 10
y ≥ x + 8
Solve the system of inequalities graphically and state whether the solution region is bounded or unbounded.
Since the question requires us to solve the system of inequalities, follow the process for graphing linear inequalities outlined on the previous page. Here, both equations are already in slope-intercept form, and the signs in each equation are greater than or equal to, so you can graph each with a solid boundary line, as shown on the graph below.
Choose a point not on the first boundary line to determine where on the graph the inequality holds true. Let’s start by plugging in the point (0, 0) into the first equation, y ≥ 2x + 10.
y ≥ 2x + 10
0 ≥ 2(0) + 10
0 ≥ 10
Since 0 is not greater than 10, the point (0, 0) is not a solution to the first inequality. So you will shade the side of the boundary line that does not contain the point (0, 0).
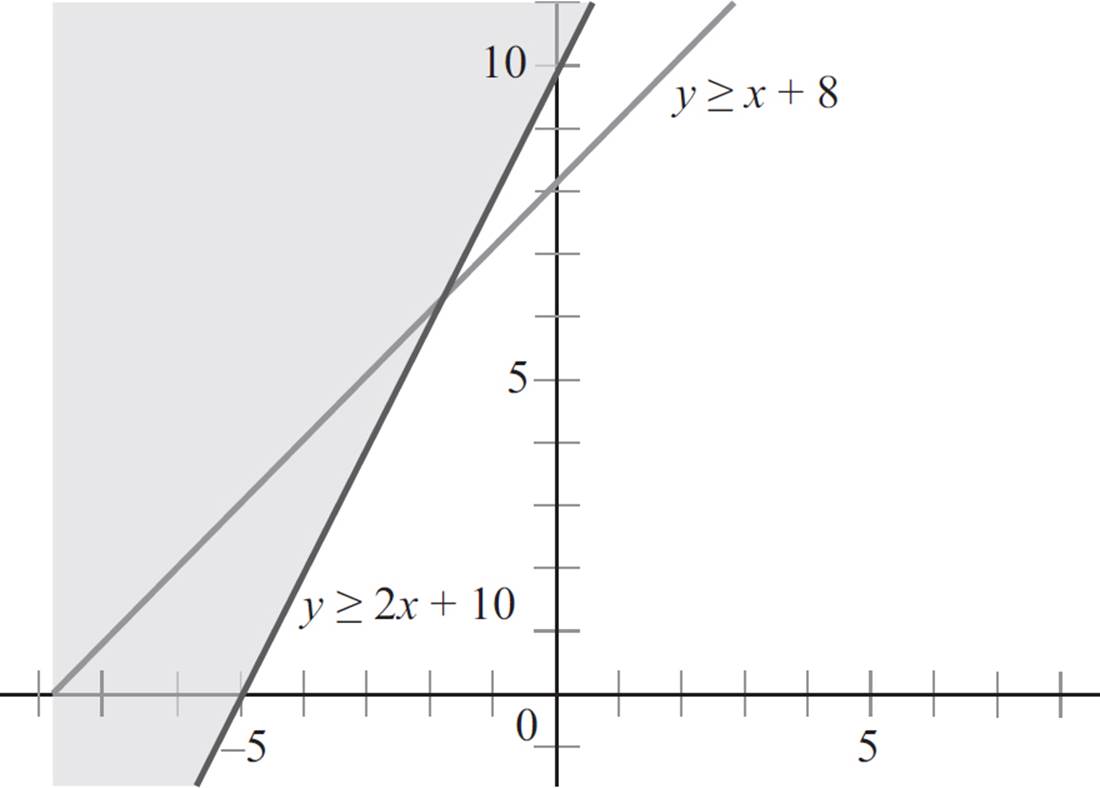
Now choose a point not on the second boundary line to determine where on the graph the inequality holds true. Again, the point (0, 0) is not on the line, so plug in the point (0, 0) into the second equation, y ≥ x + 8.
y ≥ x + 8
0 ≥ 0 + 8
0 ≥ 8
Like before, the inequality is not true; 0 is not greater than 8. Therefore, the point (0, 0) is not a solution to the first inequality, and you will shade the side of the boundary line that does not contain the origin.
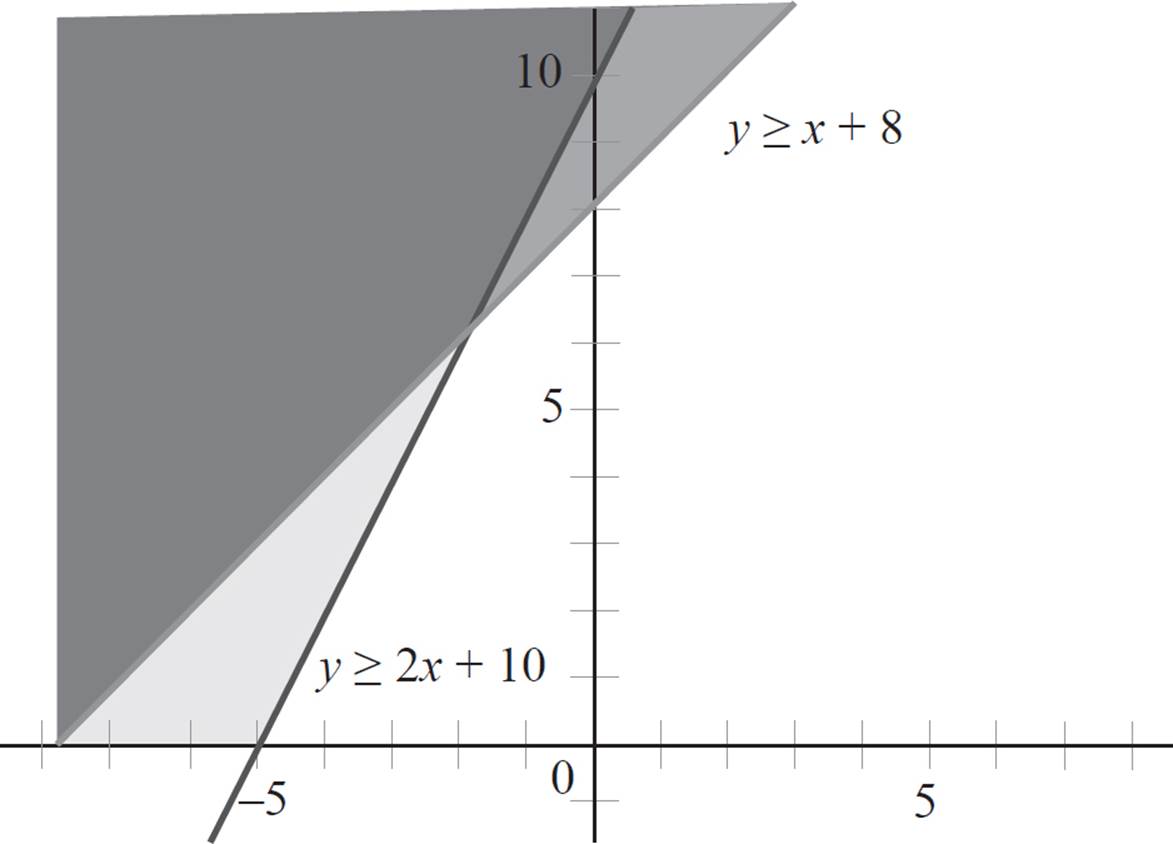
Congratulations! You’ve finished graphing your first system of linear inequalities. The solution to this system, called the solution region, is the area where the two solutions overlap. Additionally, since the graph extends beyond the shown boundaries, the solution is referred to as unbounded, which means it continues in a direction forever; in this case, the solution to the system is unbounded in the upper half-plane.

Planes and Corner Points
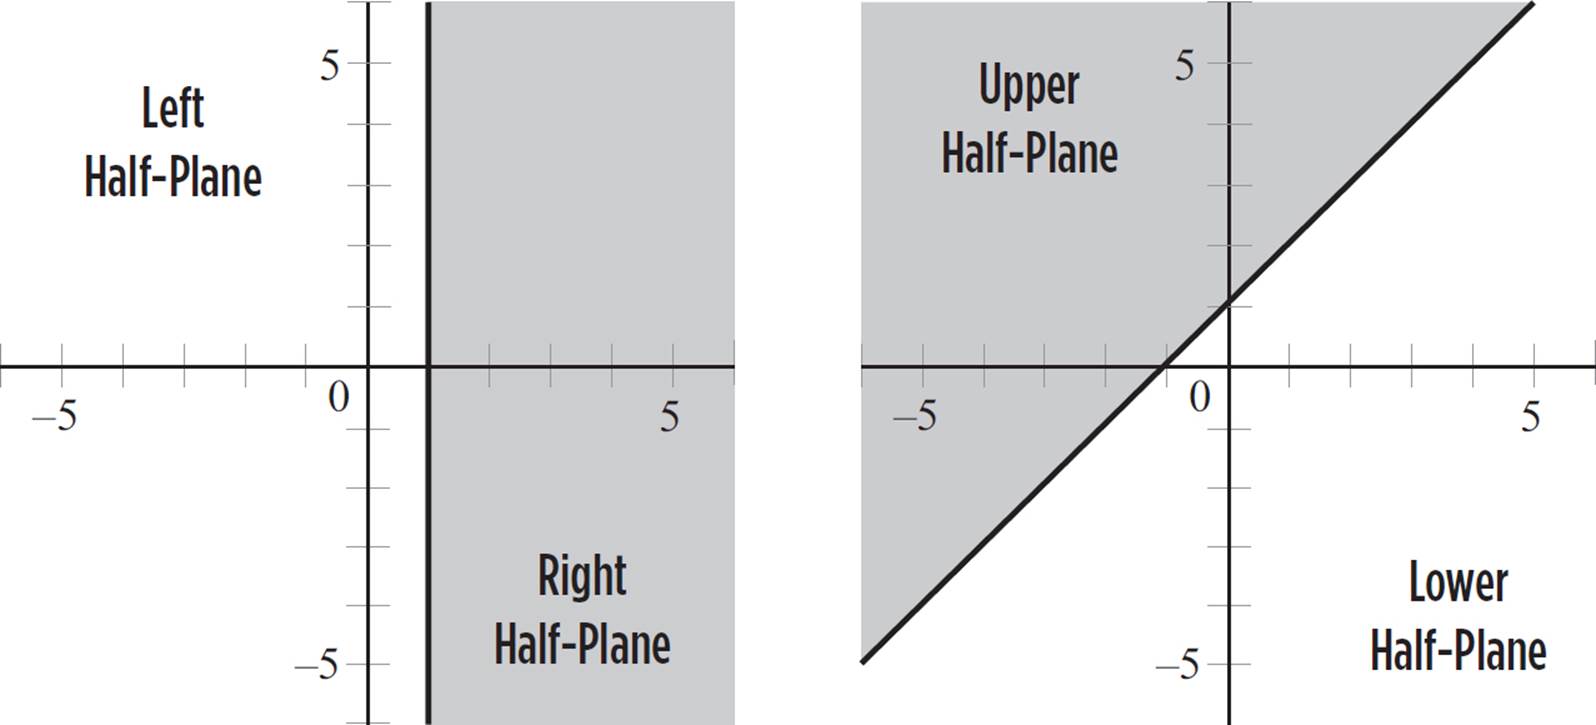
When discussing the solution to a system of linear inequalities, you may be asked to refer to the shaded area according to planes. This means that when you graph an inequality in the coordinate plane, the graph is divided into half-planes, which can then be further split into either left and right half-planes by a vertical boundary line or upper and lower half-planes by a non-vertical boundary line.
You may also be asked to find the corner point(s) in a system of inequalities, which is the point(s) in the solution region where two boundary lines intersect.
Let’s try a question that involves corner points.

Here is how you may see a systems of equations problem involving parallel lines on the ACT.
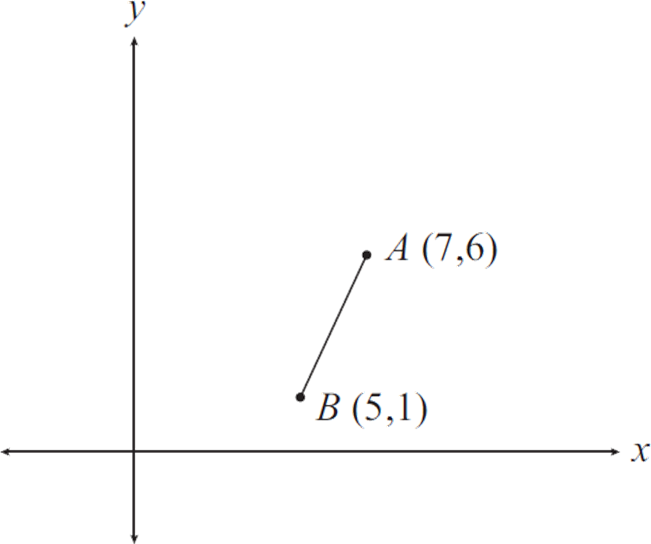
Side AB of parallelogram ABCD is shown in the figure below. If the coordinates of A are (7, 6) and those of B are (5, 1), then CD could lie on which of the following lines?
A. y = ![]() x + 9
x + 9
B. y = x + 5
C. y = ![]() x − 4
x − 4
D. y = −![]() x + 4
x + 4
E. y = −![]() x − 9
x − 9
EXAMPLE 
2y + 2 + 6x < 4
4 − 2y ≤ 12x + 2
Solve the system of inequalities graphically. Then state whether the solution region is bounded or unbounded, and find the coordinates of each corner point.
As in the previous example, follow the process for graphing linear inequalities. Before we can graph the lines, however, we need to rewrite them in slope-intercept form, or in the form y = mx + b.
|
2y + 2 + 6x < 4 |
4 − 2y ≤ 12x + 2 |
|
2y < −6x + 4 − 2 |
−2y ≤ 12x + 2 − 4 |
|
2y < −6x + 2 |
−2y ≤ 12x − 2 |
|
y < −3x + 1 |
y ≥ −6x + 1 |
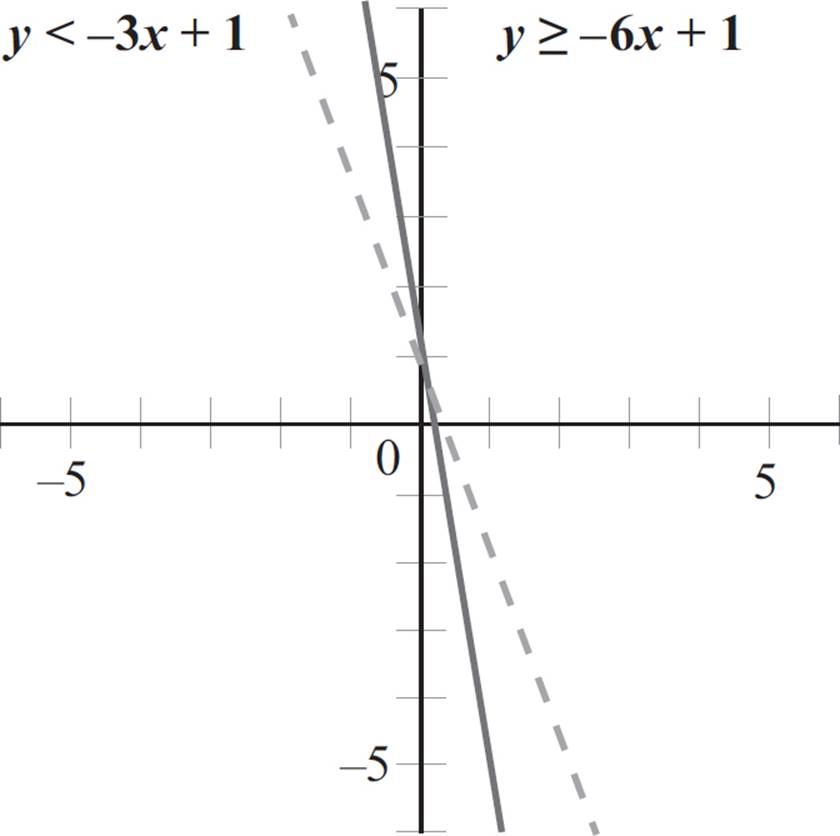
Great! Now that the equations are in slope-intercept form, graph each line. Note that the first equation has a less than sign and will be graphed with a dashed boundary line, while the second equation has a greater than or equal to sign and will be graphed with a solid boundary line.
Once you’ve graphed the lines, choose a point not on the first boundary line to determine where on the graph the inequality holds true. Since the point (0, 0) is not on the first boundary line, let’s plug the point (0, 0) into the equation, y < −3x + 1.
y < −3x + 1
0 < −3(0) + 1
0 < 1
Since 0 is less than 1, the point (0, 0) is in the solution set of the first inequality. Therefore, you will shade the side of the boundary line that contains the point (0, 0).
Next, select a point not on the second boundary line to determine where on the graph the inequality holds true. As with the first equation, the point (0, 0) is not on the second boundary line, so you can plug the point (0, 0) into the second equation, y ≥ −6x + 1.
y ≥ −6x + 1
0 ≥ −6(0) + 1
0 ≥ 1

This question requires you to find the equation of line CD, which is a side of the parallelogram ABCD. But how can you find the equation of line CD if it isn’t even shown? Well, because line CD does not include either point A or point B, line CD must be parallel to line AB. Since parallel lines have identical slopes, start by finding the slope of line AB using the coordinates of point A, (7, 6), and point B, (5, 1).
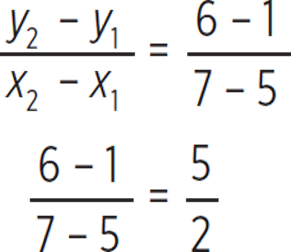
Thus, the slope of line AB is ![]() and, since parallel lines have identical slopes, you know that line CD must also have a slope of
and, since parallel lines have identical slopes, you know that line CD must also have a slope of ![]() . The only equation that has a slope of
. The only equation that has a slope of ![]() is (A), y =
is (A), y = ![]() x + 9. The correct answer is (A).
x + 9. The correct answer is (A).
In this case, 0 is not greater than 1, so the point (0, 0) is not a solution to the second inequality, and we need to shade the side of the boundary line that does not contain the point (0, 0).
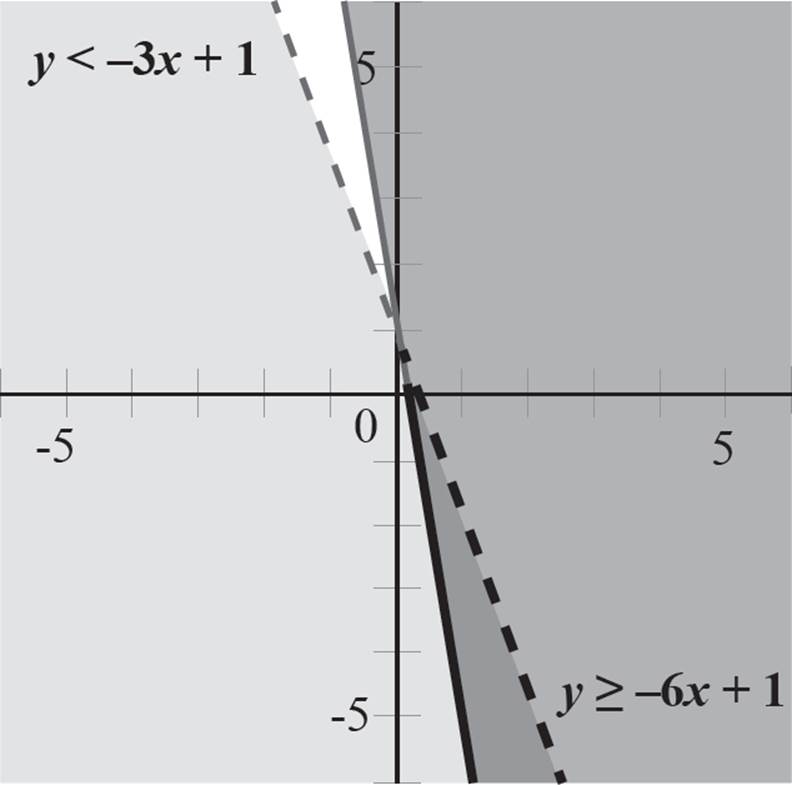
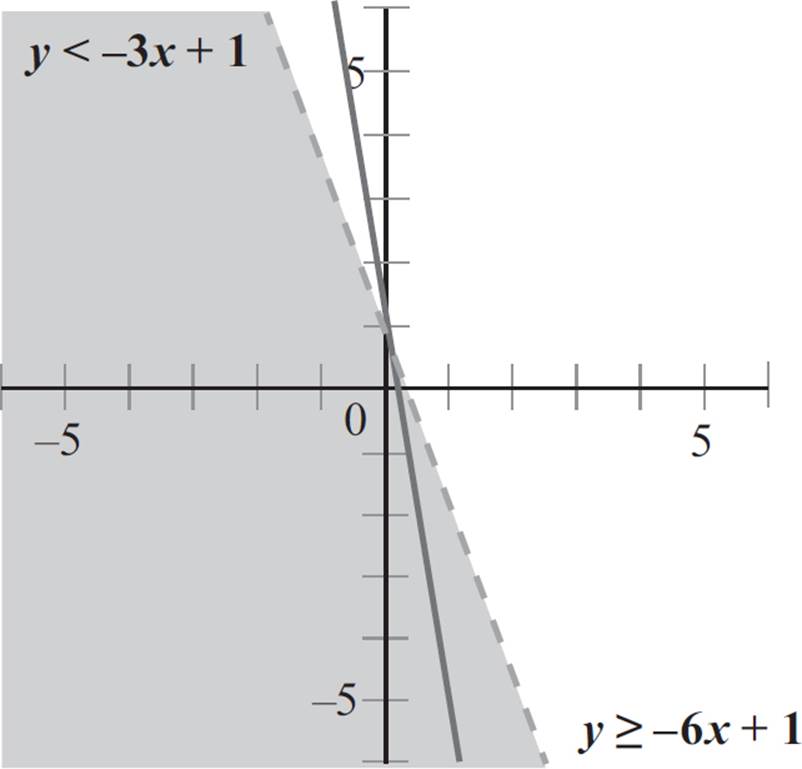
Now that we’ve found the solution region, you need to find the corner point, or the point at which the two boundary lines intersect. Find the corner point in a system of inequalities using the same methods we used to find the point of intersection in a system of equations. Since the equations are already in y = mx + b form, and y is isolated in the equations y < −3x + 1 and y ≥ −6x + 1, use the algebraic method to find x:
−3x + 1 ≥ −6x + 1
−3x + 6x ≥ 1 − 1
3x ≥ 0
x ≥ 0
Now that we know x ≥ 0, we can solve for y by plugging x = 0 into either of the equations:
|
y < −3x + 1 |
y ≥ −6x + 1 |
|
y < −3(0) + 1 |
y ≥ −6(0) + 1 |
|
y < 1 |
y ≥ 1 |
Here we find that y < 1 and y ≥ 1, indicating that y = 1. Thus, the corner point in this system is (0, 1). You’ll notice that this is the exact point where the boundary lines intersect on your graph! If the boundary lines are straightforward, and the corner point can be easily determined by looking at the graph, you do not need to use the algebraic method to find the point of intersection. Instead, you can determine the corner point directly from the graph.
Now we’re done. The system is unbounded in the lower plane, the corner point is (0, 1), and the solution region is the area in which the shaded regions overlap.

EXAMPLE 
2y − x ≤ 2
7x < 14y − 28
Solve the system of inequalities graphically. Then state whether the solution region is bounded or unbounded, and find the coordinates of each corner point.
Again, follow the process for graphing linear inequalities. The first step is to rewrite the inequalities in slope-intercept form.
|
2y − x ≤ 2 |
7x < 14y − 28 |
|
2y ≤ x + 2 |
14y > 7x + 28 |
|
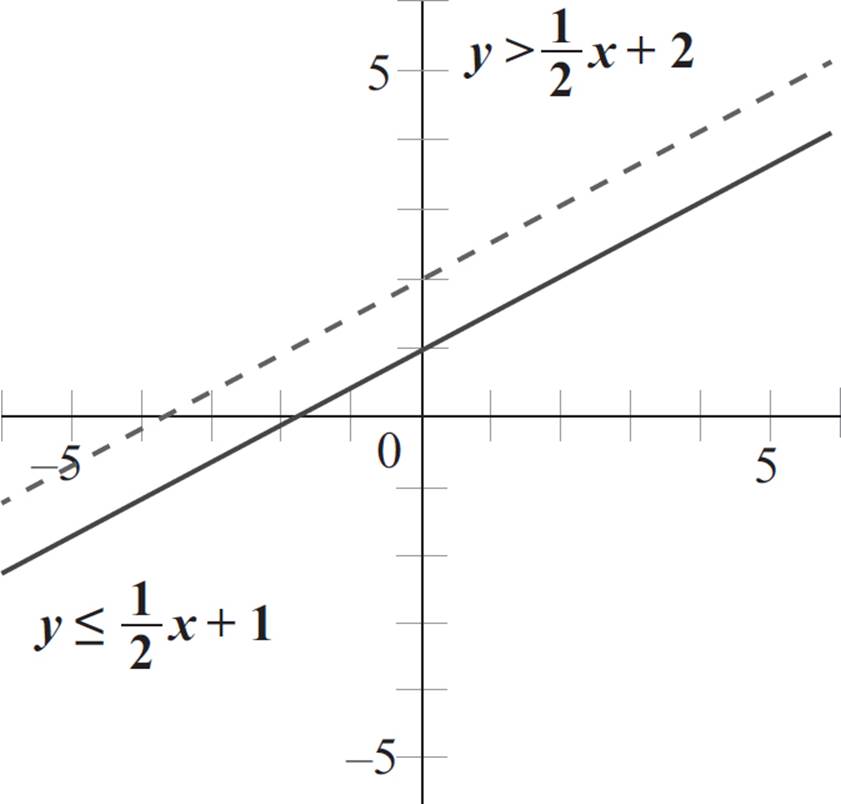
y ≤ |
y > |
Now that the equations are in slope-intercept form, graph each line. Here, the first equation has a less than or equal to sign and requires a solid boundary line, while the second equation has a less than sign and requires a dashed boundary line.
After graphing the boundary lines, select a point that is not on the first line to determine which side of the boundary line to shade. Here, the origin is not on the line, so you can plug in the point (0, 0) into the equation, y ≤ 1/2x + 1:
y ≤ 1/2x + 1
0 ≤ 1/2(0) + 1
0 ≤ 1
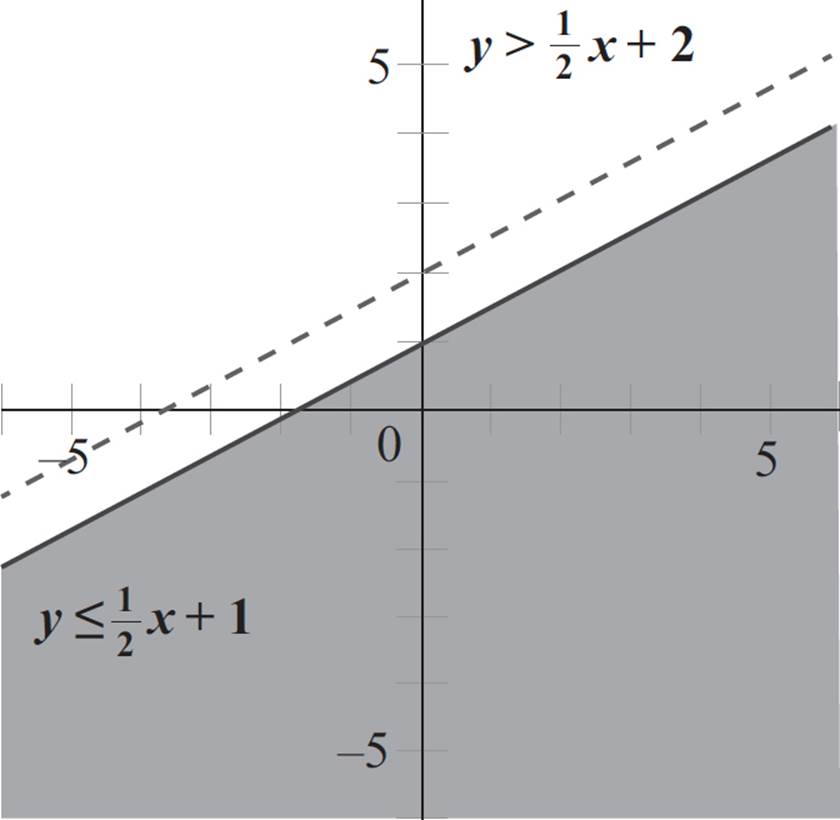
The statement 0 ≤ 1 is true, so (0, 0) is in the solution set of the first inequality, and you will shade the side of the boundary line that contains the origin.
Next, select a point not on the second boundary line to determine which side of the boundary line to shade. Again, the origin is not on the second line, so plug in the point (0, 0) into the second equation, y > 1/2x + 2:
y > 1/2x + 2
0 > 1/2(0) + 2
0 > 2
Since the statement 0 > 2 is false, the origin is not in the solution set of the second inequality, and you need to shade the side of the boundary line that does not contain the origin.
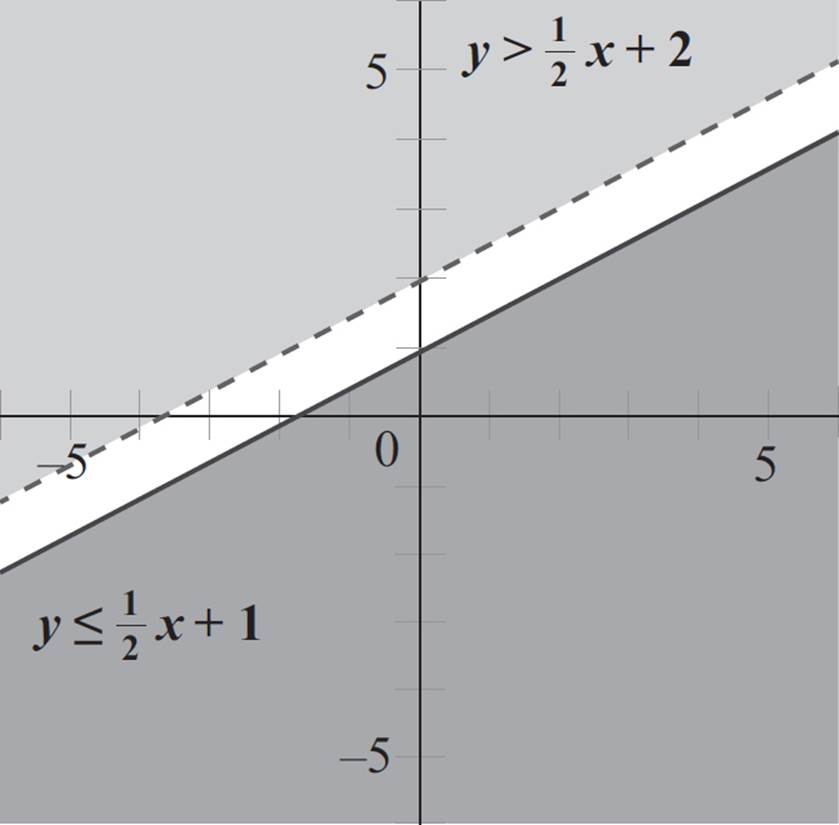
This system of inequalities does not look the other systems we’ve looked at, as there is no overlapping region. But don’t worry: The lack of an overlapping region is the solution. Whenever you graph a system of inequalities and find that there is no overlapping region, the system has no solution region and no corner point. And that is exactly what happened with this system—there is no solution.

So can you have a system of inequalities that consists of more than two inequalities? Absolutely! Luckily, the process for tackling these questions is identical to the process we’ve been using to tackle systems of inequalities with two inequalities. Look at the following example.
EXAMPLE 
y + x ≥ 8
y ≥ 0
2 − x ≤ 0
Solve the system of inequalities graphically. Then state whether the solution region is bounded or unbounded, and find the coordinates of each corner point.
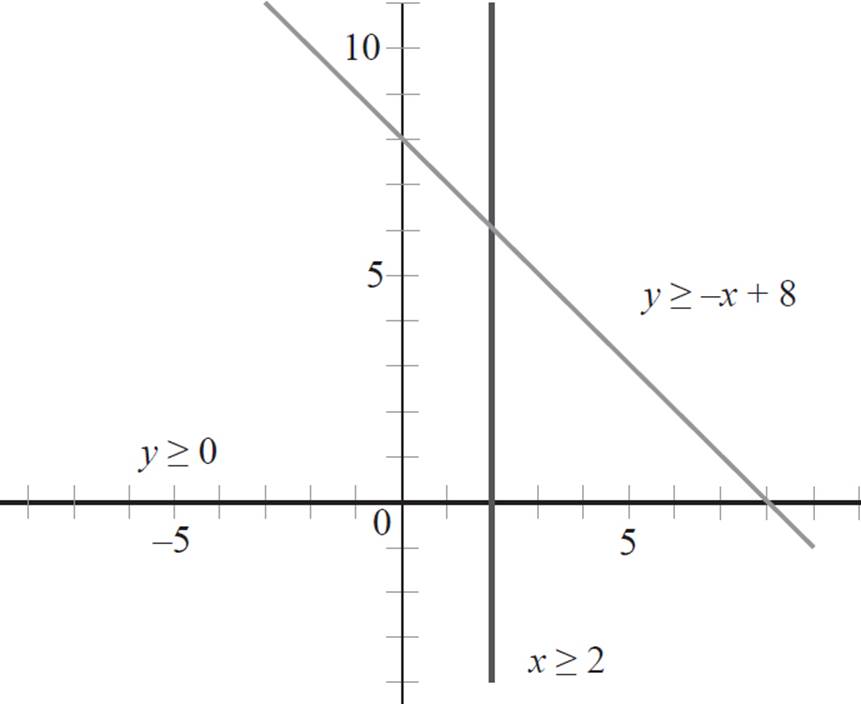
Follow the process for graphing linear inequalities. The first step, once again, is to rewrite the inequalities in slope-intercept form.
|
y + x ≥ 8 |
y ≥ 0 |
2 − x ≤ 0 |
|
y ≥ −x + 8 |
y ≥ 0 |
x ≥ 2 |
Unlike the previous questions we’ve done, we have three inequalities here, two of them containing only one variable. That’s okay, though. Recall that single-variable linear equations are either horizontal or vertical lines; the same is true for single-variable linear inequalities. Graph solid boundary lines, as all the inequalities contain greater than or equal to signs.
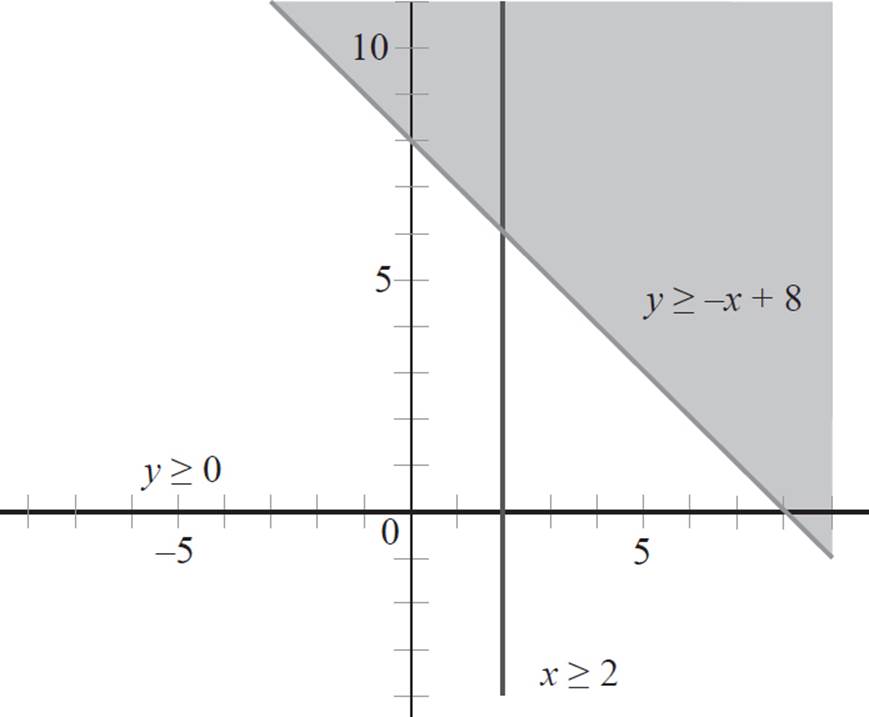
As we’ve done in previous questions, select a point that is not on the first boundary line to determine which side of the line to shade. Here, the origin is not on the line, so plug the point (0, 0) into the equation, y ≥ −x + 8.
y ≥ −x + 8
0 ≥ −0 + 8
0 ≥ 8
The statement 0 ≥ 8 is false, so the origin is not in the solution set of the first inequality, and we’ll shade the side of the boundary line that does not contain the origin.
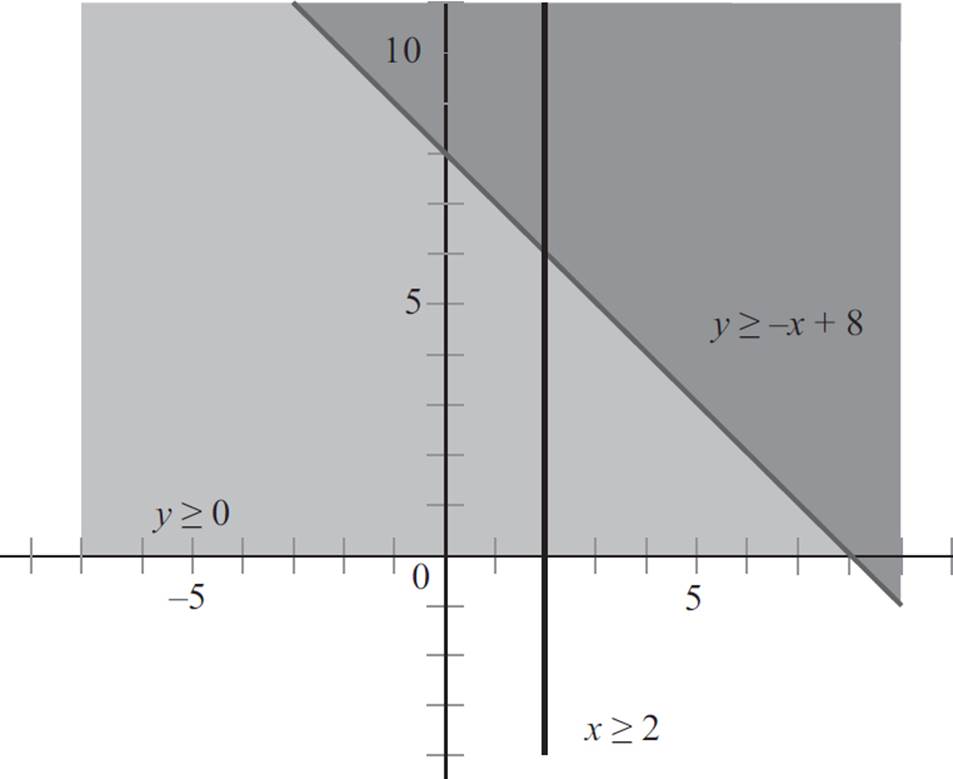
Next, select a point not on the second boundary line to determine which side of the line to shade. Here, the origin is on the second line, so you must plug in a different point; let’s plug the point (1, 1) into the second equation, y ≥ 0:
y ≥ 0
1 ≥ 0
Since the statement 1 ≥ 0 is true, the origin is in the solution set of the second inequality, and you need to shade the side of the line that contains the point (1, 1).
Now, select a point not on the third boundary line to determine which side of the line to shade. Here, the origin is not on the second line, so you can plug in (0, 0) into the second equation, x ≥ 2.
x ≥ 2
0 ≥ 2
The statement 0 ≥ 2 is false, so the origin is not in the solution set of the third inequality, and you need to shade the side of the boundary line that does not contain the origin.
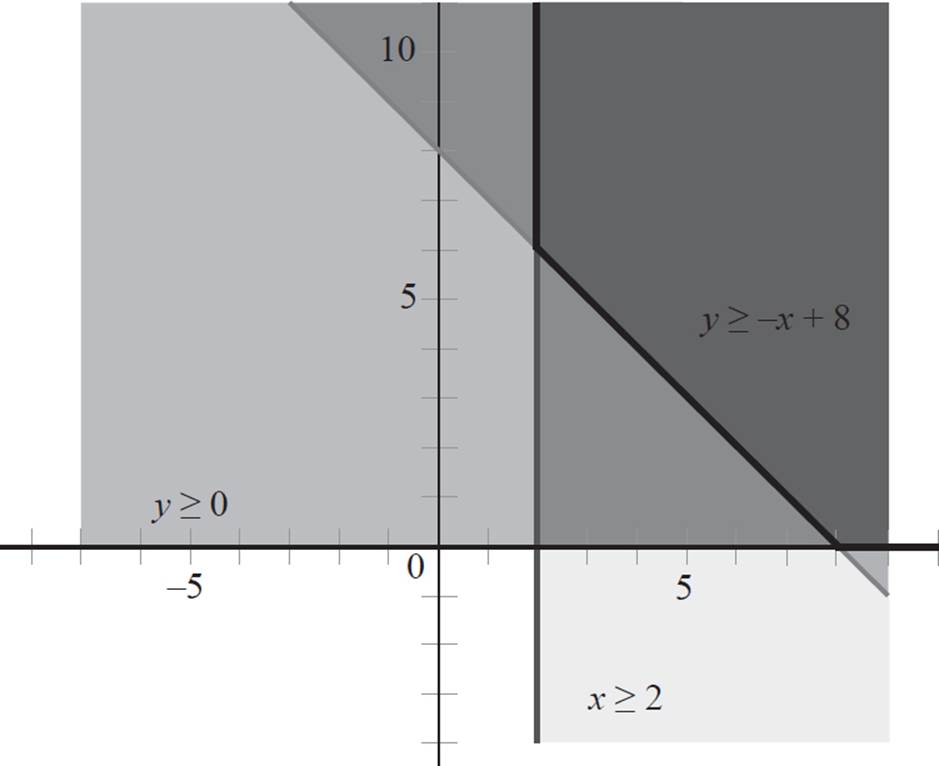
Fantastic! You successfully found the solution region of this system of inequalities and, because this system extends forever, it is considered an unbounded system. Now, you just need to find the corner points in this system. By looking at the graph, we see that the lines intersect at points (2, 6) and (8, 0).
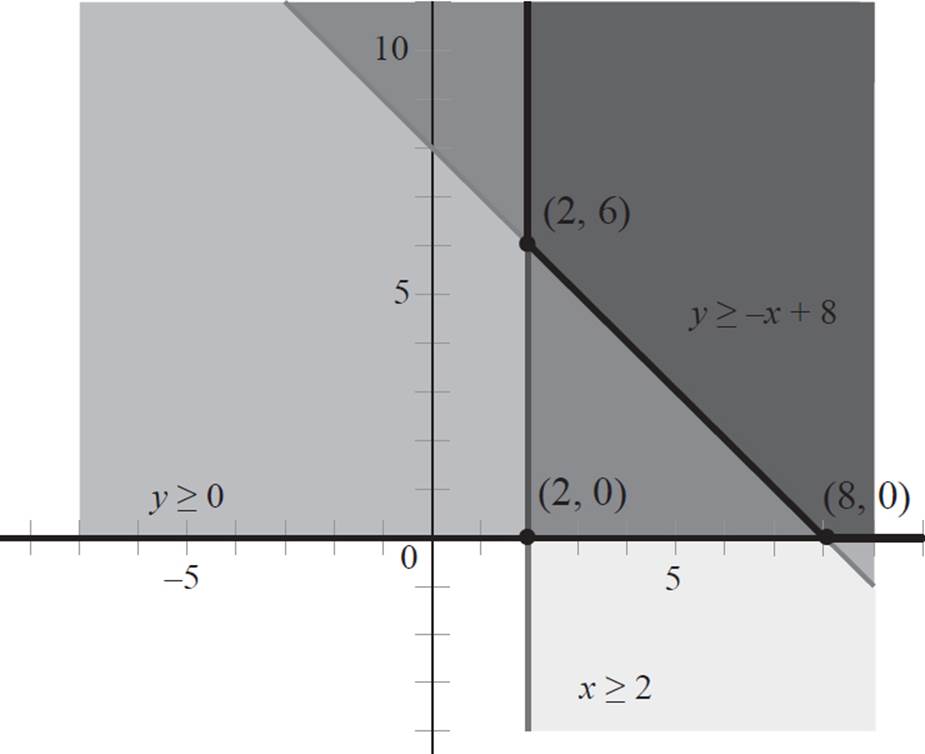
Thus, this is an unbounded system with corner points at (2, 6) and (8, 0).

We’ve covered tons of information in this chapter, so before moving on, make sure you understand the concepts discussed here. You can assess your skills by completing the practice questions on the next page, as well as by completing the Reflect activity at the end of the chapter.
DRILL
CHAPTER 5 PRACTICE QUESTIONS
Click here to download a PDF of Chapter 5 Practice Questions.
Directions: Complete the following problems as specified by each question. For extra practice, try using an alternative method to solve the problem or check your work.
1. y + 6x = 5 − 4x
−y = 2x + 3
Solve the system of linear equations by graphing.
2. What is the slope of a line perpendicular to the line x − 4y = 10 + 2x − y ?
3. 4y + 12 − 2x = 2y + 20
12 − 3x = 3y
Solve the system of equations by substitution.
4. 3y + 6x −120 = −90 + 5x
8 + 2x = 4y − 16
Solve the system of equations algebraically, graph the system, and find the value of ![]() + 2x.
+ 2x.
5. Which of the following lines is the graph of a line parallel to the line defined by the equation 14x + 4y − 4 = 0 ?
A) 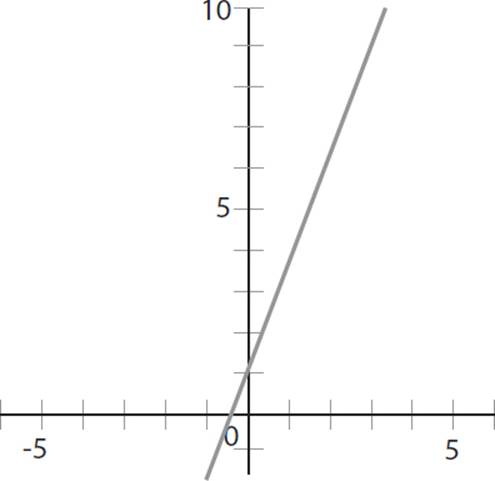
B) 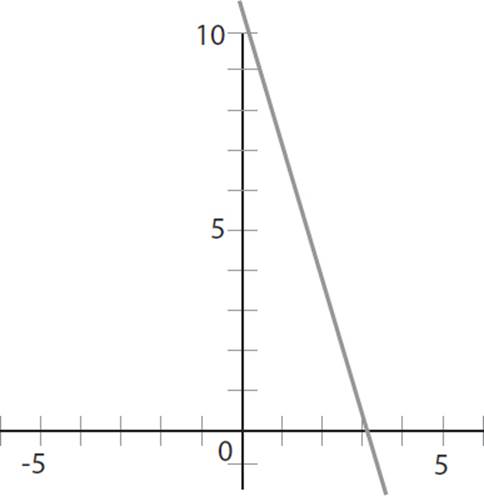
C) 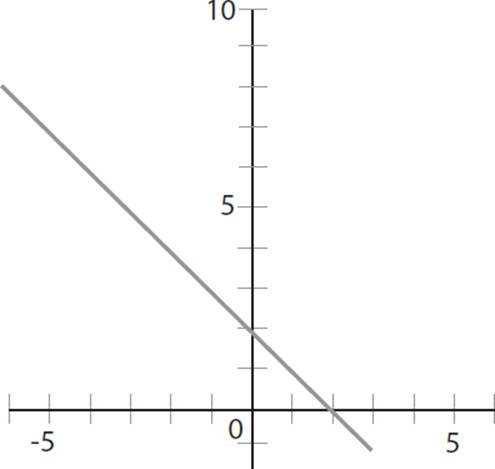
D) 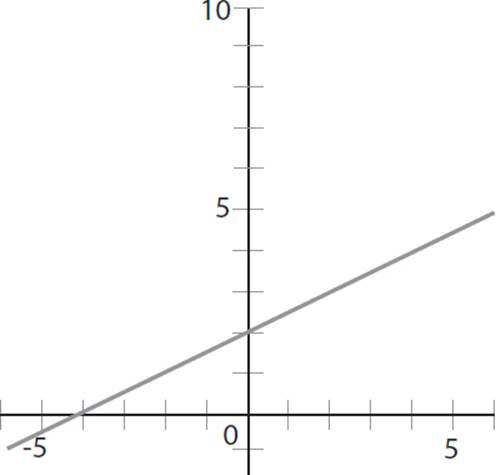
6. y ≤ 4x − 7
2y ≥ −2x + ![]()
Solve the system of inequalities graphically and state whether the solution region is bounded or unbounded.
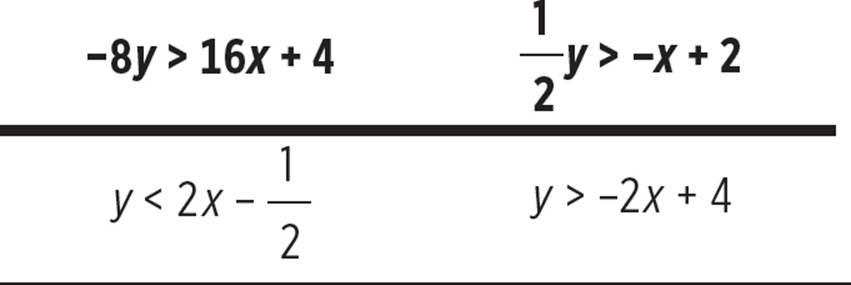
7. −8y > 16x + 4
![]() y > −x + 2
y > −x + 2
Solve the system of inequalities graphically and state whether the solution region is bounded or unbounded.
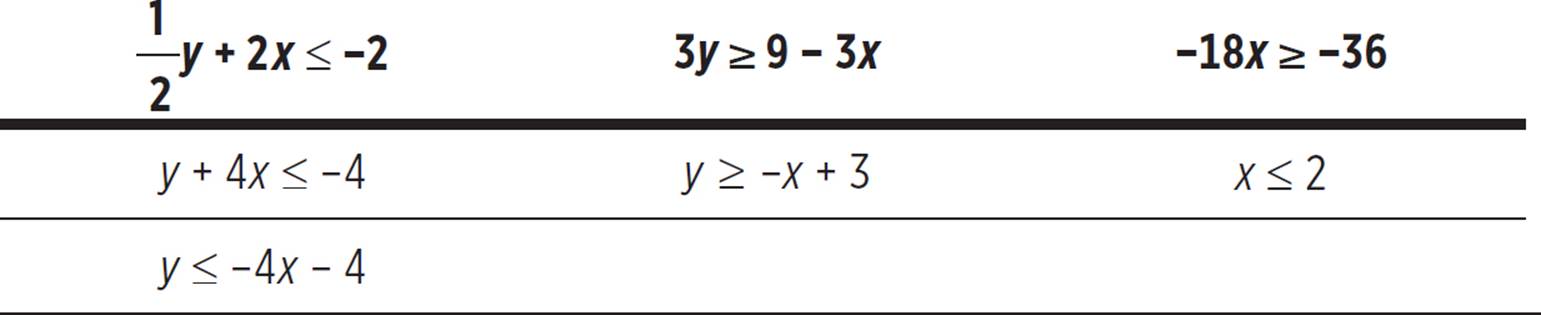
8. ![]() y + 2x ≤ −2
y + 2x ≤ −2
3y ≥ 9 − 3x
−18x ≥ −36
Solve the system of inequalities graphically and state whether the solution region is bounded or unbounded. Then find the coordinates of each corner point.
SOLUTIONS TO CHAPTER 5 PRACTICE QUESTIONS
1. (1, −5)
To solve the system of equations graphically, start by graphing each equation in the coordinate plane. First, though, you need to rewrite each equation in slope-intercept form. The first equation, y + 6x = 5 − 4x, becomes y = 5 − 4x − 6x and y = − 10x + 5; thus, the first equation has a slope of −10 and a y-intercept at (0, 5). Repeat this process with the second equation to find that −y = 2x + 3 becomes y = −2x − 3; thus, the second equation has a slope of −2 and a y-intercept at (0, −3). Graph each equation as follows.
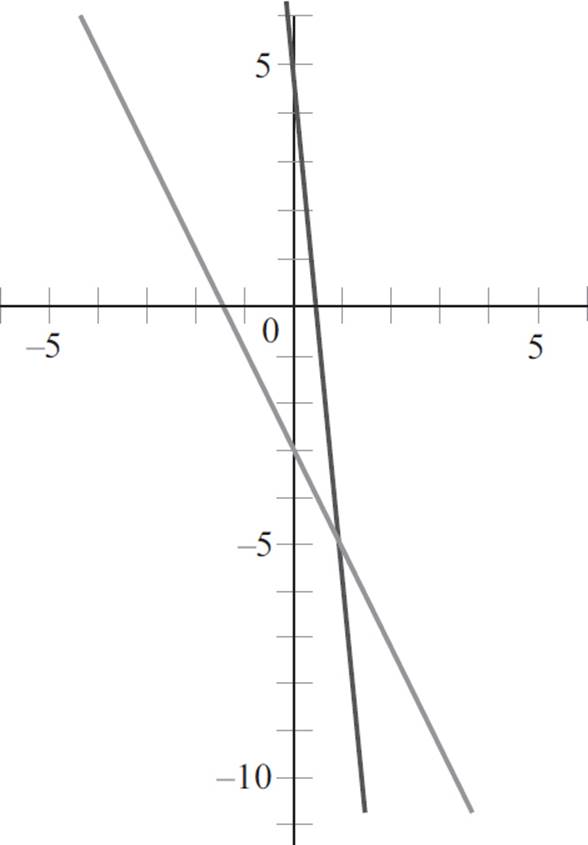
Now, to find the solution to the system of equations, you need to identify the point of intersection. Therefore, refer to the graph and find the point where the two lines meet.
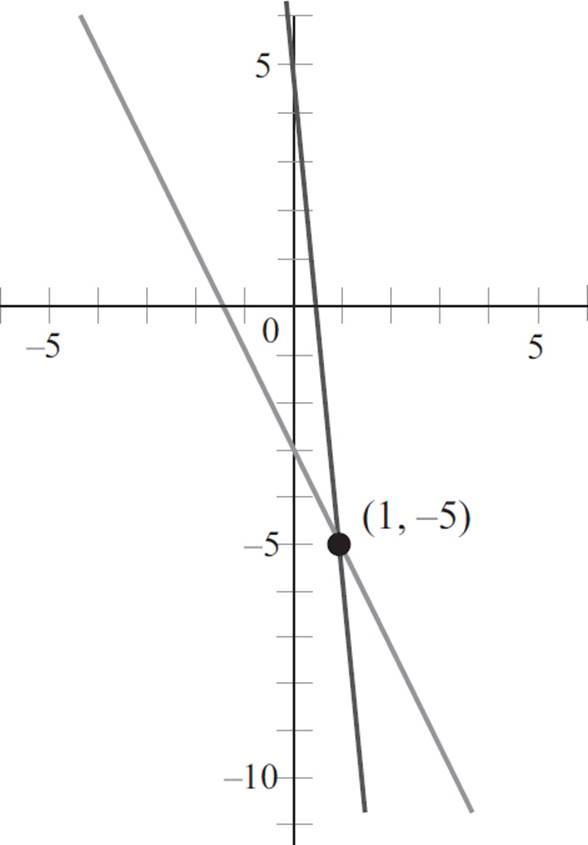
Here, the two lines intersect at (1, −5).
2. 3
This question requires you to find the slope of a line perpendicular to the line x − 4y = 10 + 2x − y. First, you need to identify the slope of the given line, so rewrite the equation in y = mx + b form:
x − 4y = 10 + 2x − y
x − 2x − 10 = 4y − y
−x − 10 = 3y
3y = −x − 10
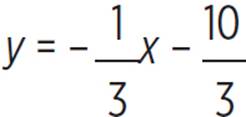
Therefore, the slope of the original line is −1/3. Now you need to find the slope of a line perpendicular to the original line; recall that perpendicular lines have slopes that are negative reciprocals of one another. Therefore, a line perpendicular to the original line will have a slope of −(−3) = 3.
3. (0, 4)
This question asks you to solve the system of equations by substitution. To use the substitution method, start by isolating either the x or y value in either equation. You can isolate y in the first equation, 4y + 12 − 2x = 2y + 20, as follows:
4y + 12 − 2x = 2y + 20
4y − 2y = 2x + 20 − 12
2y = 2x + 8
y = x + 4
Now, substitute the value y = x + 4 into the second equation, 12 − 3x = 3y, to solve for x as follows:
12 − 3x = 3y
12 − 3x = 3(x + 4)
12 − 3x = 3x + 12
12 − 12 = 3x + 3x
0 = 6x
x = 0
Next, substitute x = 0 into either of the original equations. When you substitute x = 0 into the second equation, 12 − 3x = 3y, you will find that
12 − 3(0) = 3y
12 − 0 = 3y
3y = 12
y = 4
Accordingly, the lines intersect at (0, 4), which is the solution to this system of equations.
4. 13.8
In order to solve this system of equations algebraically, you first need to isolate either the x- or y-variable in each equation. Start by isolating the y-variable, putting the equations in slope-intercept form so that you can graph them easily.
|
3y + 6x − 120 = −90 + 5x |
8 + 2x = 4y − 16 |
|
3y = −6x + 5x − 90 + 120 |
4y = 2x + 8 + 16 |
|
3y = −x + 30 |
4y = 2x + 24 |
|
y = −1/3x + 10 |
y = 1/2x + 6 |
Next, graph the two equations in the coordinate plane, noting that the first equation has a slope of −1/3 and a y-intercept at (0, 10), and the second equation has a slope of 1/2 and a y-intercept at (0, 6). The graph will appear as follows:
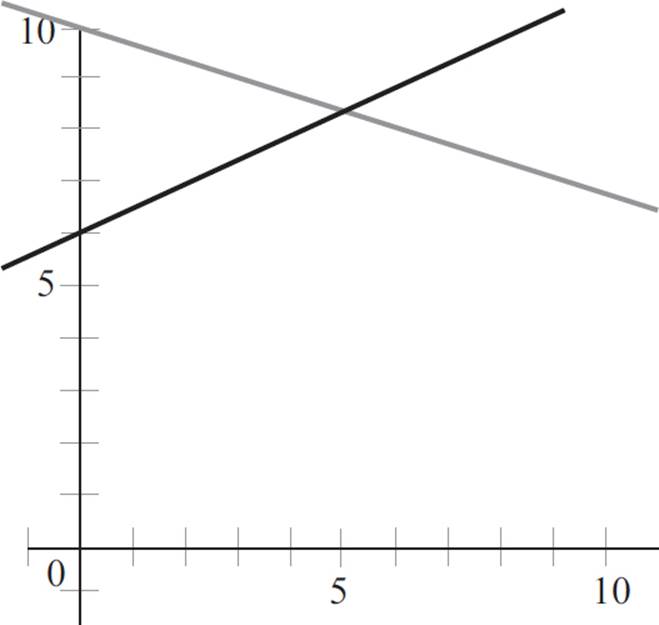
In addition to graphing the equations, isolating the y-variable allows you to set the two equations equal to one another and solve for x:
−1/3x + 10 = 1/2x + 6
1/2x + 1/3x = 10 − 6
3/6x + 2/6x = 4
5/6x = 4
5x = 24
x = 24/5 or 4.8
Next, plug x = 4.8 into either equation to solve for y. If you plug x = 4.8 into the second equation, you will find that
y = 1/2x + 6
y = 1/2(4.8) + 6
y = 2.4 + 6
y = 8.4
Therefore, the solution to this system of equations is (4.8, 8.4). However, the question asks you to find the value of y/2 + 2x, so plug in the x- and y-values to find that
y/2 + 2x =
8.4/2 + 2(4.8) =
4.2 + 9.6 = 13.8
Accordingly, the value of y/2 + 2x is 13.8.
5. B
For this question, you need to identify the graph of a line parallel to the line defined by the equation 14x + 4y − 4 = 0. The first step is to identify the slope of the line. When an equation is written in standard form, ax2 + by + c = 0, the slope of a line is equal to −a/b. In the given equation, a = 14 and b = 4, so the slope is −a/b = −14/4 = −7/2. Since the question asks you to find a line parallel to the given equation, you need to identify a graph that also has a slope of −7/2. You can quickly eliminate (A) and (D) because they depict equations that have a positive slope. Now you must determine which of the remaining graphs has a slope of −7/2. The equation in (B) passes through points (3, 0) and (1, 7) and has a slope of 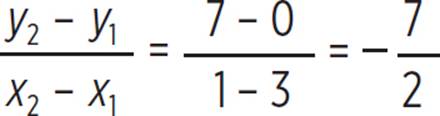 ; keep (B). Conversely, (C) passes through points (2, 0) and (0, 2) and has a slope of
 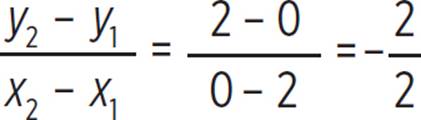 = −1; eliminate (C). Thus, the correct answer is (B).
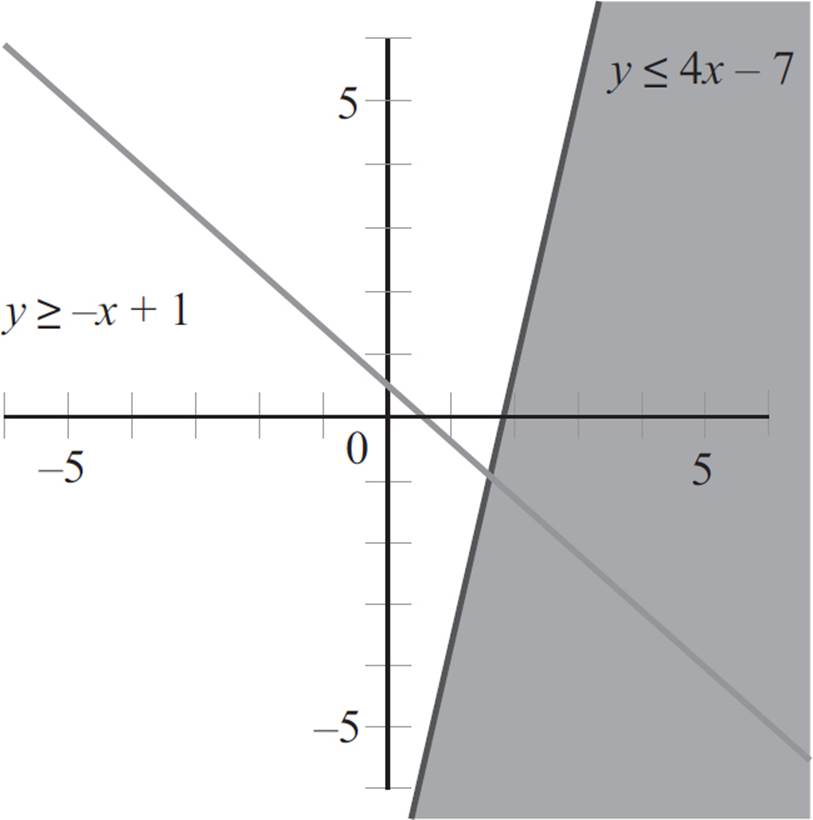
6. Unbounded
Follow the process for graphing linear inequalities. First, graph the two inequalities in the coordinate plane, as you would a linear equation. While the first equation, y ≤ 4x − 7, is in slope-intercept form, you need to rewrite the second equation, 2y ≥ −2x + 1/2, in slope-intercept form as follows: 2y ≥ −2x + 1/2 and y ≥ −x + 1.
Since the sign in the first equation is less than or equal to, and the sign in the second equation is greater than or equal to, you will graph each with a solid boundary line:
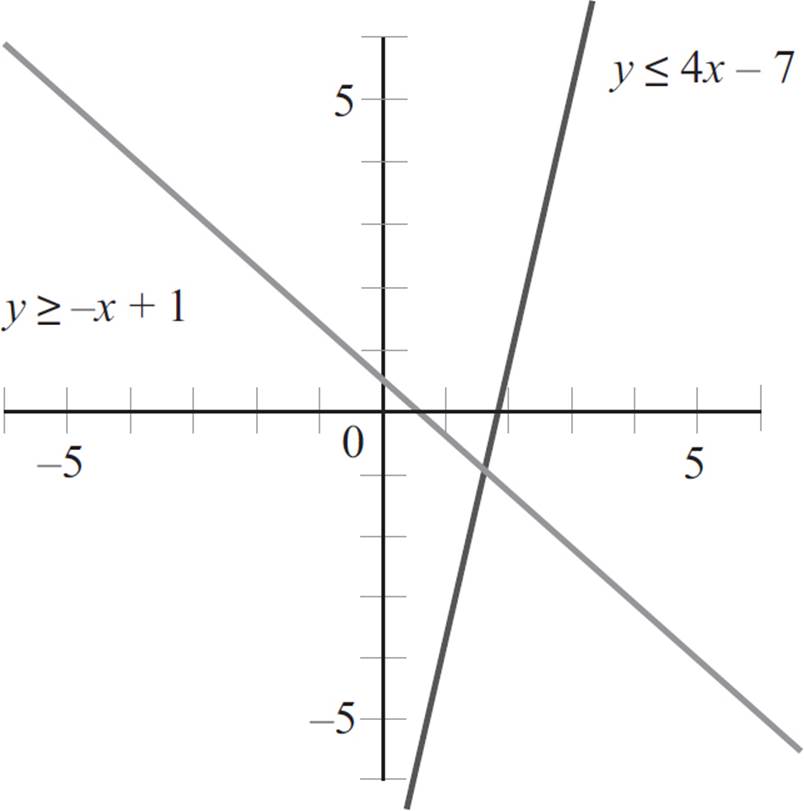
Next, pick a point not on the first boundary line to determine where on the graph the inequality holds true. Let’s plug the point (0, 0) into the first equation, y ≤ 4x − 7 to find that 0 ≤ 4(0) − 7, 0 ≤ 0 − 7, and 0 ≤ −7. Since this is a false statement, you will shade the side of the boundary line that does not contain the point (0, 0).
Now pick a point not on the second boundary line to determine where on the graph the inequality holds true. Again, the point (0, 0) is not on the line, so plug the point (0, 0) into the second equation, y ≥ −x + 1 to find that 0 ≥ −0 + 1 and 0 ≥ 1. Since this is a false statement, you will shade the side of the boundary line that does not contain the point (0, 0).
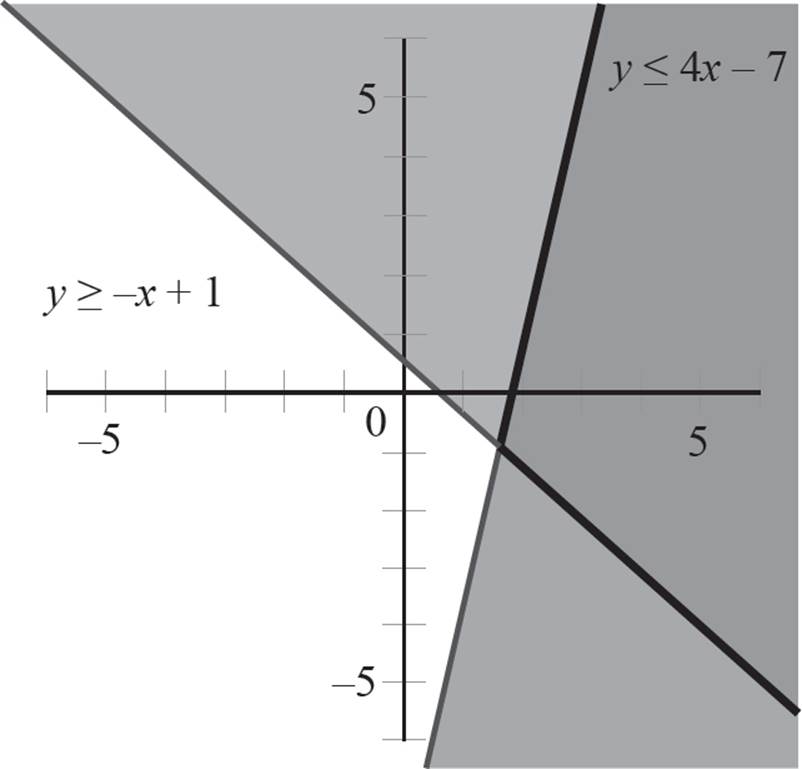
As shown in the graph, the solution for the system of inequalities extends forever along the right half-plane; thus, the solution is unbounded.
7. No solution
In order to solve this system of inequalities, you must first rewrite the inequalities in slope-intercept form.
Next, graph each line, using dashed lines due to the less than and greater than signs used in each equation.
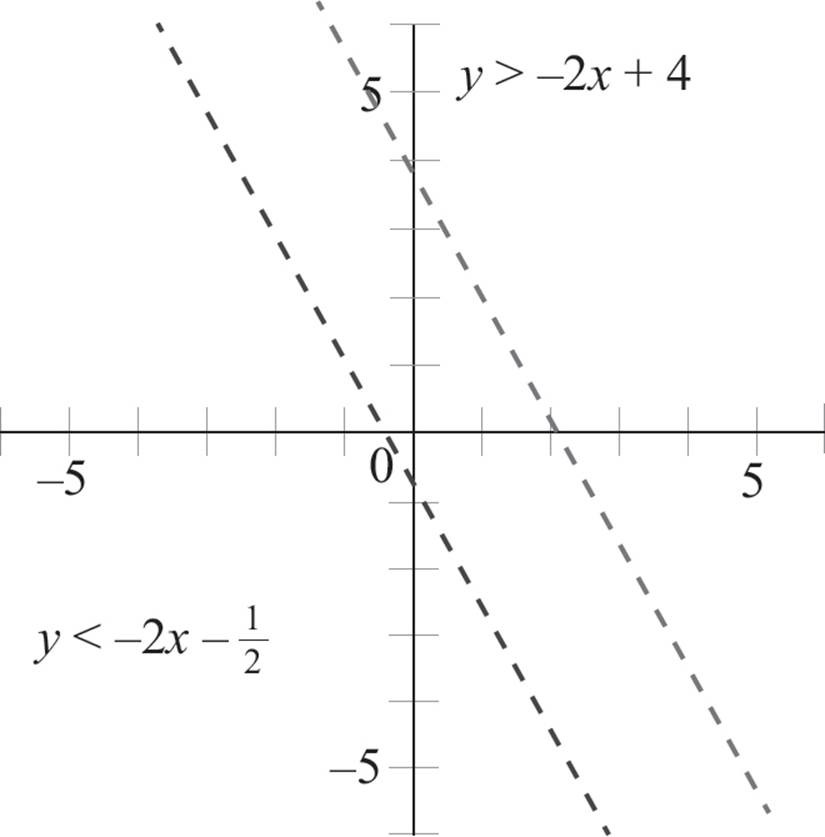
Now select a point that is not on the first line to determine which side of the boundary line to shade. Here, the origin is not on the line, so you can plug the point (0, 0) into the equation, y < −2x − 1/2 to find that 0 < −2(0) − 1/2, 0 < 0 − 1/2, and 0 < −1/2. Since the statement 0 < −1/2 is false, (0, 0) is in the solution set of the first inequality, and you will shade the side of the boundary line that does not contain the origin.
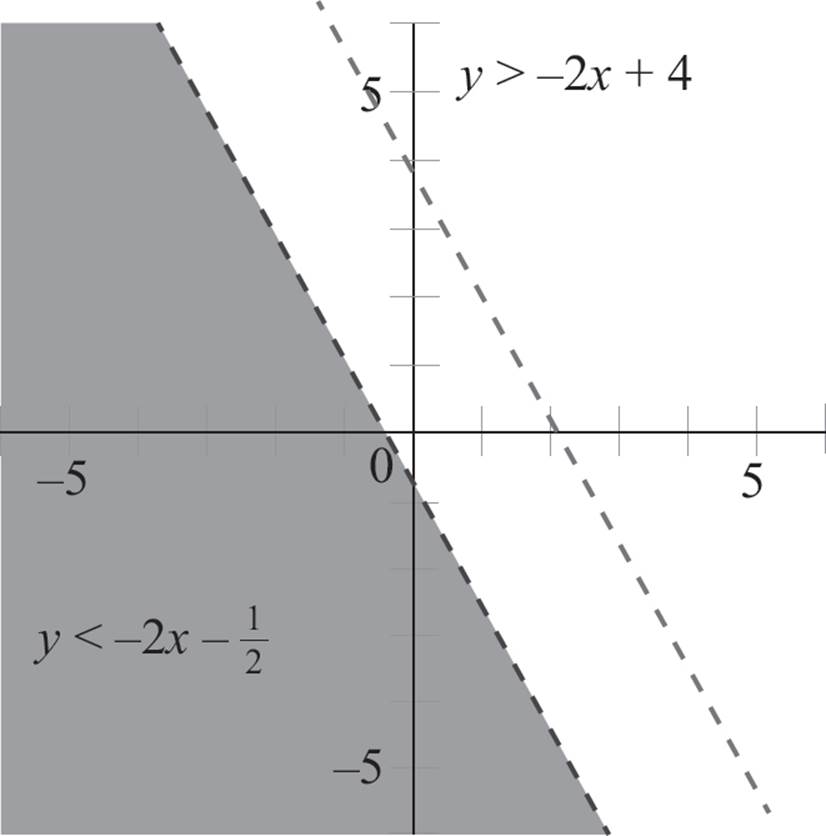
Next, select a point not on the second boundary line to determine which side of the boundary line to shade. Again, the origin is not on the second line, so plug the point (0, 0) into the second equation, y > −2x + 4, to find that 0 > −2(0) + 4, 0 > 0 + 4, and 0 > 4. Since the statement 0 > 4 is false, the origin is not in the solution set of the second inequality, and you need to shade the side of the boundary line that does not contain the origin.
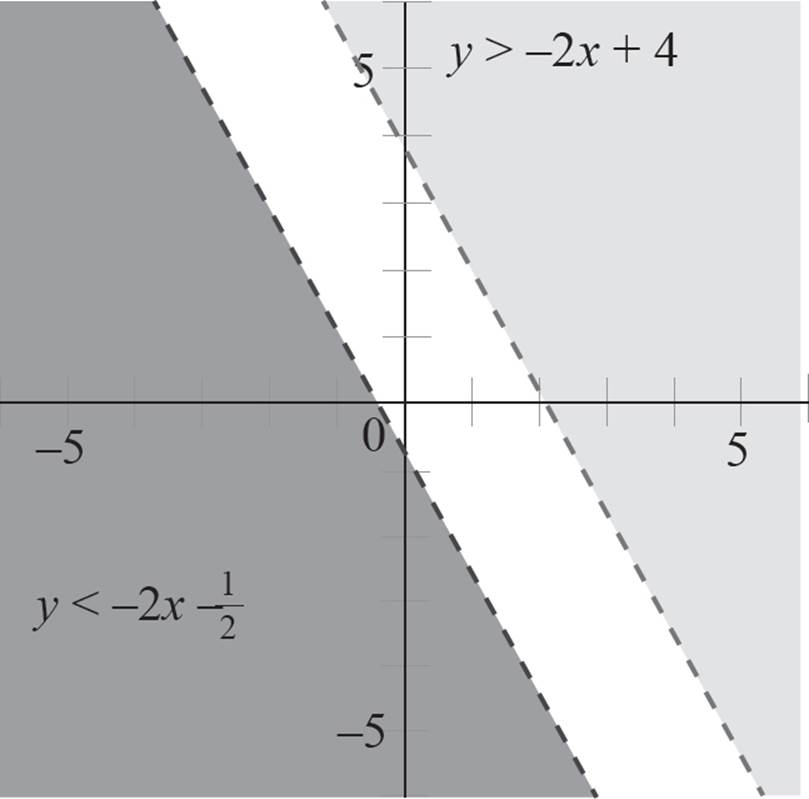
Here, there is no overlapping region, so the system has no solution region and no corner point.
8. Unbounded; Corner point: (−7/3, 16/3)
Follow the process for graphing linear inequalities. The first step is to rewrite the inequalities in slope-intercept form.
Next, graph each inequality with solid boundary lines, as all the inequalities contain greater than or equal to or less than or equal to signs.
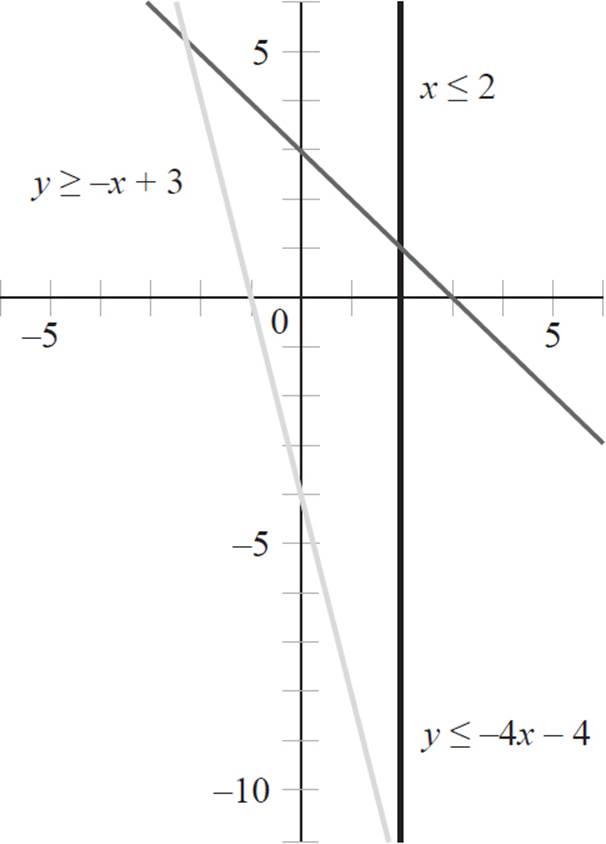
Next, select a point that is not on the first boundary line, y ≤ −4x − 4, to determine which side of the line to shade. Since the origin is not on the line, plug the point (0, 0) into the equation, y ≤ −4x − 4 to find that 0 ≤ −4(0) − 4, 0 ≤ 0 − 4, and 0 ≤ −4. Since 0 ≤ −4 is a false statement, the origin is not in the solution set of the first inequality, and you will shade the side of the boundary line that does not contain the origin.
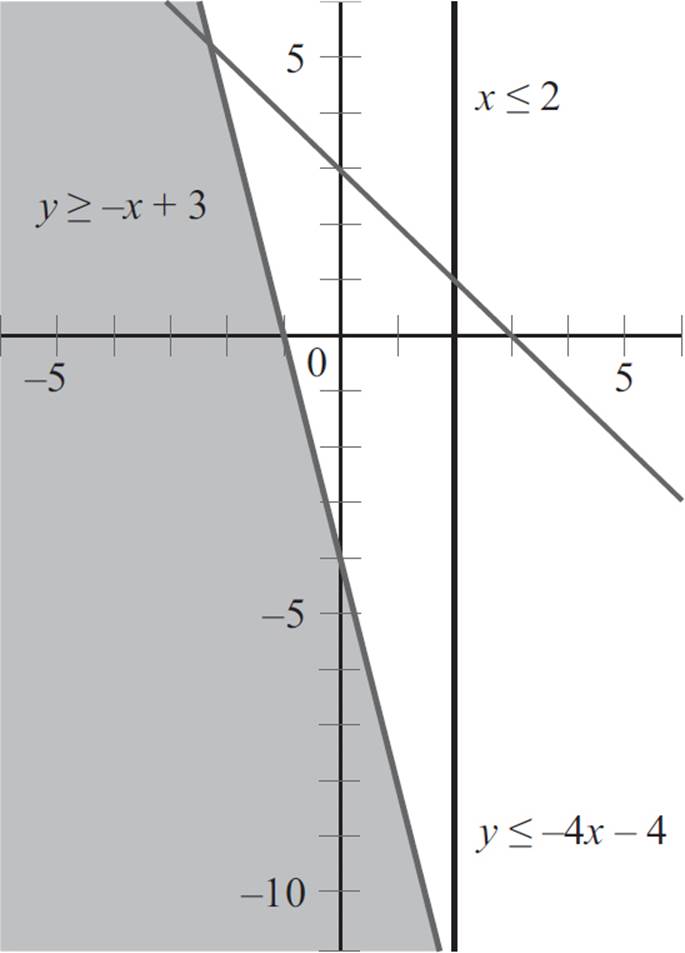
Next, select a point not on the second boundary line to determine which side of the line to shade. Here, the origin is not on the second line, so plug the point (0, 0) into the second equation, y ≥ −x + 3, to find that 0 ≥ −(0) + 3 and 0 ≥ 3. Since the statement 0 ≥ 3 is false, the origin is not in the solution set of the second inequality, and you need to shade the side of the line that does not contain the origin.
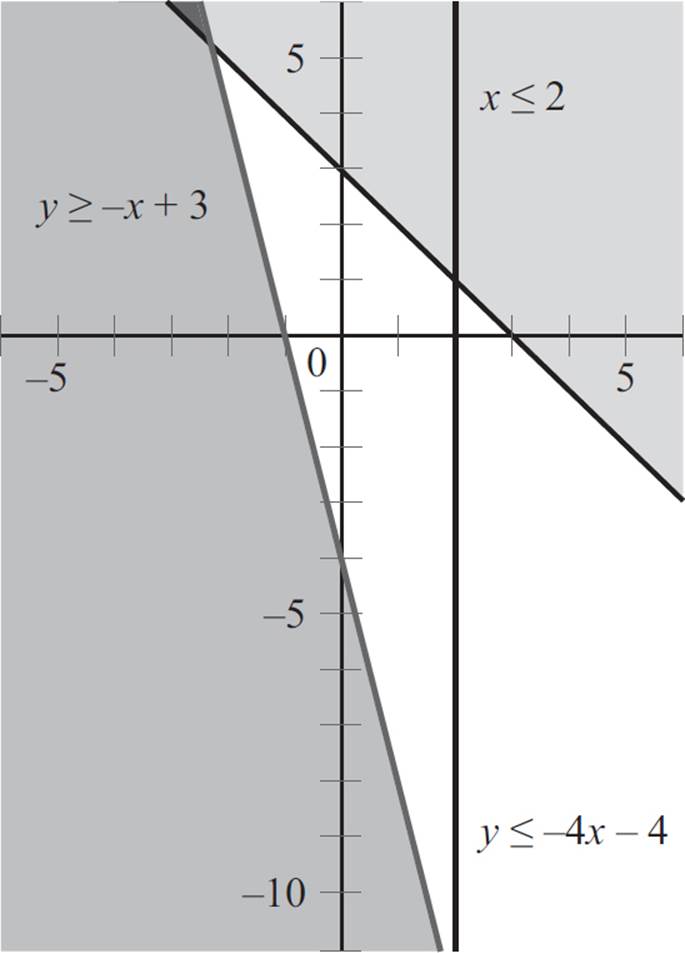
Now, select a point not on the third boundary line to determine which side of the line to shade. Here, the origin is not on the second line, so you can plug in (0, 0) into the second equation, x ≤ 2 to find that 0 ≤ 2. The statement 0 ≤ 2 is true, so the origin is in the solution set of the third inequality, and you need to shade the side of the boundary line that contains the origin.
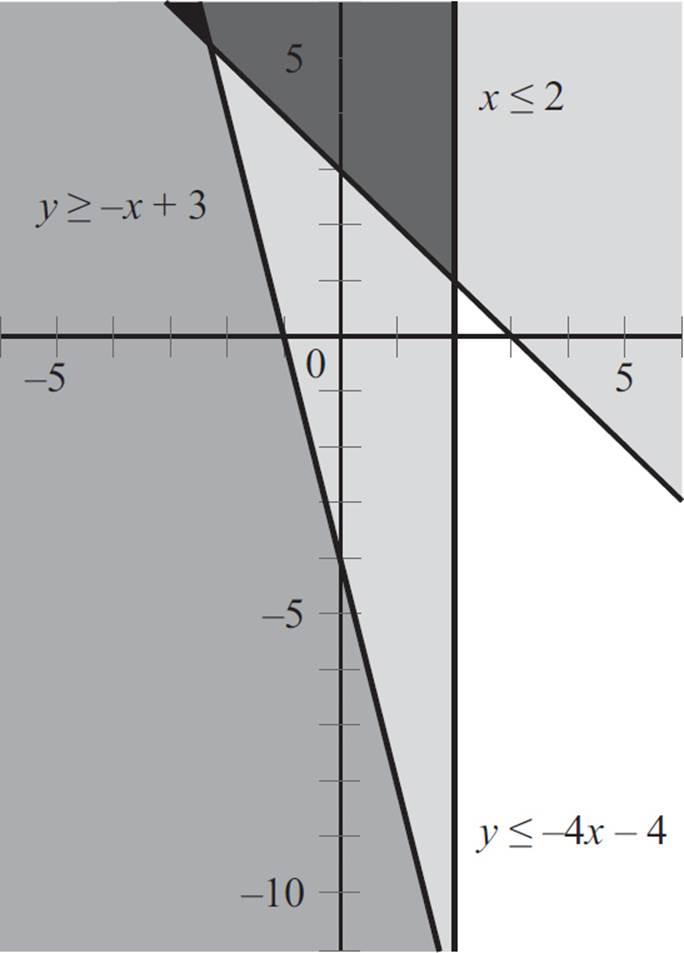
In this scenario, the solution region is an unbounded system, outlined as follows.
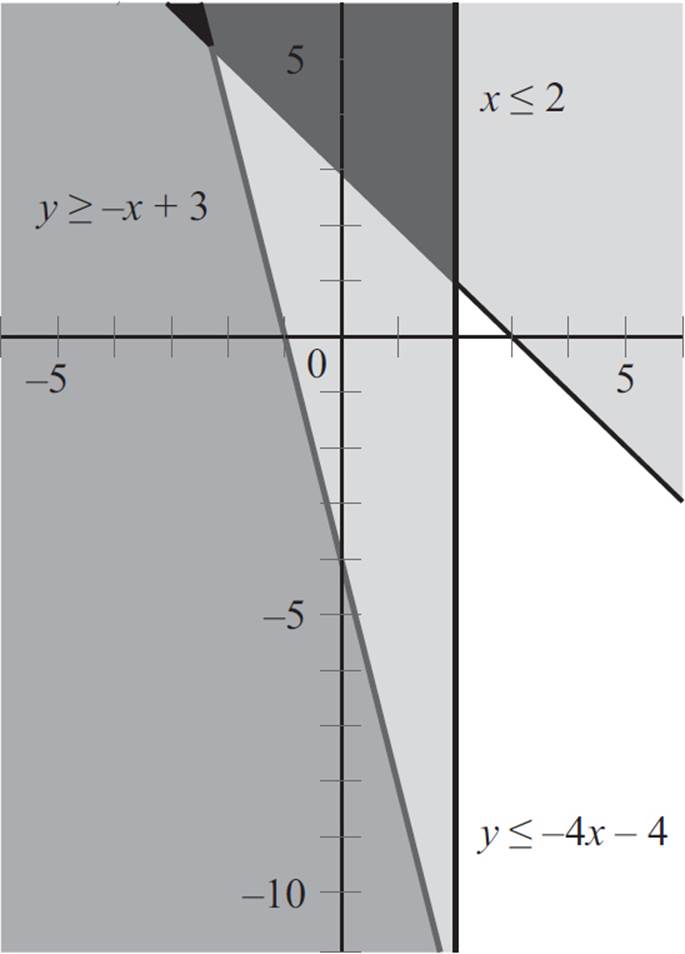
Finally, you need to find the corner points in this system. Unfortunately, due to the scale of our graph, you can’t find the corner points just by looking at the graph. Instead, you need to find the intersection points of the first two inequalities, y ≤ −4x − 4 and y ≥ −x + 3. When you convert these inequalities into equations and set them equal to one another, you will find that −x + 3 = −4x − 4, 3x = −7, and x = −7/3. Now, substitute x = −7/3 into the second equation to find y: y = −x + 3, y = −(−7/3) + 3, y = 7/3 + 9/3, and y = 16/3. Thus, the corner point is (−7/3, 16/3).
REFLECT
Congratulations on completing Chapter 5!
Here’s what we just covered.
Rate your confidence in your ability to:
•Define and categorize systems of linear equations
1 2 3 4 5
•Solve systems of equations questions with methods such as graphing, substitution, addition or subtraction, and algebra
1 2 3 4 5
•Calculate the slopes of parallel and perpendicular lines
1 2 3 4 5
•Graph and solve linear inequalities
1 2 3 4 5
If you rated any of these topics lower than you’d like, consider reviewing the corresponding lesson before moving on, especially if you found yourself unable to correctly answer one of the related end-of-chapter questions.
CHAPTER 5 KEY POINTS
![]() A system of equations is a set of equations that share variables and work together in the coordinate plane.
A system of equations is a set of equations that share variables and work together in the coordinate plane.
![]() The solution to a system of equations will be the point(s) of intersection. A system of equations can have an infinite number of solutions, one solution, or no solution.
The solution to a system of equations will be the point(s) of intersection. A system of equations can have an infinite number of solutions, one solution, or no solution.
![]() When a system of equations has no solution, the equations are referred to as inconsistent. Conversely, if a system of equations has either an infinite number of solutions or exactly one solution, the equations are referred to as consistent.
When a system of equations has no solution, the equations are referred to as inconsistent. Conversely, if a system of equations has either an infinite number of solutions or exactly one solution, the equations are referred to as consistent.
![]() A system of equations with exactly one solution is known as an independent system, as each equation provides unique information. Conversely, a system of equations with an infinite number of solutions is known as a dependent system, because the equations provide identical information.
A system of equations with exactly one solution is known as an independent system, as each equation provides unique information. Conversely, a system of equations with an infinite number of solutions is known as a dependent system, because the equations provide identical information.
![]() Systems of equations can be solved in multiple ways: graphing, substitution, adding or subtracting equations, or by using algebra.
Systems of equations can be solved in multiple ways: graphing, substitution, adding or subtracting equations, or by using algebra.
![]() If you use the substitution method and cannot find the value of the second variable, and instead find that both sides of the equations are equivalent numerical values, the system of equations has an infinite number of solutions.
If you use the substitution method and cannot find the value of the second variable, and instead find that both sides of the equations are equivalent numerical values, the system of equations has an infinite number of solutions.
![]() Parallel lines have equal slopes. If the original line has a slope of 4, all lines parallel to the original line will also have slopes of 4.
Parallel lines have equal slopes. If the original line has a slope of 4, all lines parallel to the original line will also have slopes of 4.
![]() The slope of a perpendicular line is equal to the negative reciprocal of the original line. If the original line has a slope of 4, a line perpendicular to the original line will have a slope of −1/4.
The slope of a perpendicular line is equal to the negative reciprocal of the original line. If the original line has a slope of 4, a line perpendicular to the original line will have a slope of −1/4.
![]() Use the following process for graphing a system of linear inequalities:
Use the following process for graphing a system of linear inequalities:
○ Solve each inequality for y.
○ Graph each inequality independently of one another.
• If the inequality contains a ≥ or ≤, the boundary line will be solid.
• If the inequality contains a > or <, the boundary line will be dashed.
○ Select a point not on the line to see if the inequality holds true.
• If the inequality holds true, shade the area on the side of the boundary line that contains the test point.
• If the inequality is false, shade the area on the side of the boundary line that does not contain the test point.
![]() The solution region of a system of inequalities is the area where the solutions overlap.
The solution region of a system of inequalities is the area where the solutions overlap.
![]() When you graph an inequality in the coordinate plane, the graph is divided into half-planes.
When you graph an inequality in the coordinate plane, the graph is divided into half-planes.
○ A vertical line divides the coordinate plane into left and right half-planes.
○ A non-vertical line divides the coordinate plane into upper and lower half-planes.
![]() A corner point in a system of inequalities is the point in the solution region where two boundary lines intersect.
A corner point in a system of inequalities is the point in the solution region where two boundary lines intersect.