High School Algebra I Unlocked (2016)
Chapter 7. Function Basics
Lesson 7.4. Graphing Functions
As mentioned earlier, when graphing functions, you follow the same process used to graph equations. Just as with linear equations, you need to write linear functions in slope-intercept form, y = mx + b or ƒ(x) = mx + b, before graphing the function. Additionally, like equations, when a linear function is in slope-intercept form, m represents the slope, and b represents the y-intercept. The x-intercept of a function can be found by setting ƒ(x) equal to zero and solving for x.
Let’s take a look at how we might graph a linear function.
EXAMPLE 
Graph ƒ(x) = 3x + 5.
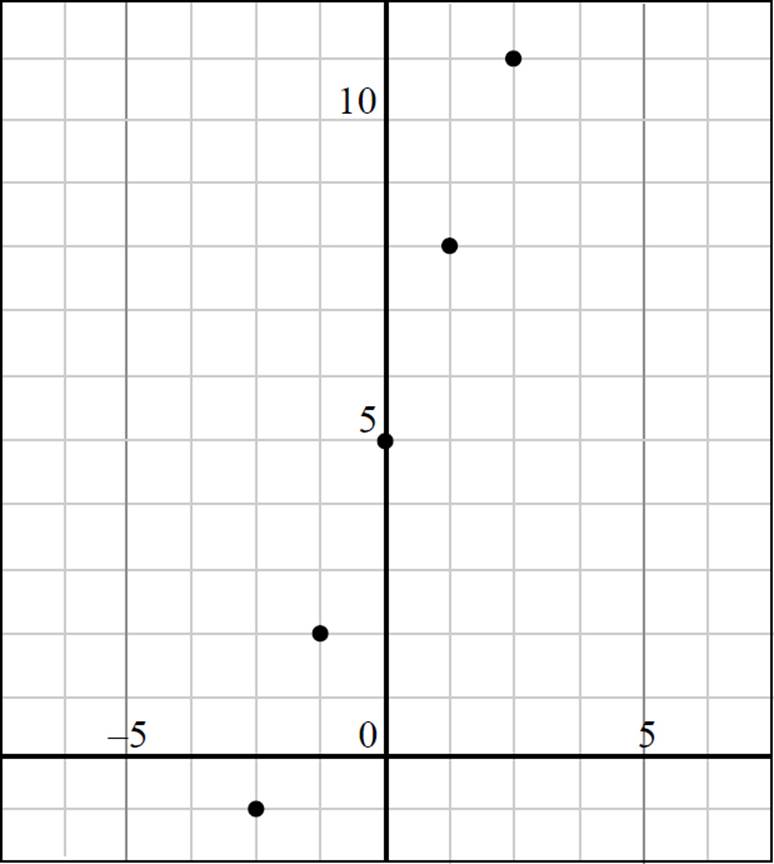
Since you need to graph the function ƒ(x) = 3x + 5, you first must determine your plot points by substituting values of x into the given function and then finding the associated value of ƒ(x):
|
x |
ƒ(x) |
|
−2 |
−1 |
|
−1 |
2 |
|
0 |
5 |
|
1 |
8 |
|
2 |
11 |
When choosing numbers
to plug in for x to find
the value of ƒ(x), select
numbers that are easy to
work with such as −2, −1,
0, 1, 2. Avoid plugging
in large numbers, as
they will make the math
more difficult and the
graph harder to plot.
Based on the chart, the following points can be plotted in the coordinate plane: (−2, −1), (−1, 2), (0, 5), (1, 8), and (2, 11).
Here is how you may see graphing linear and quadratic functions on the SAT.
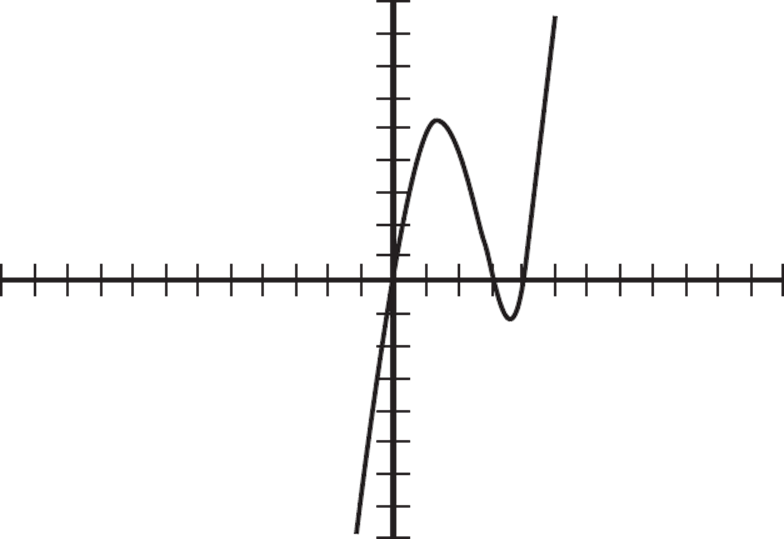
The graph of ƒ(x) is shown below. Which of the following accurately represents the function ƒ(x) ?
A) ƒ(x) = (x + 3)(x + 4)
B) ƒ(x) = (x − 3)(x − 4)
C) ƒ(x) = x(x + 3)(x − 4)
D) ƒ(x) = x(x − 3)(x − 4)
Finally, simply draw a line through the points you’ve plotted:
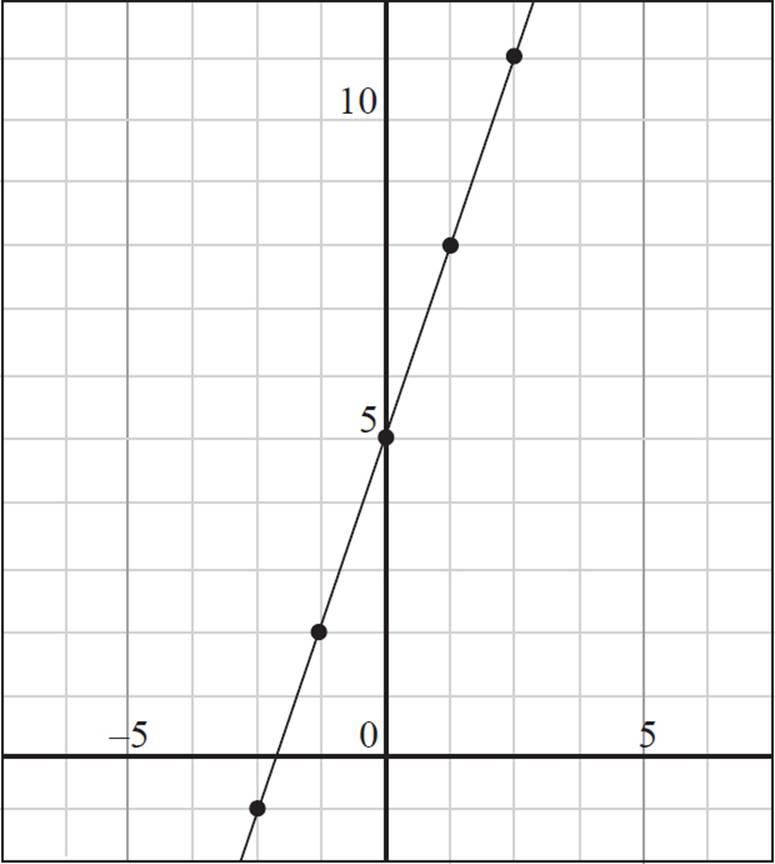
There you go: you’ve graphed a function!

You will also have to graph non-linear functions, such as quadratic or cubic functions. Let’s take a look at one of these now.
EXAMPLE 
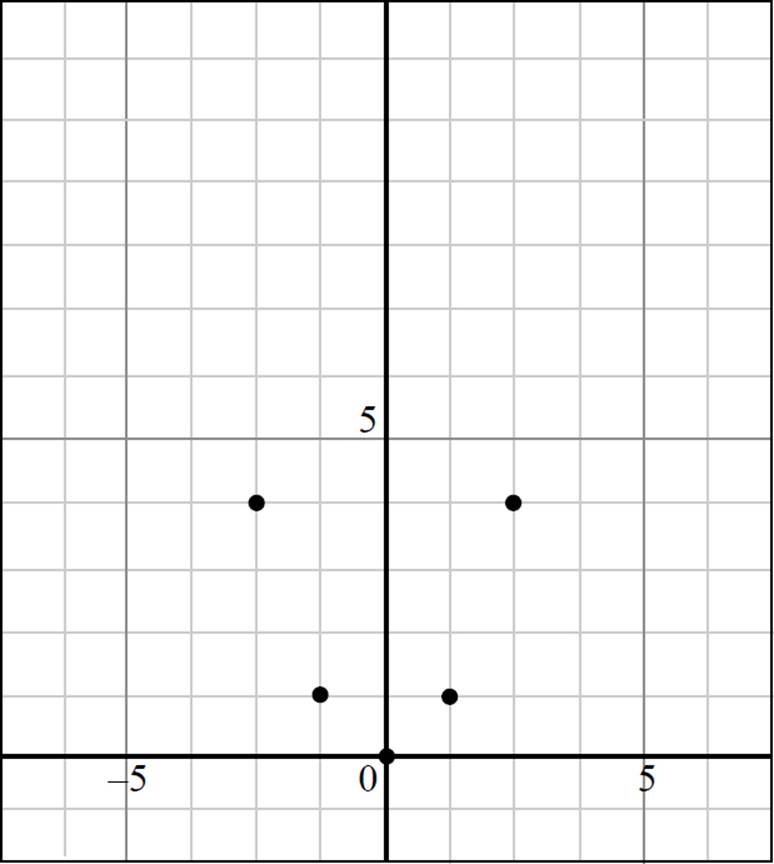
Graph ƒ(x) = x2.
This question requires you to graph the function ƒ(x) = x2, so, like before, come up with plot points by substituting values of x into the given function and finding the associated value of ƒ(x):
|
x |
ƒ(x) |
|
−2 |
4 |
|
−1 |
1 |
|
0 |
0 |
|
1 |
1 |
|
2 |
4 |
Now plot the points you found in the coordinate plane:
Every time the graph of ƒ(x) crosses the x-axis, there is an x-intercept of the function, or a zero of the function, at that point. Based on the graph, the function ƒ(x) goes through points (0, 0), (3, 0), and (4, 0), and, therefore, must have three x factors. Eliminate (B) and (C), as they only have two factors of x. Since the function crosses the x-axis at (3, 0) and (4, 0), we need a function formula that has the factors (x − 3) and (x − 4). Therefore, ƒ(x) = x(x − 3)(x − 4), and the correct answer is (D).
If you don’t remember how the zeros of a function are represented in factored form, you can use the plugging in method. Since the graph of ƒ(x) includes the points (0, 0), (3, 0), and (4, 0), we would expect ƒ(x) = 0 when we set x = 0, 3, or 4. If you setx = 3, the output for (A) is 189, the output for (B) is 0, the output for (C) is 18, and the output for (D) is 0; eliminate (A) and (C). If you set x = 4, the output for (B) is 32; eliminate (B). The only choice that gives ƒ(x) = 0 when we set x = 0, 3, or 4, is (D).
Then draw a line through the points you’ve plotted:
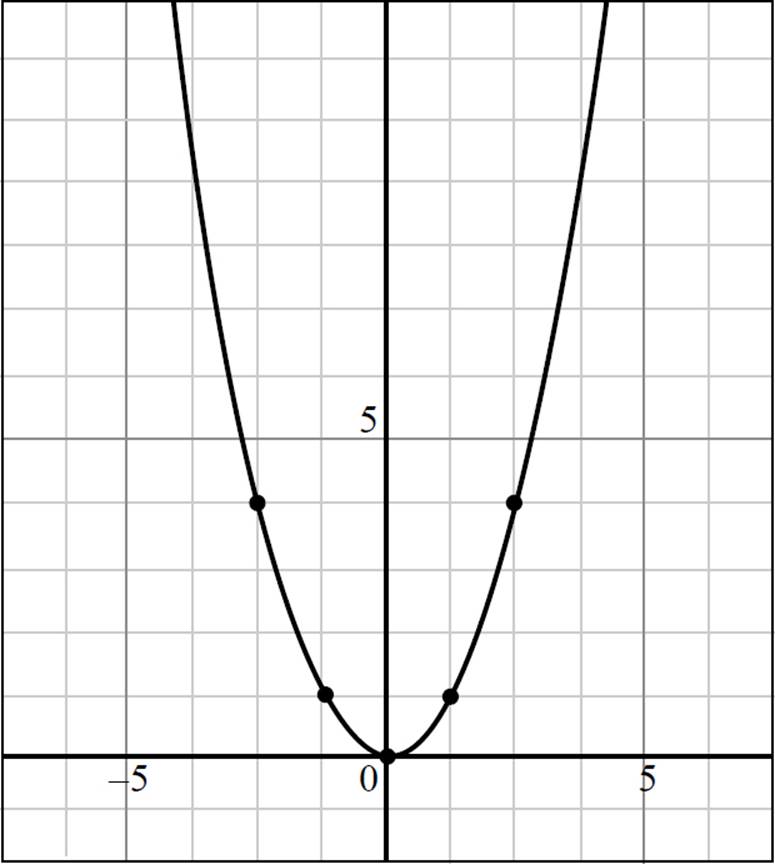
When you connect the dots, you are left with the graph of ƒ(x) = x2, which is the standard graph for a quadratic equation centered at the origin.
Finally, the question requires you to determine the domain (all possible x-values) and range (all possible y-values), of the function. Since the function ƒ(x) = x2 has a vertex at (0, 0) and extends upwards and outwards infinitely, the domain is (−∞, ∞) and the range is [0, ∞).

Fantastic! You’ve successfully tackled graphing linear and quadratic functions. As you can see, graphing linear and quadratic functions is quite similar to graphing linear equations and quadratic equations. Now assess your understanding of the material by trying the practice problems at the end of the chapter.
DRILL
CHAPTER 7 PRACTICE QUESTIONS
Click here to download a PDF of Chapter 7 Practice Questions.
Directions: Complete the following problems as specified by each question. For extra practice, try using an alternative method to solve the problem or check your work.
1. If ƒ(x) = (2x + 4)3 − 5x − 3, what is ƒ  ?
?
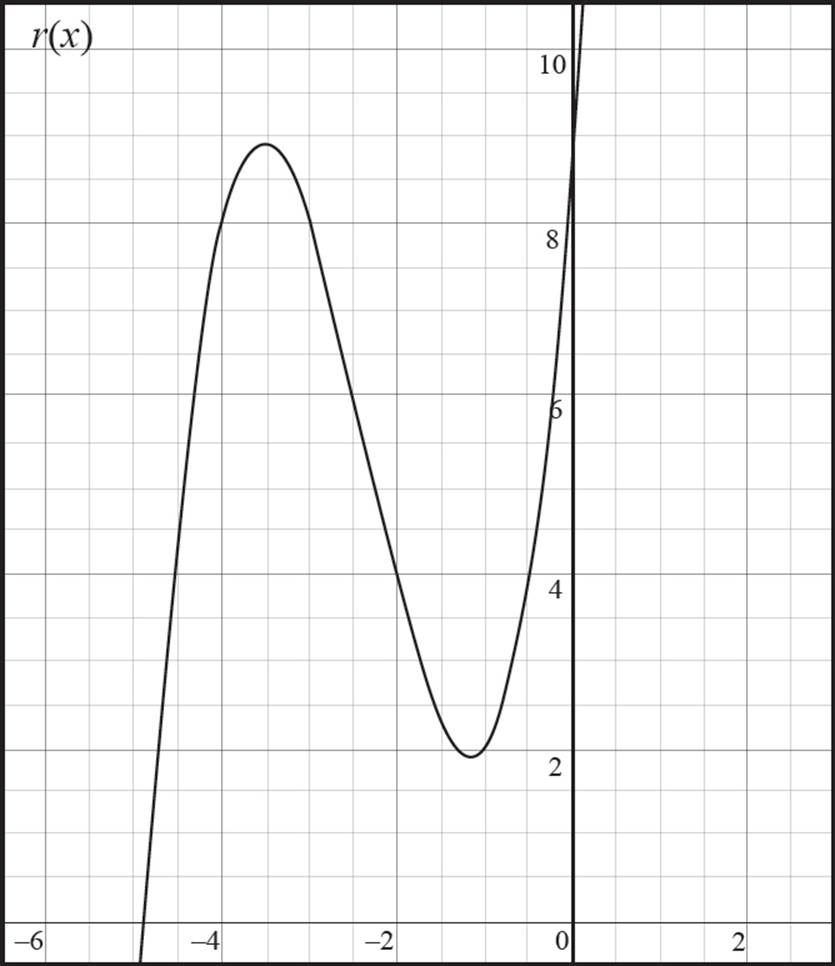
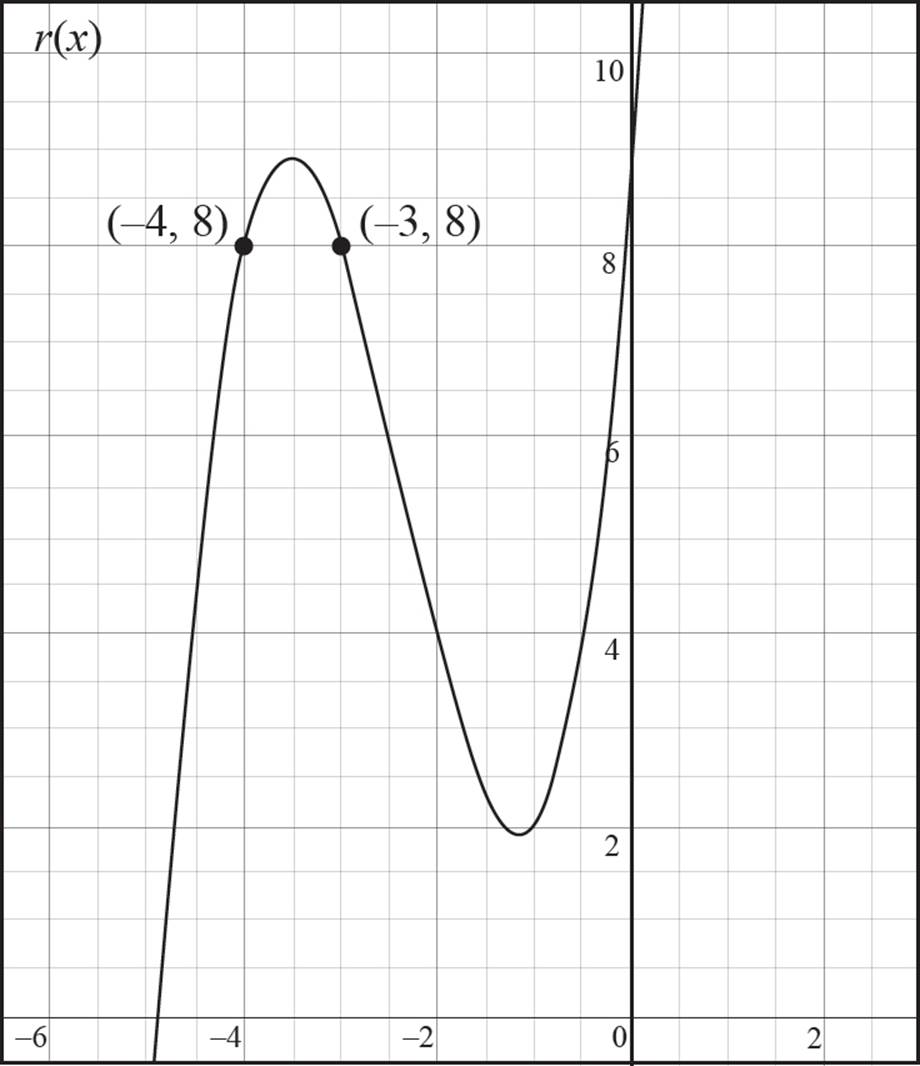
2. Given the graph of r (x) below, what are the values of r (−3) and r (−4)?
3. Given the function b(x) = −![]() x − 2, state whether the function is linear, quadratic, cubic, or exponential. Then graph the function in the coordinate plane and state whether the function is increasing, decreasing, or constant.
x − 2, state whether the function is linear, quadratic, cubic, or exponential. Then graph the function in the coordinate plane and state whether the function is increasing, decreasing, or constant.
4. Given the following function table for the quadratic function c(x), what is the value of a ?
|
x |
ƒ(x) |
|
−2 |
2.48 |
|
−1 |
1.58 |
|
0 |
0.68 |
|
1 |
a |
|
2 |
2.48 |
5. Determine whether the relation 4x = 2y2 − 8 is a function. If the relation is a function, state its domain and range.
Questions 6−8 refer to the following graph.
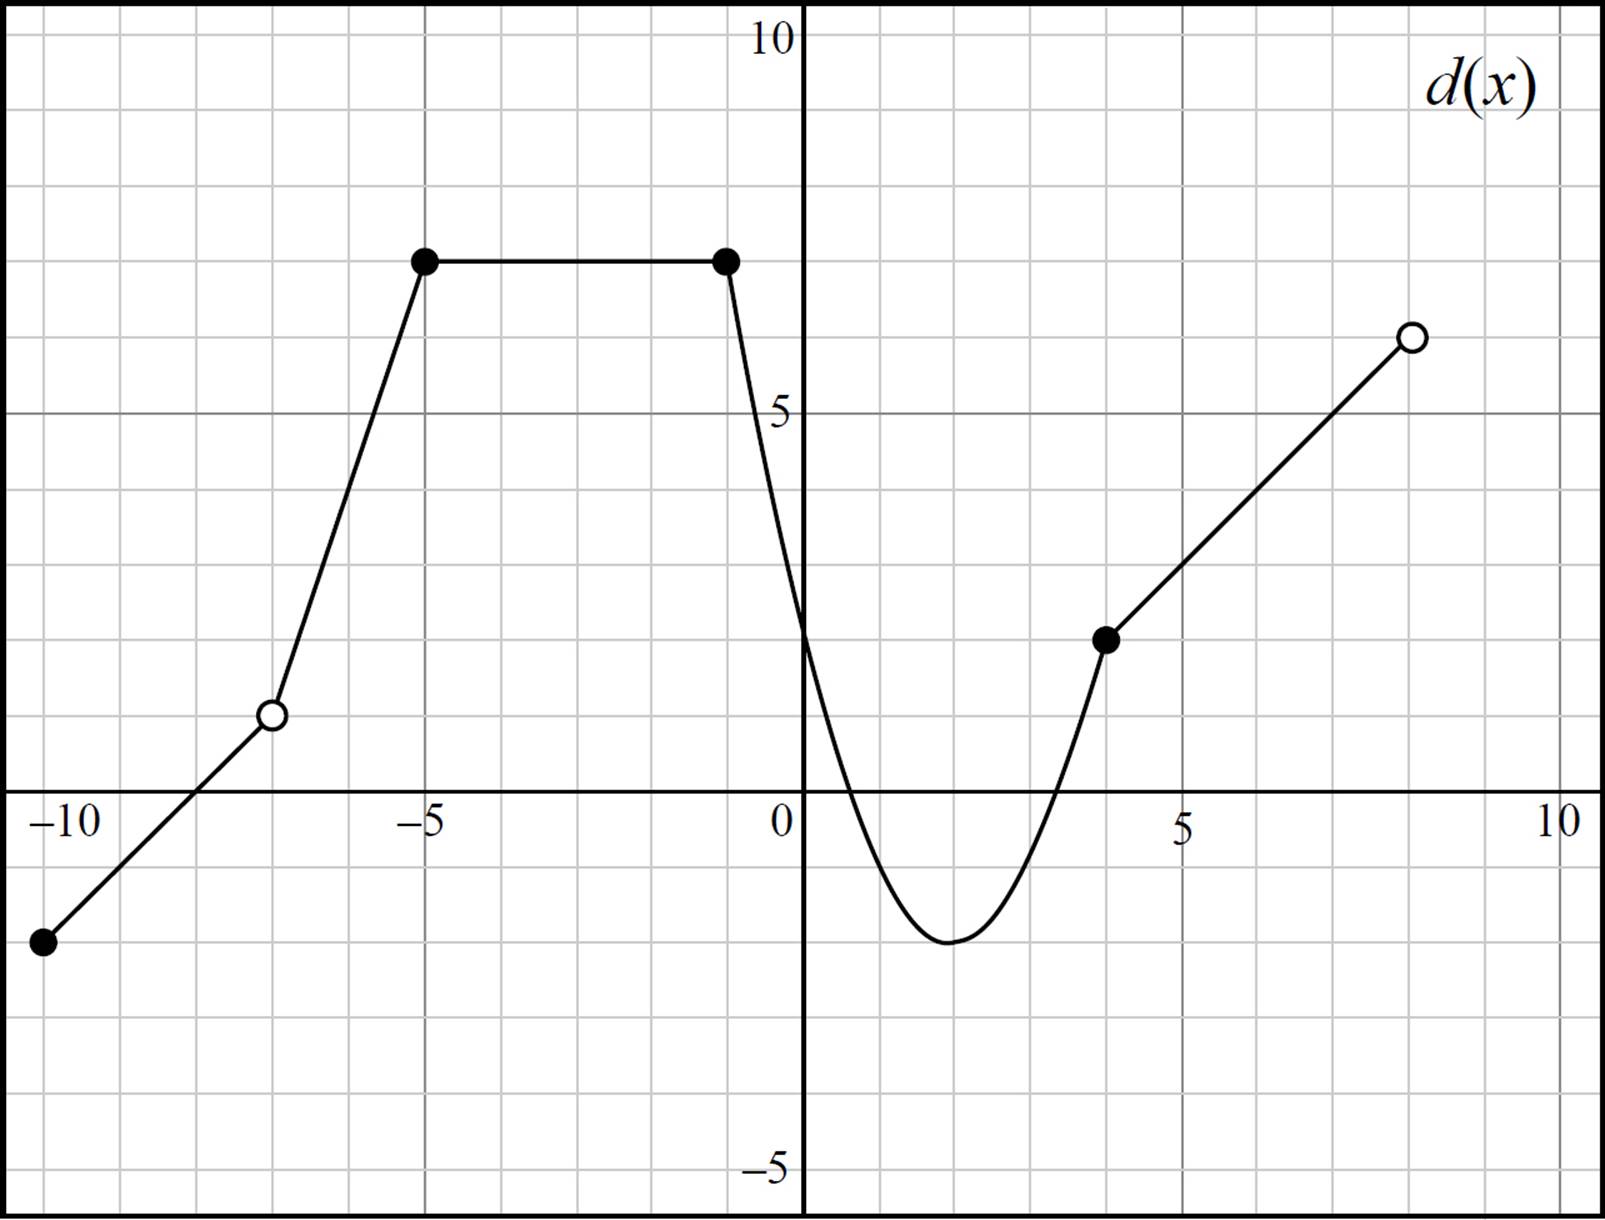
6. Evaluate d(−6) and d(2).
7. State whether the function is continuous or discontinuous. Provide the domain and range of d(x) in interval notation.
8. The function d(x) is ____ from (−10, −7), ____ from (−5,−1), and ____ from (−1, 2). (Intervals represent the domain of d(x).)
A) increasing; decreasing; constant
B) decreasing; constant; increasing
C) constant; increasing; decreasing
D) increasing; constant; decreasing
SOLUTIONS TO CHAPTER 7 PRACTICE QUESTIONS
1.  or 119.5
This question requires you to find ƒ , given that ƒ(x) = (2x + 4)3 − 5x − 3. To solve, plug in the given value for the variable in the function and simplify:
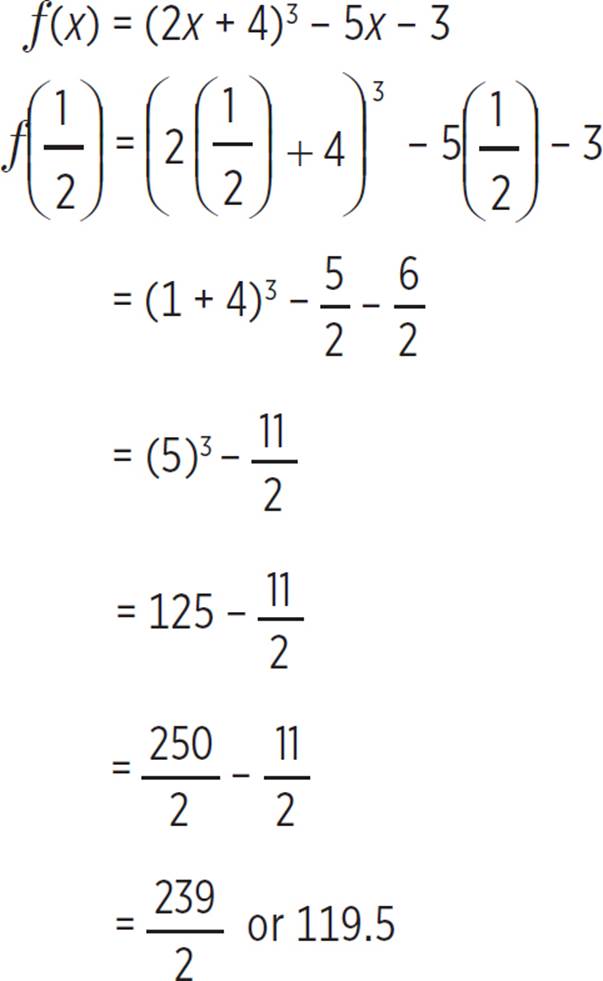
Therefore, the value of ƒ , given that ƒ(x) = (2x + 4)3 − 5x − 3, is  or 119.5.
2. 8, 8
Here you to determine the values of r(−3) and r(−4), given the graph of r(x). Start by finding r(−3). You are given the input value, x = −3, so look at the graph and find the associated output value, or y-value, of the function. Be careful here. There are four intervals between −4 and −2, so each interval is 1/2. Therefore, −3 is two intervals to the left of −2. In this scenario, r(−3) = 8. Now repeat the process to find r(−4). Here the input value is x = −4, and, based on the graph, the associated output value of the function is 8;r(−4) = 8. Thus, the value of both r(−3) and r(−4) is 8, as shown in the following graph.
3. Linear; Decreasing
You’re told that function b(x) = −1/2x − 2 and asked to determine the rate of change of the function (increasing, decreasing, or constant), and the type of function. Perhaps the easiest way to begin is by graphing the function in the coordinate plane (even though this is technically one of the last parts of the question.) So, just like you would with any equation, determine points that you can plot in the coordinate plane. To find the y-intercept of the equation, set x = 0 and solve for y, or b(x):
b(x) = −![]() x − 2
x − 2
b(x) = −![]() (0) − 2
(0) − 2
b(x) = −2
Thus, the y-intercept of b(x) = −1/2x − 2 is at (0, −2). To find the x-intercept, set y = 0 and solve for x:
b(x) = −![]() x − 2
x − 2
0 = −![]() x − 2
x − 2
![]() x = −2
x = −2
x = −4
Thus, the x-intercept of b(x) = −1/2x − 2 is at (−4, 0). Furthermore, since the equation is already in y = mx + b form, you know that the slope is −1/2. Now graph the equation in the coordinate plane.
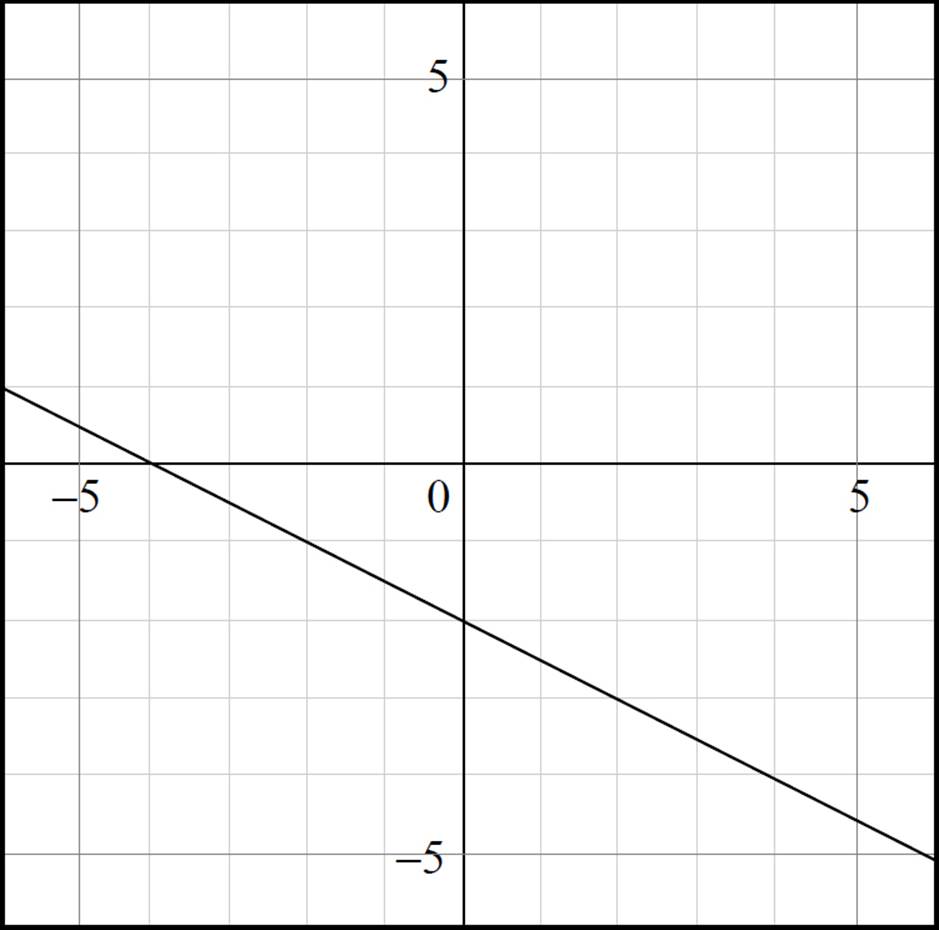
Once you’ve graphed the function b(x) = −1/2x − 2, you should be able to answer the remaining questions more easily. Here, the function provided is a linear function and, because the slope of the line is negative, the function is decreasing.
4. 1.58
To solve this problem, you need to know the behavior of quadratics and use that information to interpret the function table provided. A quadratic function is graphed as a parabola that is symmetrical about the vertex. The question states that the function is a quadratic, and from the table provided, you can see that both c(2) and c(−2) equal 2.48, and the vertex of c(x) occurs at (0, 0.68). Based on this information, you can determine that both c(1) and c(−1) will equal 1.58. Thus, the value of a = 1.58.
5. Not a Function
This question asks you to determine whether the relation 4x = 2y2 − 8 is a function. One way to do this is to graph the relation. This question is unlike the other questions in the chapter because the y-term is squared. In order to graph this equation, plug in points for x and find the associated y-value. Start by setting x = 0 to find the associated y-value:
4x = 2y2 − 8
4(0) = 2y2 − 8
0 = 2y2 − 8
2y2 = 8
y2 = 4
y = ![]()
y = ± 2
But wait: In a function, each input, or x-value, is related to exactly one output, or y-value. Since the input, x = 0, has two outputs, y = −2 and y = 2, the relation is not a function.
6. 4, −2
This question requires you to use the provided graph to evaluate d(−6) and d(2). Start with d(−6). Here, you are given an input, or x-value, of −6, and you need to find the associated y-value. When x = −6 on the graph, y = 4; thus d(−6) = 4. Next, find d(2). Here, you are given an input, or x-value, of 2, and you need to find the associated y-value. When x = 2 on the graph, y = −2; thus, d(2) = −2.
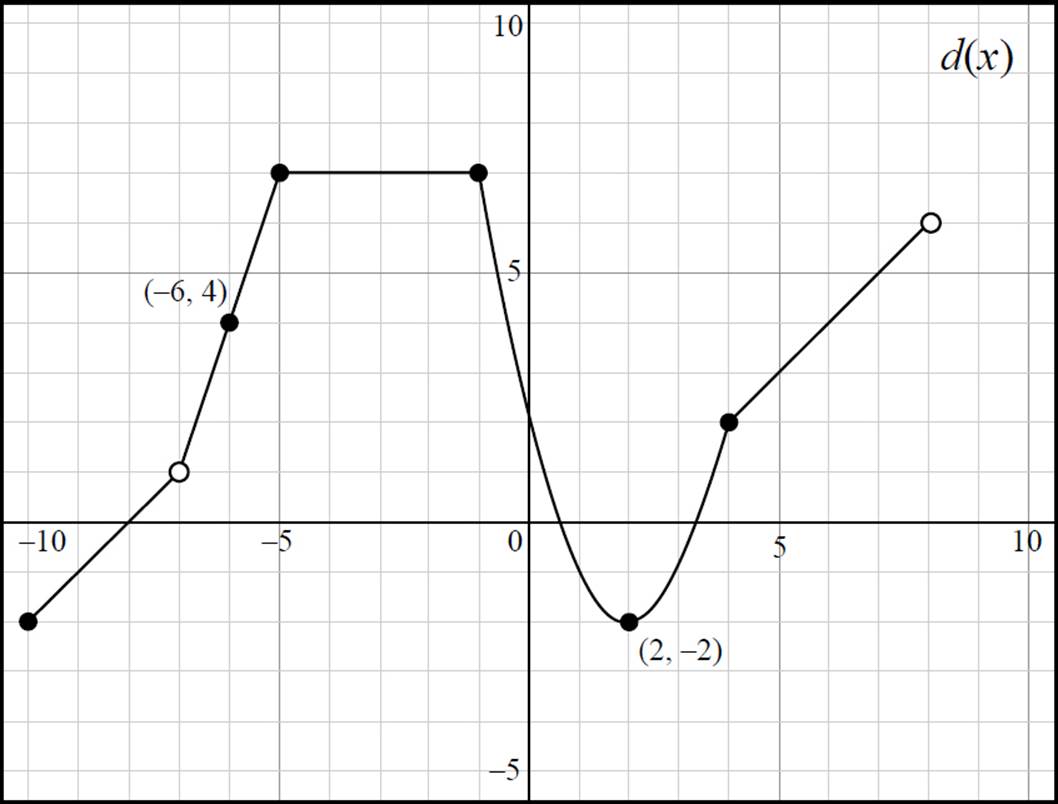
7. Discontinuous; Domain: [−10, −7) ∪ (−7, 8); Range: [−2, 7]
Here you are asked to determine whether d(x) is continuous or discontinuous, as well as provide the domain and range of the function in interval notation. Since there are gaps at (−7, 1) and (8, 6), d(x) is discontinuous. Next, find the domain. Because of the discontinuities at (−7, 1), the domain cannot be expressed as a single interval. Instead, you will need to express the domain as the union (symbolized by ∪) of multiple intervals. Here, the domain of d(x) in interval notation is [−10, −7) ∪ (−7, 8), which indicates that the domain is −10 ≤ x < 8 where x ≠ −7. Finally, you need to determine the range of d(x). Here, the function exists when −2 ≤ y ≤ 7, which is expressed in interval notation as [−2, 7]. Note that even though there is an open circle at (−7, −1) and (8, 6), y = −1 and y = 6 are still included in the range, since other points on the graph have these y-coordinates.
8. D
This question requires you to interpret the graph of d(x) and determine the function’s rate of change over various intervals. First, determine the function’s behavior over the interval (−10, −7); here, the function has a positive slope and, therefore, is increasing. Next, determine the function’s behavior over the interval (−5,−1); over this interval, the function is a horizontal line, has a zero slope, and, therefore, is constant. Finally, you need to determine the function’s behavior over the interval (−1, 2). While the function is not decreasing at a constant rate over the interval (−1, 2), the function is continually decreasing over this interval. Therefore, the function is increasing over the interval (−10, −7), constant over the interval (−5, −1), and is decreasing over the interval (−1, 2).
REFLECT
Congratulations on completing Chapter 7!
Here’s what we just covered.
Rate your confidence in your ability to:
•Describe the characteristics of a function
1 2 3 4 5
•Evaluate functions from equations, graphs, and tables
1 2 3 4 5
•Determine the domain and range of functions
1 2 3 4 5
•Express the domain and range of a function in interval notation
1 2 3 4 5
•Graph linear and non-linear functions
1 2 3 4 5
•Determine whether a relation is a function using the vertical line test
1 2 3 4 5
•Classify functions as increasing, decreasing, or constant
1 2 3 4 5
If you rated any of these topics lower than you’d like, consider reviewing the corresponding lesson before moving on, especially if you found yourself unable to correctly answer one of the related end-of-chapter questions.
CHAPTER 7 KEY POINTS
![]() A function is a relation from a set of inputs to a set of possible outputs, in which the input value affects the output value.
A function is a relation from a set of inputs to a set of possible outputs, in which the input value affects the output value.
○ Each input, or x-value, is related to exactly one output, or y-value.
○ Multiple inputs, or x-values, can result in a single output, or y-value.
![]() Functions are generally written in the form ƒ(x) = x + 1, where ƒ is the name of the function, x is the value that goes into the function, and x + 1 is the sample output.
Functions are generally written in the form ƒ(x) = x + 1, where ƒ is the name of the function, x is the value that goes into the function, and x + 1 is the sample output.
○ Functions are most commonly named ƒ, but they can have names such as g, h, or peanutbutter.
![]() In a function, the set of input elements, or x-values, is known as the domain, and the set of output elements, or y-values, is known as the range.
In a function, the set of input elements, or x-values, is known as the domain, and the set of output elements, or y-values, is known as the range.
![]() A zero of a function is an x-value that makes the function equal to zero.
A zero of a function is an x-value that makes the function equal to zero.
![]() A linear function will result in a graph of a straight line and can be classified as increasing, decreasing, or constant based on the slope of a function.
A linear function will result in a graph of a straight line and can be classified as increasing, decreasing, or constant based on the slope of a function.
![]() Use the vertical line test to determine if a relation is a function. If any vertical line touches the relation at more than one point, the relation is not a function.
Use the vertical line test to determine if a relation is a function. If any vertical line touches the relation at more than one point, the relation is not a function.
![]() When working with functions, the domain and range of a function is written in interval notation.
When working with functions, the domain and range of a function is written in interval notation.
○ The use of brackets ( [ ] ) in interval notation indicates that the value of the endpoint is included in the interval; graphically, the endpoints will be filled circles.
○ The use of parentheses ( ( ) ) in interval notation indicates that the value of the endpoint is not included in the interval; graphically, the endpoints will be unfilled circles.
![]() An interval is a set of real numbers between, and at times including, two numbers.
An interval is a set of real numbers between, and at times including, two numbers.
![]() The process for graphing functions is identical to that of graphing equations: substitute x-values into the function to find the associated y-value, plot the points you find, and connect the dots!
The process for graphing functions is identical to that of graphing equations: substitute x-values into the function to find the associated y-value, plot the points you find, and connect the dots!