High School Algebra I Unlocked (2016)
Chapter 7. Function Basics
Lesson 7.3. Graphical Representations of Functions
Functions can be graphed just like equations. When graphed, the horizontal axis of a function represents the domain, and the vertical axis of a function represents the range. In the same way that a linear equation is an equation for a straight line, a linear function will also lead to a graph of a straight line. Take a look at the following examples:
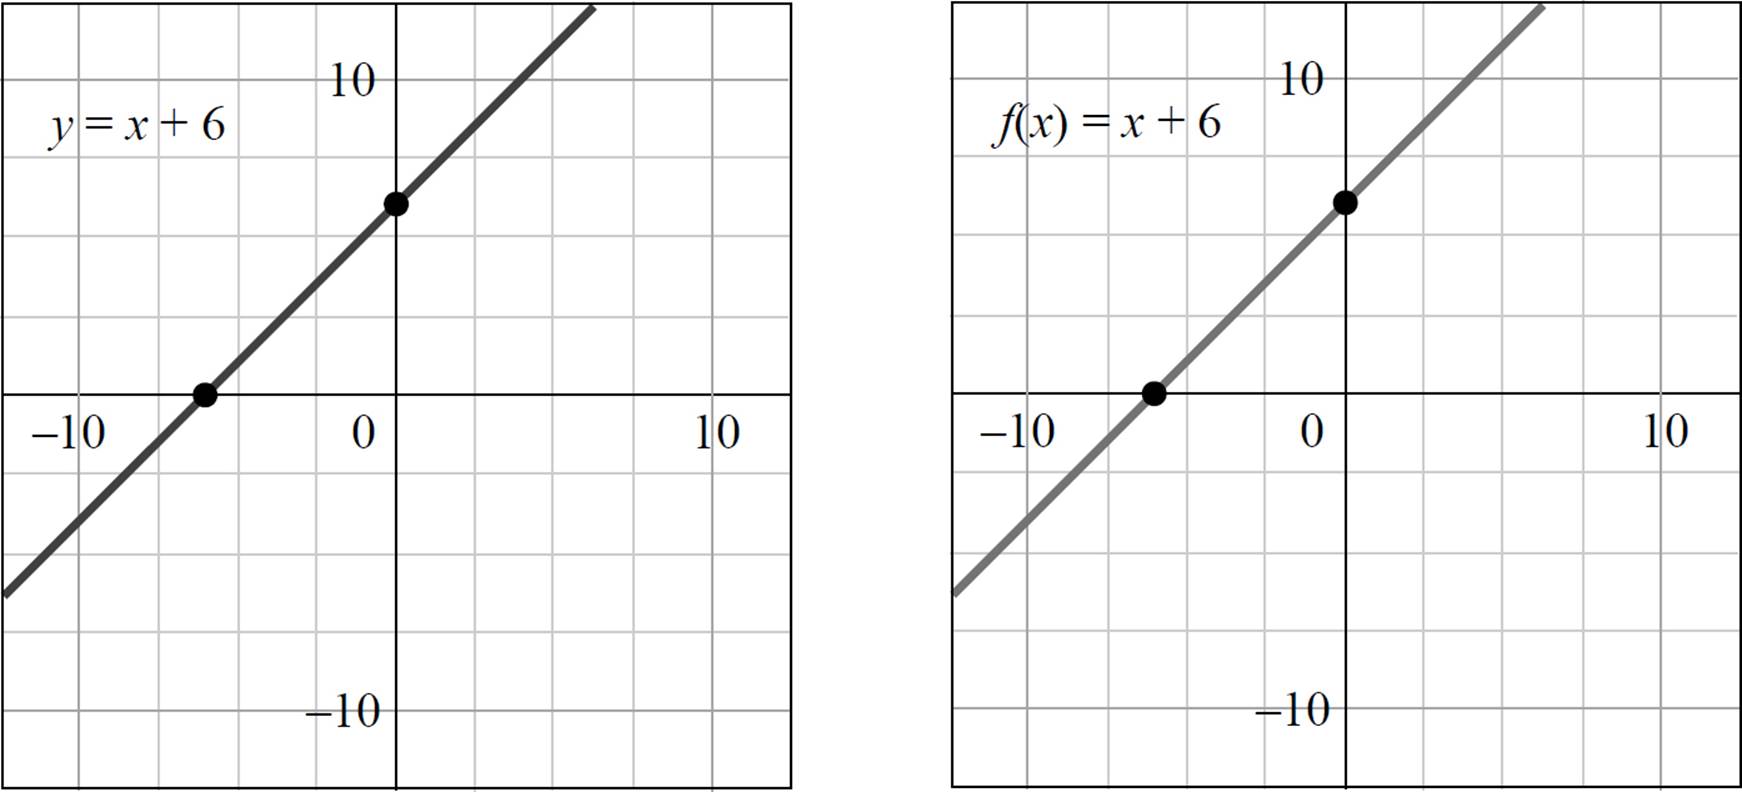
The graph on the left is a linear equation, while the graph on the right is a linear function. The difference? Not much! Both of these graphs are equivalent and represent straight lines. Furthermore, in the same way that you are able to find the x- and y-intercepts of an equation, you can find the find x- and y-intercepts of a function. In fact, the process for finding intercepts in functions is extremely similar to the process you use for equations.
For example, imagine that you need to find the y-intercept of the function ƒ(x) = x + 6. Simply set x = 0 and solve: ƒ(0) = 0 + 6 = 6. Thus, the y-intercept of ƒ(x) = x + 6 is the point (0, 6), which is shown on the previous graph.
You may also need to find the zeros of a function, which are similar to the x-intercepts or roots found in equations; a zero of a function is an x-value that makes the function equal to zero. Likewise, in order to find the zero of ƒ(x) = x + 6, simply set ƒ(x) = 0 and solve: ƒ(x) = x + 6, 0 = x + 6, and x = −6. The zeros of ƒ(x) = x + 6 is the point (−6, 0), which is also shown on the previous graph.
Here is how you may see graphical representations of functions on the ACT.
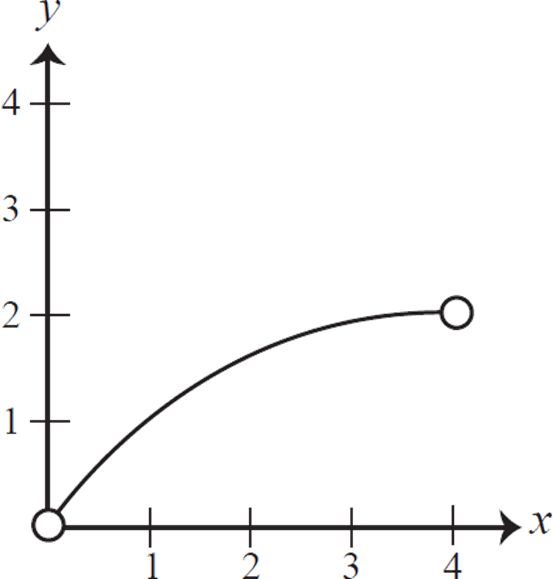
The graph below shows the function ƒ(x) in the coordinate plane. Which of the following choices best describes the domain of this function? (Note: The domain is defined as the set of all values of x for which a function is defined.)
A. {0, 1, 2, 3, 4}
B. {0, 1, 2}
C. {x: 0 < x < 2}
D. {x: 0 < x < 4}
E. All real values of x
Linear functions can be classified as increasing, decreasing, or constant based on the behaviors of the x- and y-values, or the slope of a function; this is often referred to as the function’s rate of change.
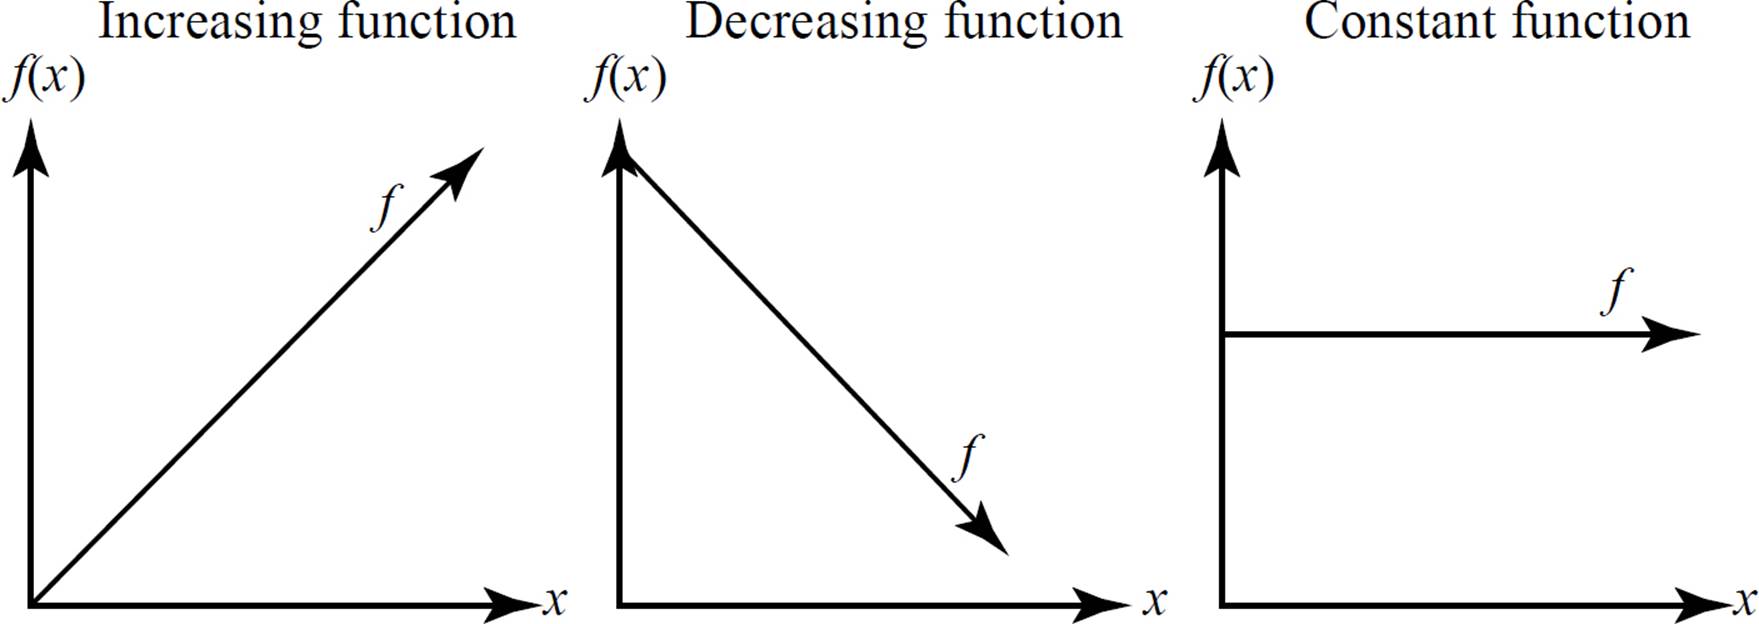
These graphs show an increasing, decreasing, and constant function, respectively. Increasing functions have a positive slope, decreasing functions have a negative slope, and constant functions have a slope of zero.
You should know how to determine graphs of functions and be able to identify whether a function is increasing, decreasing, or constant over a certain interval. Take a look at the following examples.
EXAMPLE 
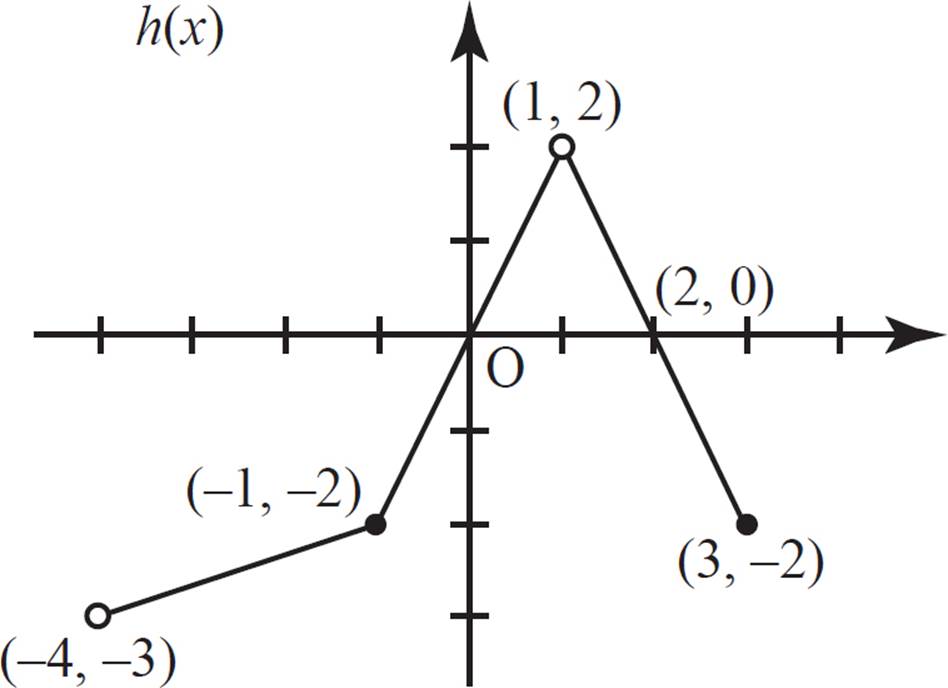
From (−4, −1] the function h(x) is _____, and from (1, 3] the function h(x) is ____.
A) decreasing; decreasing
B) decreasing; increasing
C) increasing; decreasing
D) increasing; increasing
This question requires you to determine whether the function h(x) is constant, increasing, or decreasing over the intervals (−4, −1] and (1, 3]. Recall that functions that are increasing will have a positive slope, those that are decreasing will have a negative slope, and those that are constant will have zero slope. Thus, over the interval (−4, −1] the function h(x) is increasing, and over the interval (1, 3] the function h(x) is decreasing. The correct answer is (C).

EXAMPLE 
Which of the following graphs represents a linear function?
A) 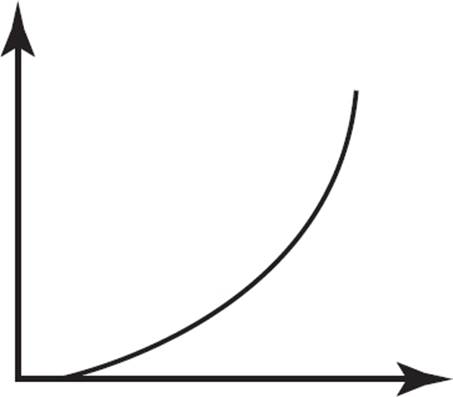
B) 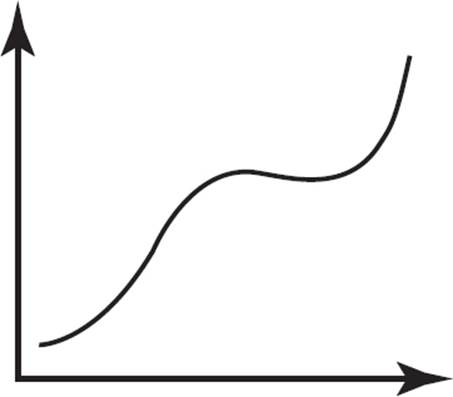
C) 
D) 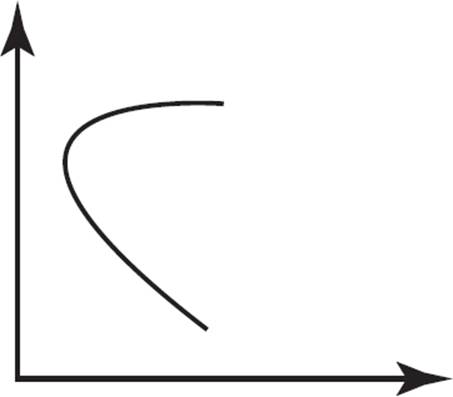
This question requires you to identify the graphs that represent linear functions. Since linear functions are represented as straight lines and not curves, (A), (B), and (D) can be eliminated. The graph for (C) is a straight line and, therefore, a linear function.

To solve, you need to find all possible x-values for the given function. The open circles at x = 0 and x = 4 mean that x ≠ 0 and x ≠ 4; therefore, eliminate (A), (B), and (E). The solid line between x = 0 and x = 4 means that x can be any value between 0 and 4, so eliminate (C). Therefore, the domain of ƒ(x) is {x: 0 < x < 4}, which indicates that the domain is the set of all real numbers x, such that x is greater than 0 and less than 4. Therefore, the answer is (D).
EXAMPLE 
Which of the following graphs represents a function that is continually decreasing?
A) 
B) 
C) 
D) 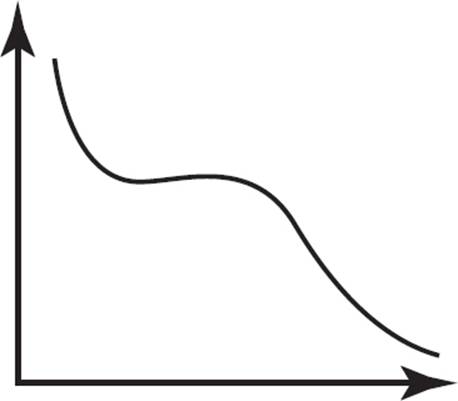
This question requires you to identify a continually decreasing function. Choice (A) depicts a function that is exponentially increasing; eliminate (A). Choice (B) represents a constant function, as the y-value neither increases nor decreases across the values of x; eliminate (B). Choice (C) represents a function that continually decreases across all values of x. Choice (D) shows a function that decreases, but doesn’t decrease continually; after an initial decrease, the function remains constant for an interval, so eliminate (D). Therefore, the only graph that represents a continually decreasing function is (C).

EXAMPLE 
Which of the following graphs represents a constant function?
A) 
B) 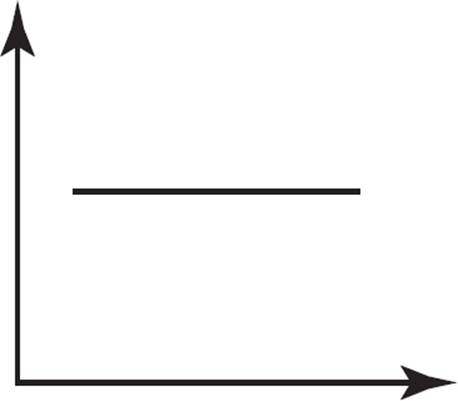
C) 
D) 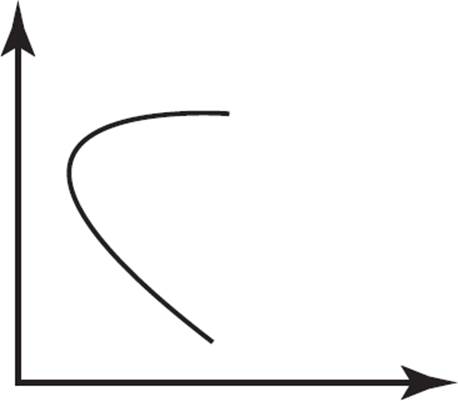
Some of the same graphs as in the previous example? Yup! However, unlike before, this question requires you to identify a constant function. Choice (A) represents a function that initially increases before it starts to decrease; eliminate (A). Choice (B) represents a constant function, as the y-value neither increases nor decreases across the values of x; keep (B). Choice (C) represents a function that continually decreases across all values of x; eliminate (C). Choice (D) is not a function, as there are x-values with multiple y-values; eliminate (D). Therefore, the only graph that represents a constant function is (B).

Not all relations are functions and not all functions are linear. Consider the two relations below.
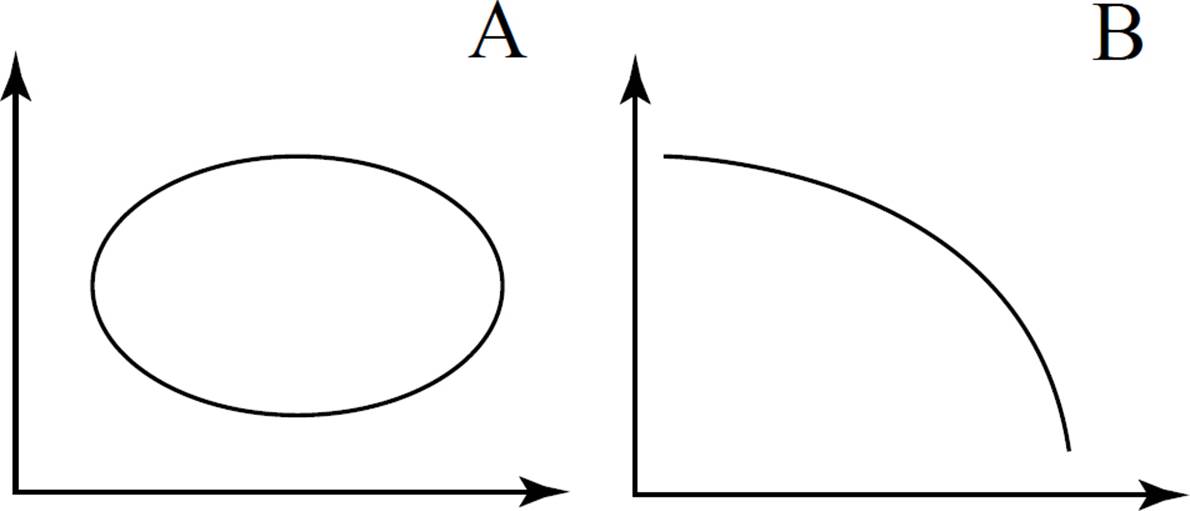
To determine whether the relations are functions, use the vertical line test. Recall that, in order for a relation to be a function, there must be only one y-value that corresponds to a given x-value. Thus, any vertical line drawn on the graph of a function will hit the curve at only one point. If any vertical line touches the curve at more than one point, the relation is not a function. Take a look at how the vertical line test works on our two graphs:
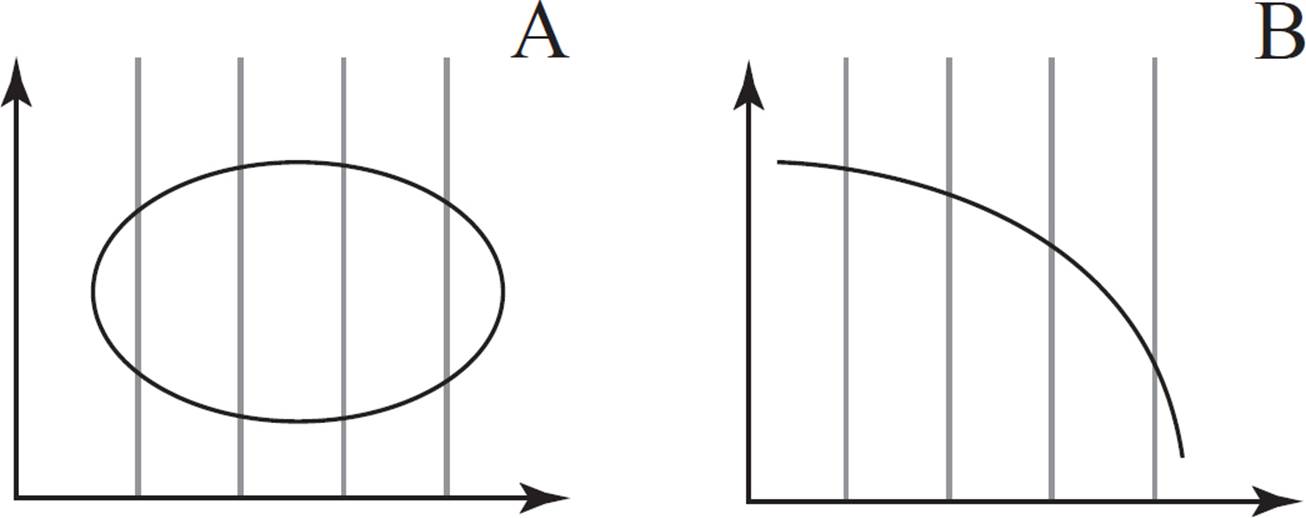
In graph A, multiple vertical lines can be drawn that will touch the curve at more than one point. Therefore, graph A is not a function. However, in graph B, any vertical line drawn will touch the curve at only one point. Therefore, this relation is a function.
Now you try. Use the vertical line test to answer the following question.
EXAMPLE 
Which of the following graphs does NOT represent a function?
A) 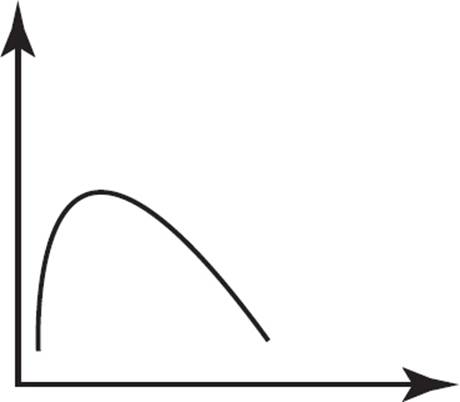
B) 
C) 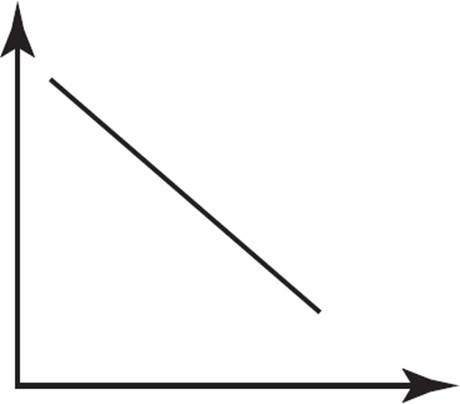
D) 
Does this question look familiar? It should! However, unlike the previous question, this one requires you to use the vertical line test to determine whether or not the graph represents a function. In (A), no vertical line can be drawn that will touch the curve more than once, so this graph represents a function. In (B), no vertical line can be drawn that will touch the graphed line more than once, so this graph also represents a function. Similarly, in (C), no vertical line can be drawn that will touch the graphed line more than once, so this graph represents a function. However, in (D), several vertical lines can be drawn that will touch the curve more than once, so this graph does not represent a function. Therefore, the only graph that does not represent a function is (D), which is the answer.

When discussing the behavior of functions, you will need to know how to graph them. Thankfully, the process for graphing functions is similar to that of graphing equations.