High School Algebra II Unlocked (2016)
Chapter 6. More Functions
Lesson 6.2. Piecewise-Defined Functions
REVIEW
The absolute value of a number is its distance from 0 on a number line, so the absolute value of any number 0 or greater is the number itself, and the absolute value of any negative number is its opposite, the positive version of that number. The notation |a| indicates the absolute value of a number a.
An integer is any counting number {1, 2, 3,..}, any negative of these counting numbers {−1, −2, −3,…}, or 0.
A line of symmetry is a line that divides an image into two congruent parts that are exact mirror images of one another across this line.
To graph a linear function, use its slope m and y-intercept b from its equation in slope-intercept form, y = mx + b.
So far in this book, we have only looked at functions that can be defined by a single polynomial, rational, radical, exponential, logarithmic, or trigonometric function. Some of these functions, such as most rational functions, have discontinuities, with different sections behaving differently, but all have been defined by single functions.
A piecewise-defined function is defined by different equations for its various pieces. Pay attention to whether or not endpoints are included in a given section.

Graph the function defined below. Describe its domain and range.
f(x) = 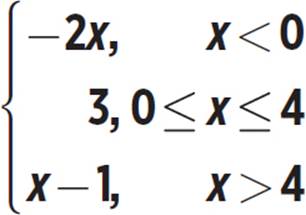
The function is f(x) = −2x for x-values less than 0. The x-value 0 is not included in this section, so we must use an open circle at the point (0, 0) to indicate that this endpoint is not included in the function.
The notation “−2x,
x < 0” means “−2x for
x < 0.” The bracket
indicates that −2x,
3, and x − 1 are all
definitions of the
function f(x), each for
a certain portion of the
domain, as indicated.
In other words, f(x)
is defined to be
equal to −2x for
x < 0, to be equal to 3
for 0 ≤ x ≤ 4, and to be
equal to x − 1 for x > 4.
The x-value of 0 is
not included because
the inequality symbol
is <, not ≤. If 0 were
included in the set,
then f(0) would equal
−2(0), which is 0. So,
the open circle must
go at the point (0,
0) to indicate that
this is the endpoint
but is not included.
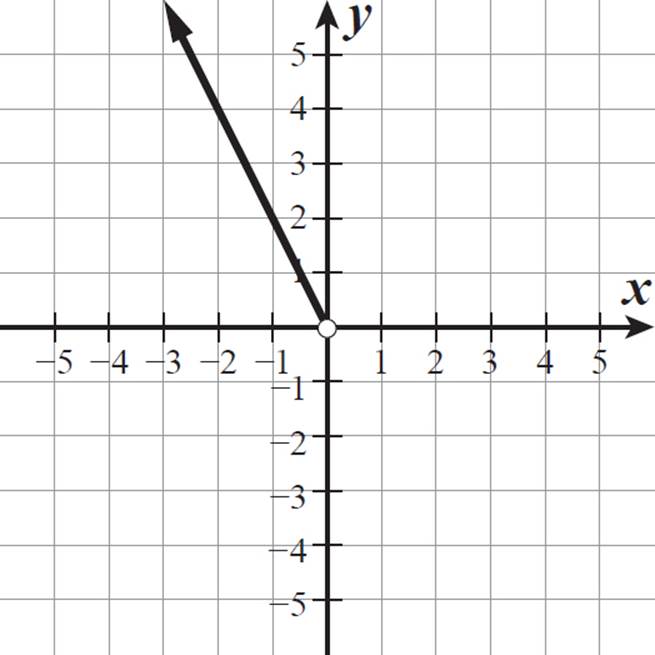
For x-values between 0 and 4, f(x) = 3. This is a horizontal line segment. Both endpoints are included in this section, so use closed circles for the points (0, 3) and (4, 3).
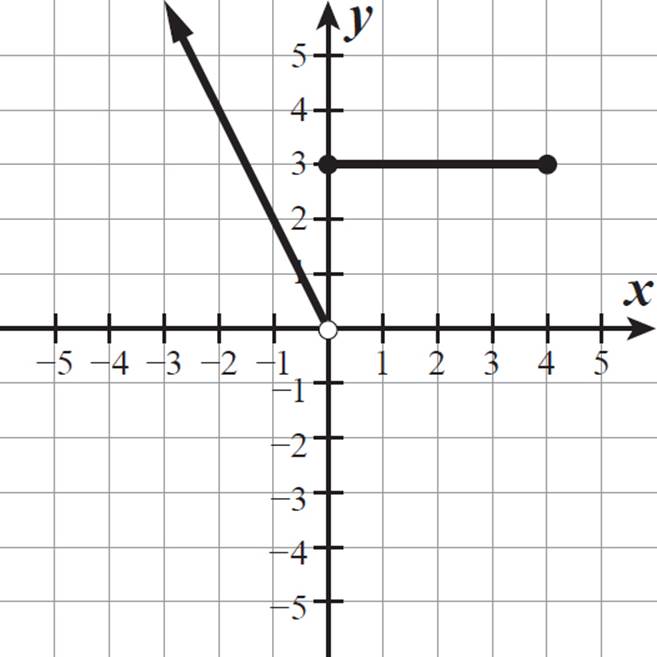
For x-values greater than 4, the function is defined as f(x) = x − 1. The x-value of 4 is not included, so the point (4, 3) is not included in this section. However, the point (4, 3) is included in the previous section, so that closed circle point remains in our graph. Here is the complete graph of f(x).
Although this graph has a discontinuity (at x = 0), the function is defined for all real numbers. The domain of the function is all real numbers. All function values are above the x-axis, and both ends are continuing forever upward, with the left ray encompassing all positive numbers. So, the range of the function is all real numbers greater than 0.

Piecewise-defined functions may be defined using any kinds of functions, not just linear.

Graph the function defined below. Describe its domain and range.
h(x) = 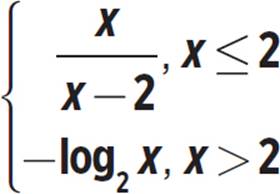
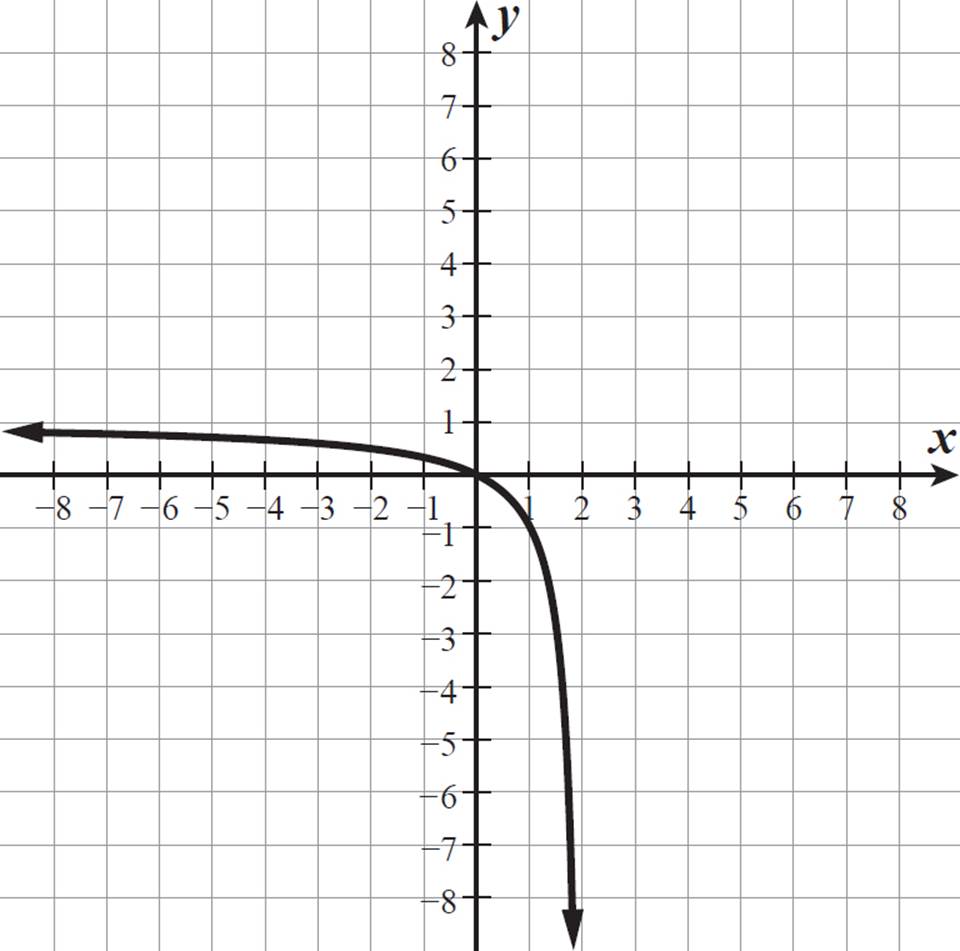
The function y =  has two unconnected sections, on either side of the vertical asymptote x = 2. We are only graphing the left-side section, because h(x) =
  only for x-values less than or equal to 2. This curve is always decreasing, with its left end approaching a horizontal asymptote of y = 1 and its right end dropping along the vertical asymptote x = 2. It passes through (0, 0) and (1, −1).

See Lesson 3.3 for a
review of graphing
rational functions.
In this case, we are
only graphing one
of the two curves
that represent this
rational function,
because of the domain
restrictions given in the
function definition.
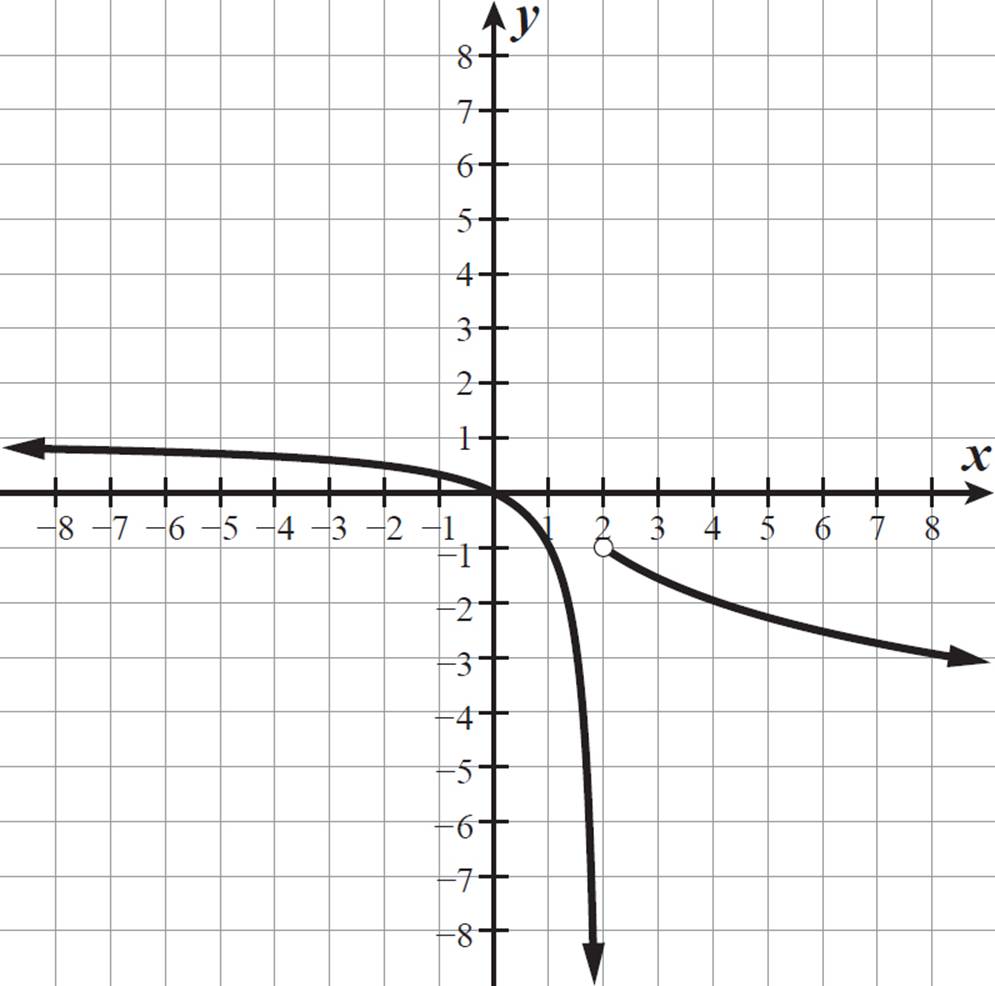
The graph of y = −log2x is a decreasing function, with its left end approaching a vertical asymptote of x = 0 and its right end heading toward −∞. However, we only want to graph the portion of it to the right of x = 2. This x-value is not included, so we must put an open circle at (2, −1). The graph passes through (4, −2) and (8, −3).
Use the equation
y = −log2x to find
points along its graph.
When x = 2, y = −log22
= −(1) = −1. When x = 4, y = −log24 = −(2)
= −2. When x = 8,
y = −log28 = −(3) = −3.
Even though the function definition encompasses x ≤ 2 and x > 2, or all x-values, the function is undefined at x = 2. When x = 2, h(x) =  , and the expression is undefined when x = 2. So, the domain of the function h(x) is all real numbers except 2. The function has two arms extending toward −∞, and the other arm is heading toward, but never reaches, a function value of 1. So, the range of h(x) is all real numbers less than 1, or h(x) < 1.
In Example 19 in
Lesson 5.4, we
graphed y = log2x. The
graph of y = −log2x is a
reflection of that graph
across the x-axis, as
seen in the portion of
y = −log2x shown here.

STEP FUNCTIONS
A step function is a piecewise-defined function that consists only of horizontal line segments and/or rays.
A step function is discontinuous because the line segments, at various y-values, are not connected to one another.
Technically, a constant
function (such as
the line y = 5) is
a continuous step
function, consisting
of just one line across
a domain of all real
numbers. But, here
we will focus only
on discontinuous
step functions.

Graph the function f(x), defined below. Identify its x- and y-intercepts, where they exist. What are the domain and range of f(x)?
f(x) = 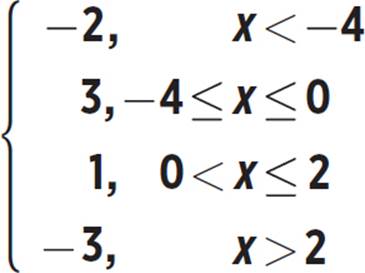
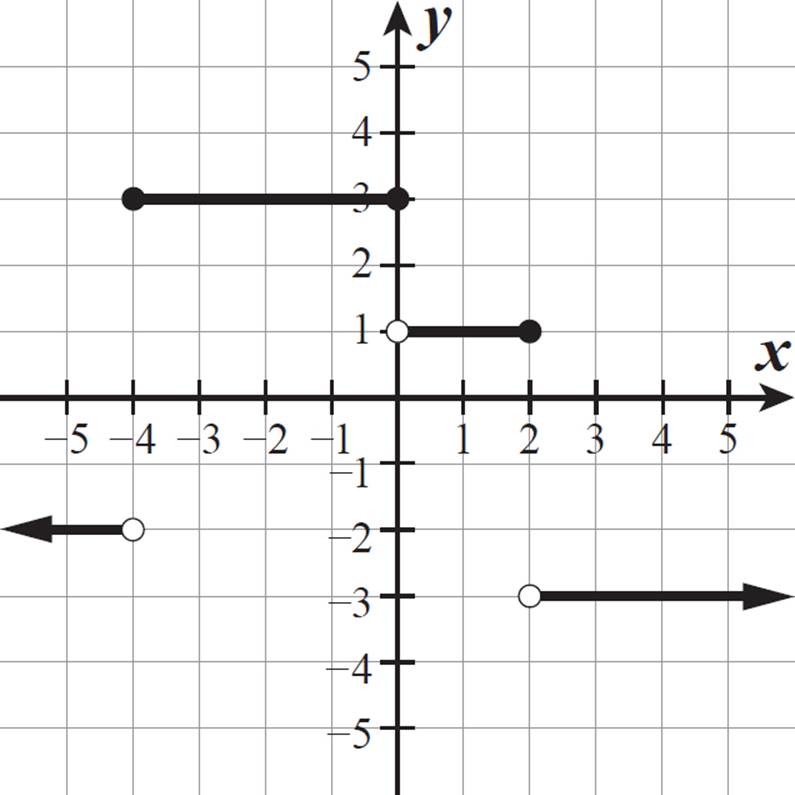
For x-values less than −4, f(x) = −2, so draw a horizontal ray at y = −2 from (−4, −2) to the left. The endpoint is not included (x < −4), so use an open circle at the point (−4, −2).
For x-values between −4 and 0, inclusive, f(x) = 3, so draw a horizontal line segment at y = 3 from (−4, 3) to (0, 3). Both endpoints are included (x ≥ −4 and x ≤ 0), so use closed circles at the points (−4, 3) and (0, 3).
For x-values between 0 and 2, f(x) = 1, so draw a horizontal line segment at y = 1 from (0, 1) to (2, 1). The left endpoint is not included (x > 0), but the right endpoint is (x ≤ 2). Use an open circle at (0, 1) and a closed circle at (2, 1).
For x-values greater than 2, f(x) = −3, so draw a horizontal ray at y = −3 from (2, −3) to the right. The endpoint is not included (x > 2), so use an open circle at (2, −3).
Here is a graph of step function f(x).
The line segments and
rays look kind of like
steps on a staircase.
No wonder this kind
of function is called
a step function!
This function never intersects the x-axis, so it has no x-intercept. It intersects the y-axis at 3, so its y-intercept is 3. Notice that it does not actually intersect the y-axis at 1, because there is an open circle at that point.
This step function is continuous along each of its four sections. At the points of discontinuity, the function value is still defined: f(−4) = 3, f(0) = 3, and f(2) = 1. Because the function is defined for all real-number values of x, the domain of f(x) is all real numbers.
The function values, however, only include −2, 3, 1, and −3. The range of f(x) is the set {−3, −2, 1, 3}.
The standard way
to express a set of
values, such as those
included in a function
range, is in ascending
order: {−3, −2, 1, 3}.

FLOOR AND CEILING FUNCTIONS
In keeping with the architectural theme, let’s take a look at floor and ceiling functions.
The floor function, which is written as f(x) = ⌊x⌋, is defined as the greatest integer less than or equal to x. It is also known as the greatest integer function.

Graph the floor function. Identify its x- and y-intercepts, where they exist.
Let’s consider various values of x, including those between consecutive integers. When x = 0, the greatest integer less than or equal to 0 is 0. When x = 1/2, the greatest integer less than or equal to 1/2 is 0. This is true for any fraction greater than 0 and less than 1. When x = 1, the greatest integer less than or equal to 1 is 1. Because the definition of the function includes integer values “equal to x,” each integer x-value is mapped to itself.
When x = 1 1/2, the greatest integer less than or equal to 1 1/2 is 1. This is true for all x greater than 1 and less than 2.
So, the function graph is a series of steps that are each 1 unit long. Each step begins at (x, x) (the point where f(x) = x), where x is an integer, and extends horizontally to, but does not include, the point (x, x + 1). This means that the left endpoint of each line segment is a closed circle and the right endpoint of each line segment is an open circle. The graph of f(x) = ëxû is shown below.
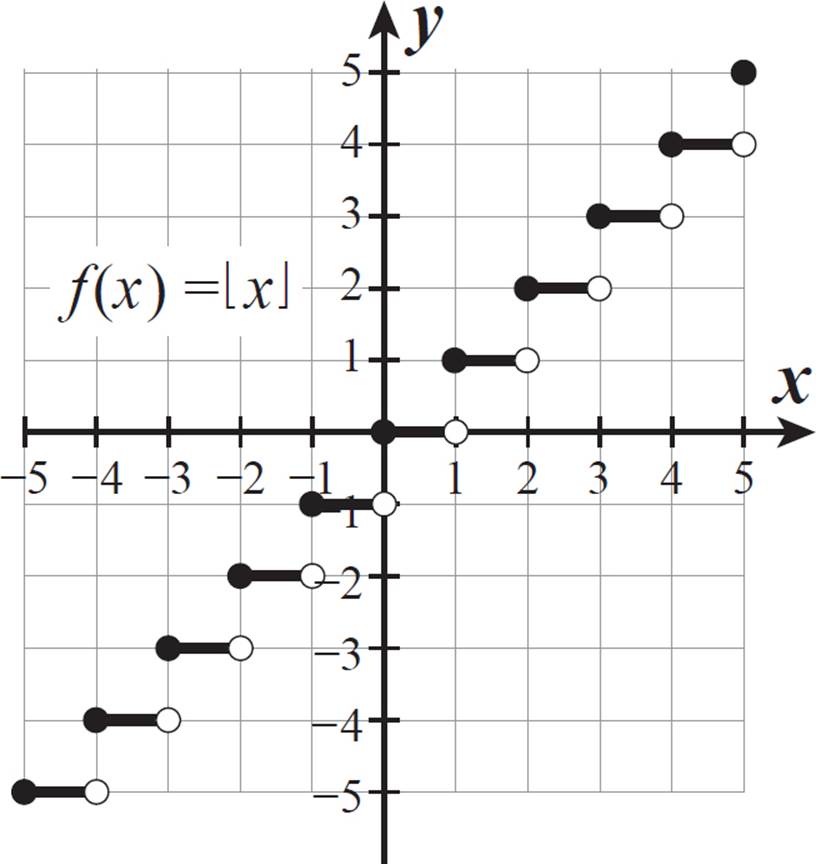
The y-intercept of the floor function is 0, at the origin. The x-intercepts are all the points along the “step” that extends from x = 0 to x = 1, not including x = 1. So, the x-intercepts are all x-values in the set 0 ⌊ x ⌋ 1.
The same pattern
extends into the
negative x-values, as
shown in the graph.
For example, ⌊ − 1.5⌉ = −2, because
the greatest integer
less than or equal to
−1.5 is −2. The value
−1 is greater than −1.5.

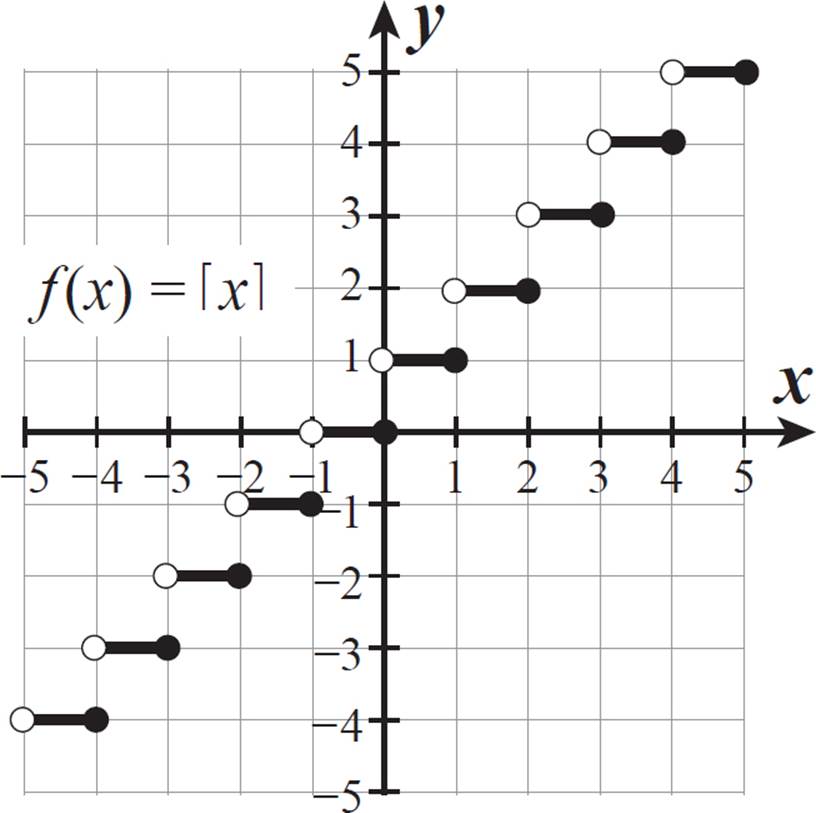
The ceiling function, which is written as f(x) = éxù, is defined as the least integer that is greater than or equal to x.

The ceiling function f(x) = ⌈x⌉ is graphed below. What are the domain and range of this function?
Both floor and ceiling
functions consist of
an infinite number
of “steps,” because
there are an infinite
number of integers.
Even though there is a discontinuity at each integer, the function is defined for every value of x. That means that the domain is all real numbers.
The function values include only integers and no other numbers between them. The range is the set of all integers.


Graph the function p(x) = ⌈x⌉ + 2.
As with other function types, adding a constant to the function value shifts the function vertically that number of units. In this case, a positive 2 is added to ⌈x⌉, so p(x) is the ceiling function shifted 2 units directly upward.
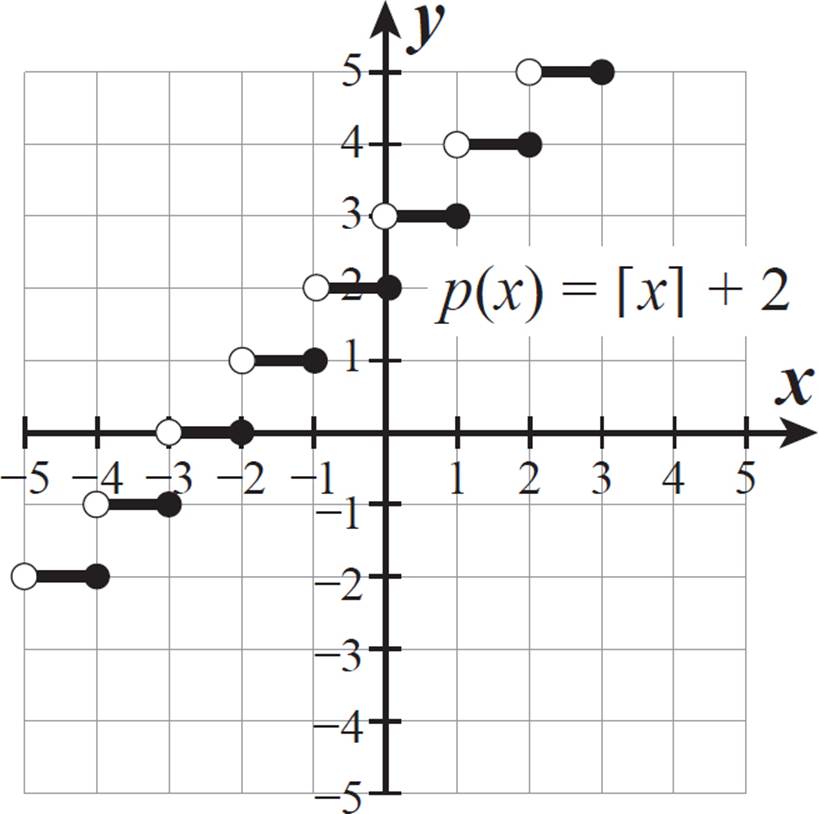
To check our work, let’s evaluate p(x) for a few values of x.
When x = −1/2, the least integer that is greater than or equal to −1/2 is 0, so p(−1/2) = 0 + 2 = 2.
When x = 1, the least integer that is greater than or equal to 1 is 1, so p(1) = 1 + 2 = 3.
When x = 2 1/4, the least integer that is greater than or equal to 2 1/4 is 3, so p(2 1/4) = 3 + 2 = 5.
The points (−1/2, 2), (1, 3), and (2 1/4, 5) are all on our graph, so we have correctly graphed p(x).

ABSOLUTE VALUE FUNCTIONS
An absolute value function is a type of piecewise-defined function, because it is defined differently for negative arguments than for positive arguments.
An absolute value function is a function in which the independent variable (x) is within an absolute value expression.
The most basic absolute value function is f(x) = |x|. For all positive numbers and 0, the function value is the x-value itself. In other words, for x ≥ 0, f(x) = x. For all negative numbers, the absolute value produces a positive function value, which is the same result we would get by multiplying each negative x-value by −1. In other words, for x < 0, f(x) = −x.
The graph of f(x) = |x| is the graph of f(x) = −x for x < 0 and the graph of f(x) = x for x ≥ 0, so it has a V shape, as shown below.
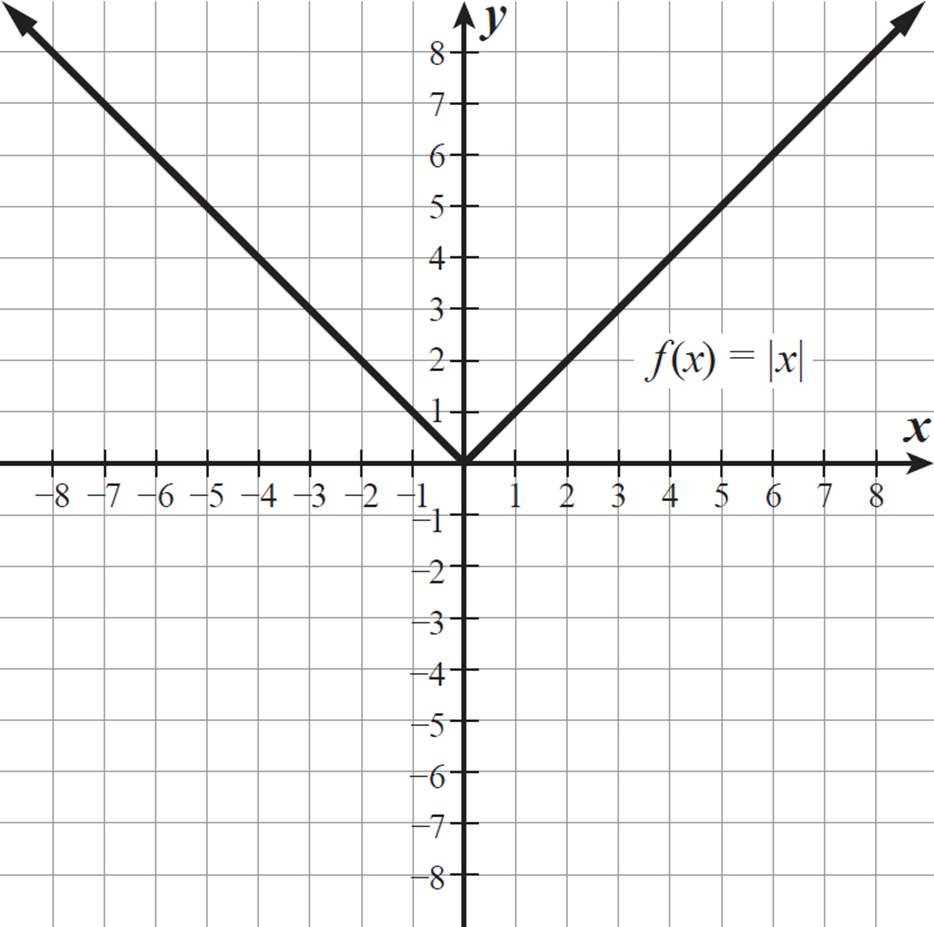
The two arms of the function extend forever along these diagonal lines, each approaching ∞ as x approaches ∞ and −∞. The minimum value of f(x) = |x| is 0. So, the domain is all real numbers, and the range is all real numbers greater than or equal to 0.
As with other kinds of functions, for absolute value functions, f(x) + k represents a vertical shift of f(x) by k units and f(x + k) represents a horizontal shift of f(x) by k units.
These vertical and
horizontal translations
are similar to what
we saw in Lesson
1.4, as well as in
Example 17 in Lesson
3.6 and elsewhere
throughout this book.

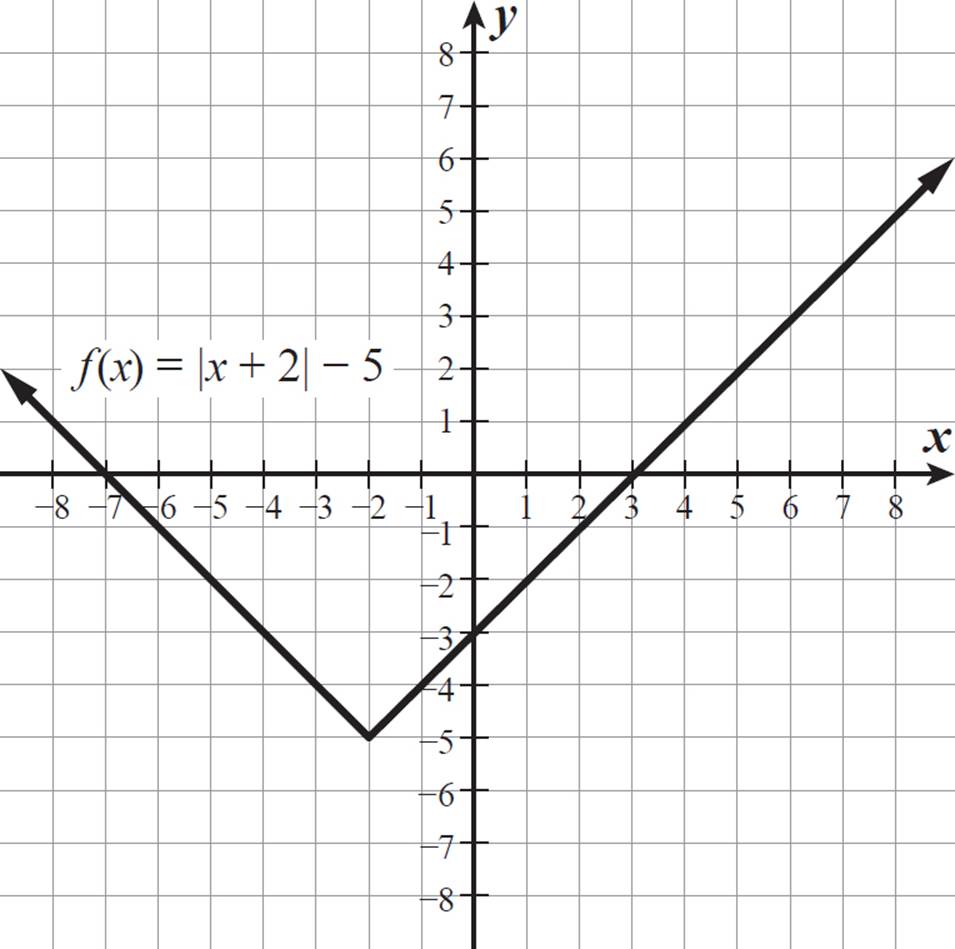
Graph the function g(x) = |x + 2| − 5. Then, describe its x- and y-intercepts, domain, range, and line of symmetry.
If f(x) = |x|, the function g(x) is f(x + 2) − 5, so its graph is the graph of f(x) = |x| shifted 2 units to the left and 5 units down.
To confirm that this is correctly graphed, let’s test values in the given equation and compare the results to points on the graph.
When x = 0, g(x) = |0 + 2| − 5 = |2| − 5 = 2 − 5 = −3.
When x = 3, g(x) = |3 + 2| − 5 = |5| − 5 = 5 − 5 = 0.
When x = −6, g(x) = |−6 + 2| − 5 = |−4| − 5 = 4 − 5 = −1.
The equation produces the coordinate pairs (0, −3), (3, 0), and (−6, −1), all of which are points lying on the graph of g(x), so the graph appears to be correct.
Look at where the graph crosses the x- and y-axes. The function g(x) = |x + 2| − 5 has x-intercepts of −7 and 3 and a y-intercept of −3.
The function g(x) is defined for all real numbers, so its domain is all real numbers (−∞ ≤ x ≤ ∞). The minimum value of g(x) is −5, so its range is g(x) ≥ −5.
Notice that some
function values are
negative. Even though
an absolute value
is never negative,
an absolute value
function may have
negative values.
The line of symmetry for this graph is the vertical line x = −2, as shown below. The parts of the graph to the left and to the right of this line are mirror reflections of one another.
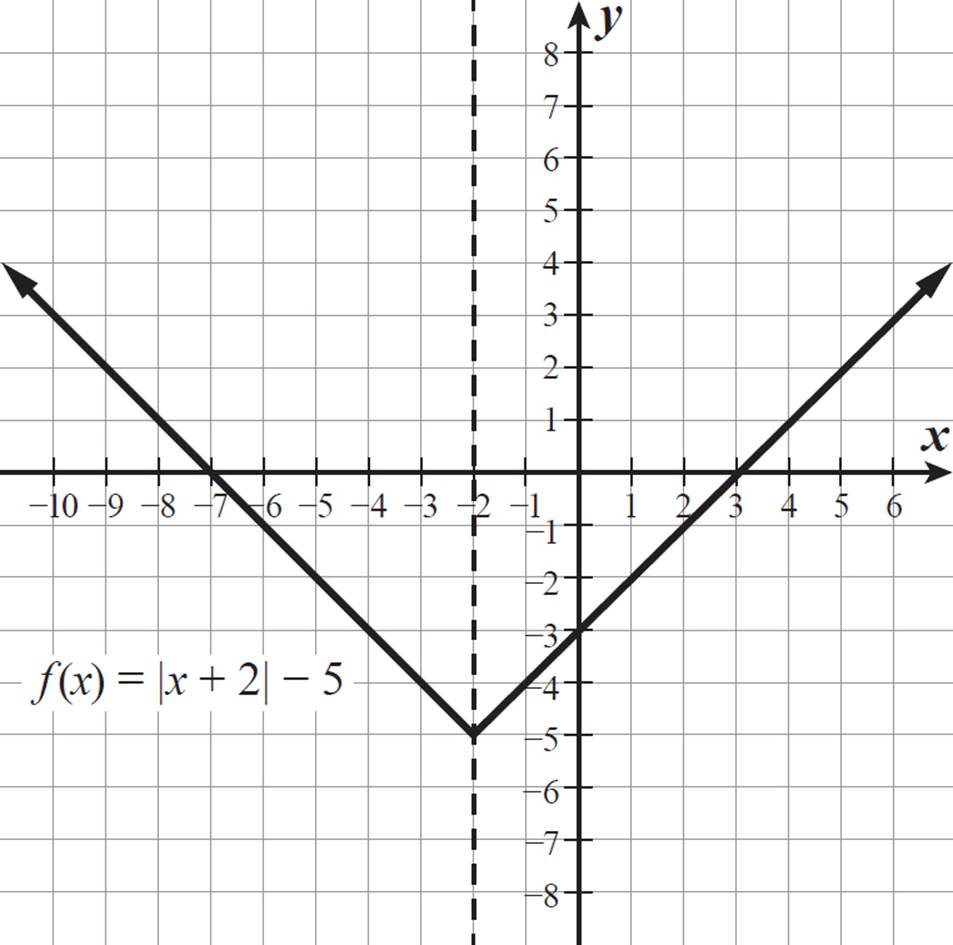
We shifted the view
of the graph over
slightly, to better see
the symmetry, but it
is the same function
graph as shown on
the previous page.

An absolute value function of the form y = a|bx + c| + d, where a, b, c, and d are constants, is always a V shape (or an upside-down V shape, in the case that a is negative). So, for this kind of absolute value function:
•The turning point of the V, called the vertex, is the maximum or minimum value of the function.
•The domain is all real numbers, and the range is all real numbers less than the maximum or greater than the minimum (depending on whether the function has a maximum or minimum).
•There are 0, 1, or 2 x-intercepts and exactly 1 y-intercept.
•The graph is symmetrical with respect to a vertical line at x = −c/b. The vertex lies on this line of symmetry, with an x-coordinate of −c/b and a y-coordinate of d. This means that the maximum or minimum value of the function is equal to d.
•Both arms of the graph are approaching ∞ or both arms of the graph are approaching −∞.
The reason that the
maximum or minimum
occurs when x = −c/b
is because this is the
value of x that makes
(bx + c) equal to 0.
The minimum value
of an absolute value
expression of the form
|bx + c| is always 0.
So, the minimum or
maximum value of
a|bx + c| + d is
0 + d, or d.
Another way to graph an absolute value function is by graphing each of its two halves: the ray to the left of its vertex and the ray to the right. Use the function equation to determine the equation of the line along which each ray lies.
For g(x) = |x + 2| − 5, write the equations for the case where (x + 2) is positive and the case where (x + 2) is negative. When (x + 2) is positive, g(x) = (x + 2) − 5, which simplifies to g(x) = x − 3. When (x + 2) is negative, we must multiply that value by −1 to produce its absolute value: g(x) = −(x + 2) − 5, which simplifies to g(x) = −x − 7.
So, for positive values of (x + 2), which are x-values greater than −2, g(x) = x − 3, and for negative values of (x + 2), which are x-values less than −2, g(x) = −x − 7. This confirms our graphing work above; the half of the V to the right of x = −2 follows the line y = x − 3, and the half of the V to the left of x = −2 follows the line y = −x − 7.
While adding a constant to some part of the equation f(x) = |x| results in a translation, as in Example 11 above, multiplying by a constant results in a vertical/horizontal stretch and/or reflection.

If you’d like to see
how absolute value
questions appear on
the SAT, check out
the online Student
Tools for this book.

Graph the function f(x) = −3|x − 4| and describe its domain and range. What is the line of symmetry for this graph?
The graph of f(x) = −3|x − 4| should be the graph of y = |x| shifted 4 units to the right, reflected across the x-axis, and stretched vertically. Let’s create a table of values to find points on the graph.
|
x |
f(x) = −3|x − 4| |
f(x) |
|
0 |
f(0) = −3|0 − 4| = −3|−4| = −3(4) = −12 |
−12 |
|
1 |
f(1) = −3|1 − 4| = −3|−3| = −3(3) = −9 |
−9 |
|
2 |
f(2) = −3|2 − 4| = −3|−2| = −3(2) = −6 |
−6 |
|
3 |
f(3) = −3|3 − 4| = −3|−1| = −3(1) = −3 |
−3 |
|
4 |
f(4) = −3|4 − 4| = −3|0| = −3(0) = 0 |
0 |
|
5 |
f(5) = −3|5 − 4| = −3|1| = −3(1) = −3 |
−3 |
|
6 |
f(6) = −3|6 − 4| = −3|2| = −3(2) = −6 |
−6 |
Here is the graph of f(x) = −3|x − 4|, passing through the points (0, −12), (1, −9), (2, −6), (3, −3), (4, 0), (5, −3), and (6, −6).
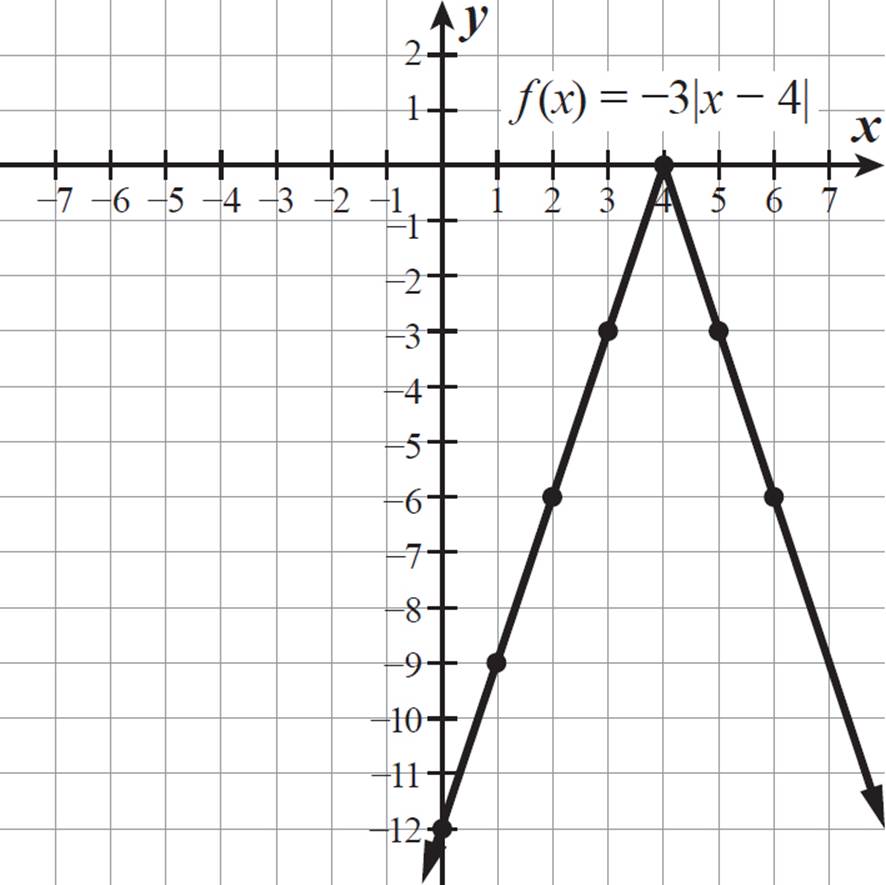
As expected, the graph is y = |x| shifted 4 units to the right, reflected across the x-axis, and stretched vertically by a factor of 3.
For f(x) = −3|x − 4|, the domain is −∞ ≤ x ≤ ∞ and the range is f(x) ≤ 0.
The graph of f(x) has a vertical line of symmetry of x = 4. Each point on the function graph is equidistant from this line of symmetry as a point horizontally aligned with it on the other side of the line.

Let’s use the function equation to find the equation for each ray of the graph, as an alternative approach to graphing this absolute value function.
First, find the x-value of the maximum, when the argument of the absolute value is 0: in this case, when x − 4 = 0. The maximum occurs when x = 4, and the maximum is f(4) = −3|4 − 4| = −3(0) = 0.
When x < 4, f(x) = −3(−1)(x − 4) = 3(x − 4) = 3x − 12.
When x > 4, f(x) = −3(x − 4) = −3x + 12.
We could also
use the formula
(−c/b, d) to find that
the maximum has the
coordinates (4, 0).
As shown in our graph above, the left ray lies on the line y = 3x − 12 and the right ray lies on the line y = −3x + 12.
Notice that the slopes of the two rays of the absolute value function graph are opposites: 3 and −3 in Example 12 and 1 and −1 in Example 11. Because the V shape of an absolute value function of the form y = a|bx + c| + d is always symmetrical with respect to a vertical line through the vertex, the two rays of the function will always have slopes that are opposites of one another.

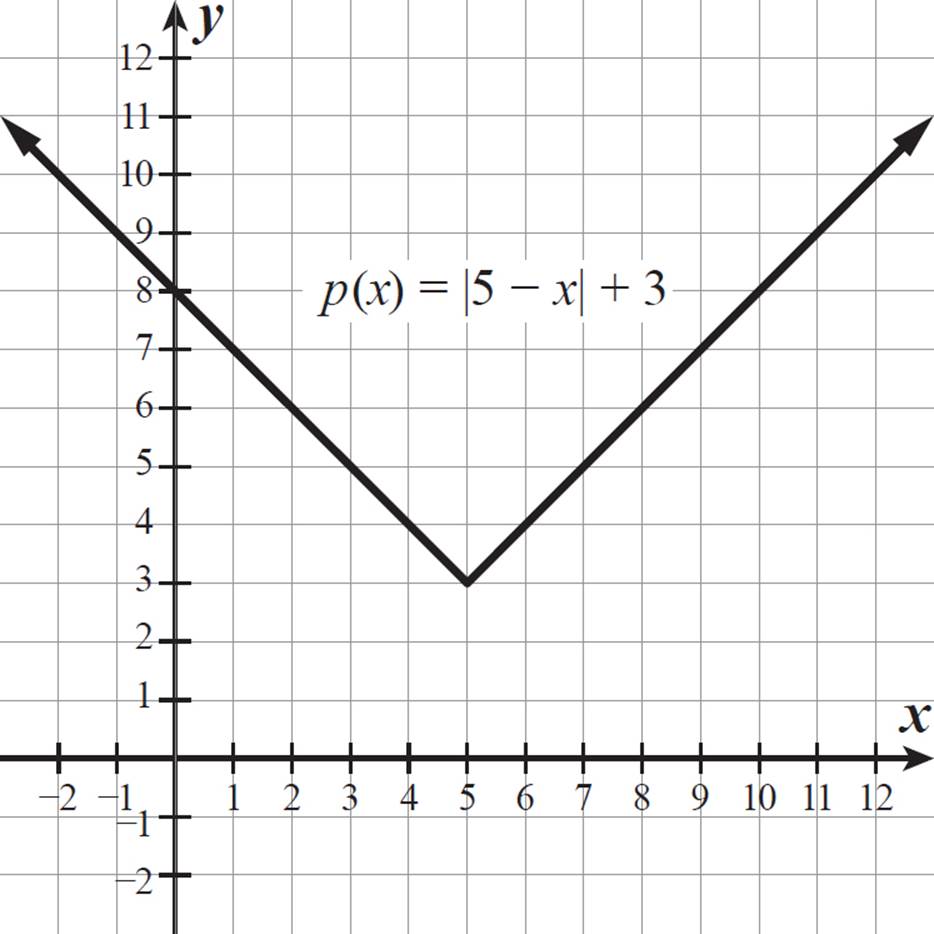
Graph the function p(x) = |5 − x| + 3.
This function can also be written as p(x) = |−(x − 5)| + 3, so its graph is y = |x| shifted 5 units to the right and 3 units up, then reflected across the line x = 5.
Algebraically, for x ≤ 5, p(x) = (5 − x) + 3 = −x + 8, and for x > 5, p(x) = −(5 − x) + 3 = x − 2. So, to the left of the vertex (5, 3), the graph follows the line y = −x + 8, and to the right of the vertex, the graph follows the line y = x − 2.
The reflection across
the line of symmetry is
unnecessary, because
it produces an identical
graph. Algebraically,
the absolute value
expressions |5 − x| and
|x − 5| are equivalent,
because they each
represent the positive
difference between x
and 5, or the distance
between x and 5 on a
number line. So,
p(x) = |5 − x| + 3 is the
same as p(x) = |x − 5|
+ 3, which is the graph
of y = |x| translated
5 units to the right
and 3 units up.

The algebraic process that we use to determine the lines of the graph of an absolute value function is the same process we use to solve an absolute value equation: Replace the absolute value with its own argument for one equation and with the opposite of that expression in the second equation. Solve both equations to determine the solutions to the equation, if any exist.
For example, to solve the equation |5 − x| + 3 = 7, we would write the equations (5 − x) + 3 = 7 and −(5 − x) + 3 = 7.
|
5 − x + 3 = 7 |
−5 + x + 3 = 7 |
|
−x + 8 = 7 |
x − 2 = 7 |
|
x = 1 |
x = 9 |
The two solutions to the equation |5 − x| + 3 = 7 are x = 1 and x = 9. We could also determine these solutions by looking at the graph in Example 13. The points where p(x) = 7 occur when x = 1 and when x = 9.

Find all solutions to the equation |x − 2| = x2 − 2x − 2.
Let’s solve algebraically for the cases where x − 2 ≥ 0 and where x − 2 < 0. In each case, we must make sure that our solutions match these constraints.
When x ≥ 2, the absolute value equation becomes x − 2 = x2 − 2x − 2.
|
x = x2 − 2x |
Add 2 to both sides. |
|
0 = x2 − 3x |
Subtract x from both sides. |
|
0 = x(x − 3) |
Factor the quadratic. |
|
x = 0, x = 3 |
Solve for each factor set equal to 0. |
However, our constraint for this part of the solution set is that x ≥ 2. The equation x − 2 = x2 − 2x − 2 is only true when x ≥ 2. So, x = 0 is an extraneous solution. For x ≥ 2, the solution to the equation is x = 3.
When x < 2, the absolute value equation becomes −(x − 2) = x2 − 2x − 2.
|
−x + 2 = x2 − 2x − 2 |
Distribute the negative sign to both terms in parentheses. |
|
0 = x2 − x − 4 |
Add x to, and subtract 2 from, both sides. |
Absolute value
equations sometimes
produce extraneous
solutions, similar to
rational equations,
as we saw in Lesson
3.1, and square root
equations, as we
saw in Lesson 3.4.
|
|
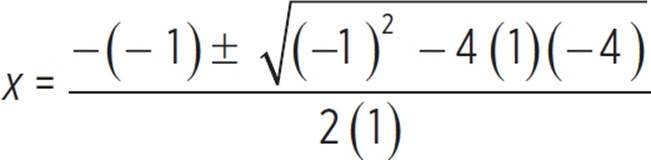
Use the quadratic formula, because we cannot easily factor. |
|
|
Simplify. |
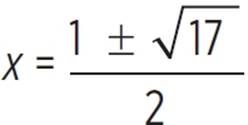
A solution for this section only applies when x < 2, so x =  is an extraneous solution. For x < 2, the solution to the equation is x =
  .
.
The two solutions to the equation |x − 2| = x2 − 2x − 2 are x = 3 and x = , which has an approximate value of −1.56.
To quickly tell whether is less than or
greater than 2, use an
approximation for ![]() .
.
The value of ![]() is a little
is a little
greater than ![]() , or 4.
, or 4.
Using 4 in place of ![]()
in gives us , which simplifies
to 5/2, or 2.5. So, the
value of  is
is
slightly greater than 2.5,
which means that it is
definitely greater than 2.

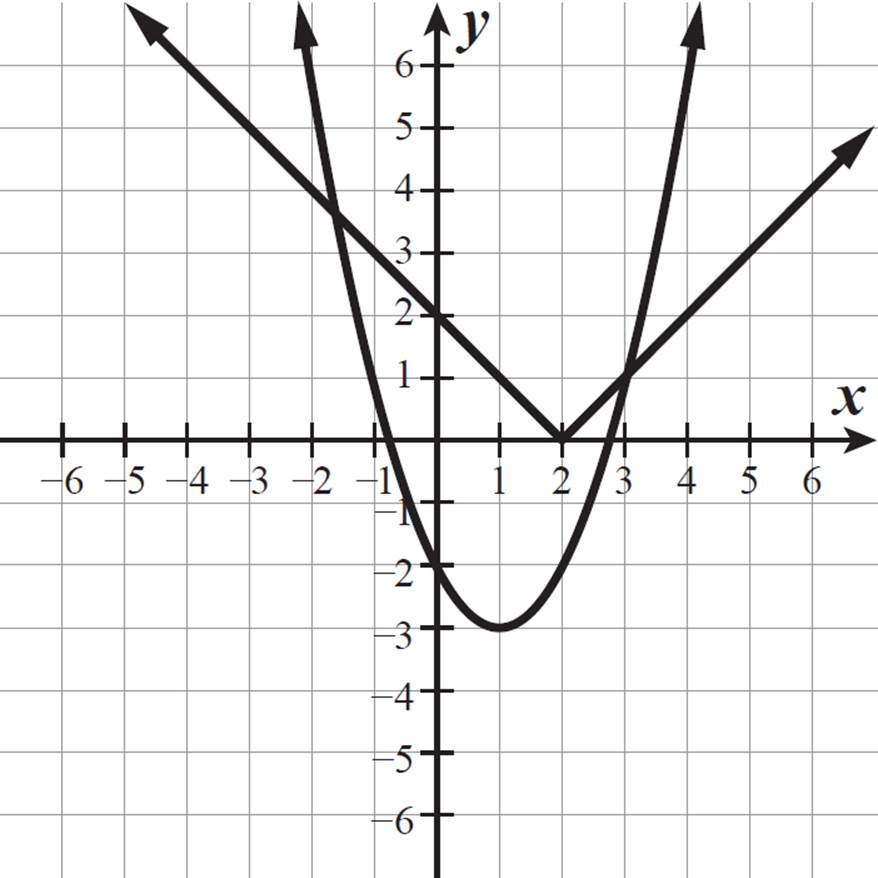
If we graph y = |x − 2| and y = x2 − 2x − 2 on the same coordinate grid, we can identify the points of intersection of the two graphs. The x-values of these points represent solutions to the original equation, because they produce the same value for |x − 2| as for x2 − 2x − 2 (the same y-value on each graph).
The equation y = x2 − 2x − 2 in vertex form is y = (x − 1)2 − 3, so this is the parabola y = x2 shifted 1 unit right and 3 units down, with its vertex at (1, −3).
In Lesson 2.2, we
looked at how
you can solve a
polynomial equation
using a system of
equations. Here we
are applying the same
concept, but one of
the equations in the
system is an absolute
value function.
The x-values of the points of intersection are 3 and about −1.56, so the solutions to the equation |x − 2| = x2 − 2x − 2 are x = 3 and x = , as we found above, algebraically.
The extraneous solutions we found are the x-values of the points where the parabola y = x2 − 2x − 2 would intersect with the extensions of each of the rays of y = |x − 2| into full lines. For example, the complete line y = x − 2 would intersect the parabola y = x2 − 2x− 2 at the points (0, −2) and (3, 1), but the absolute value function y = |x − 2| does not include the point (0, −2).