5 Steps to a 5 AP Calculus AB & BC, 2012-2013 Edition (2011)
STEP 5. Build Your Test-Taking Confidence
AP Calculus AB Practice Exam 1
ANSWER SHEET FOR MULTIPLE-CHOICE QUESTIONS
Section I—Part A

Directions:
Use the answer sheet provided in the previous page. All questions are given equal weight. There is no penalty for unanswered questions. Unless otherwise indicated, the domain of a function f is the set of all real numbers. The use of a calculator is not permitted in this part of the exam.
1. The ![]() is
is
(A) − 1
(B) 0
(C) 1
(D) 2
(E) nonexistent
2. 
(A) cos x
(B) − sin x
(C) sin x − 1
(D) sin x + 1
(E) − sin x + 1
3. The radius of a sphere is increasing at a constant of 2 cm/sec. At the instant when the volume of the sphere is increasing at 32π cm3/sec, the surface area of the sphere is
(A) 8π
![]()
(C) 16π
(D) 64π
![]()
4. Given the equation ![]() , what is the instantaneous rate of change of A with respect to s at s = 1?
, what is the instantaneous rate of change of A with respect to s at s = 1?
![]()
![]()
![]()
![]()
![]()
5. What is the ![]() , if
, if

(A) − 2
(B) ln 2
(C) e2
(D) 2
(E) nonexistent
6. The graph of f′ is shown in Figure 1T-1.
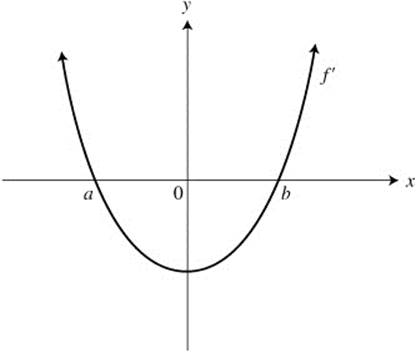
Figure 1T-1
A possible graph of f is (see Figure 1T-2):
7. If g (x) = −2|x + 3|, what is the ![]()
(A) − 6
(B) − 2
(C) 2
(D) 6
(E) nonexistent
8. What is 
![]()
(B) 0
![]()
![]()
(E) nonexistent
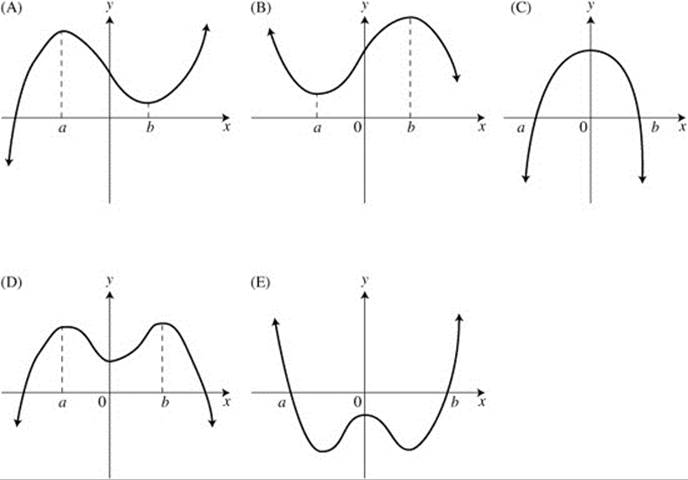
Figure 1T-2
9. If f(x) is an antiderivative of xe−x2 and f(0) = 1, then f(1) =
![]()
![]()
![]()
![]()
![]()
10. If g (x) = 3 tan2(2x), then ![]() is
is
(A) 6
![]()
(C) 12
![]()
(E) 24
11. The graph of the function f is shown in Figure 1T-3. Which of the following statements is/are true?
I. f′(0) = 0
II. f has an absolute maximum value on [a, b]
III. f″ < 0 on (0, b)
(A) III only
(B) I and II only
(C) II and III only
(D) I and III only
(E) I, II, and III
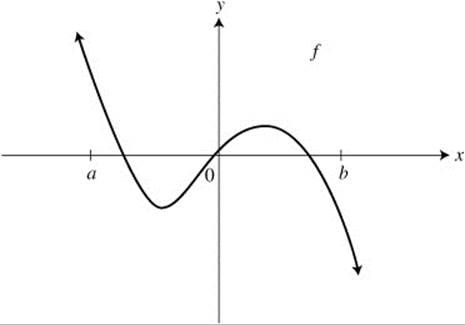
Figure 1T-3
12.
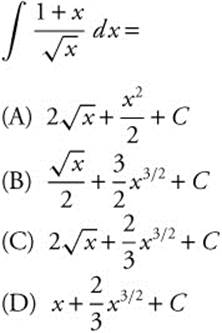
(E) 0
13. The graph of f is shown in Figure 1T-4 and f is twice differentiable. Which of the following has the smallest value?
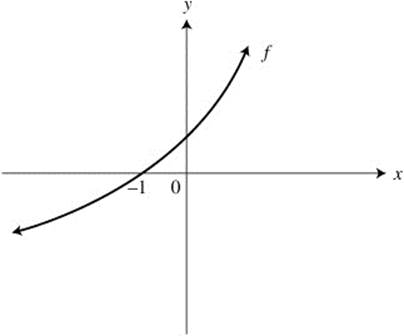
Figure 1T-4
I. f (− 1)
II. f′(− 1)
III. f″(− 1)
(A) I
(B) II
(C) III
(D) I and II
(E) II and III
14. If ![]() , and at x = 0,
, and at x = 0, ![]() , a solution to the differential equation is
, a solution to the differential equation is
![]()
![]()
![]()
![]()
![]()
15. The graph of the velocity function of a moving particle is shown in Figure 1T-5. What is the total displacement of the particle during 0 ≤ t ≤ 20?
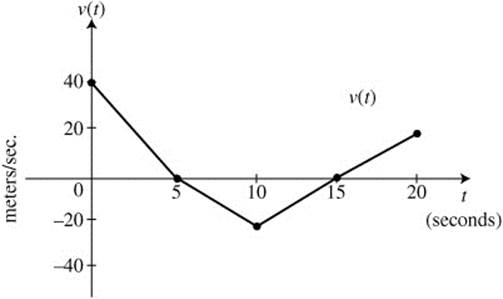
Figure 1T-5
(A) 20 m
(B) 50 m
(C) 100 m
(D) 250 m
(E) 500 m
16. The position function of a moving particle is ![]() for 0 ≤ t ≤ 4. What is the maximum velocity of the particle on the interval 0 ≤ t ≤ 4?
for 0 ≤ t ≤ 4. What is the maximum velocity of the particle on the interval 0 ≤ t ≤ 4?
![]()
(B) 1
![]()
(D) 4
(E) 5
17. If  and k > 0, the value of k is
(A) − 3
![]()
(C) 3
![]()
(E) 9
18. A function f is continuous on [− 1, 1] and some of the values of f are shown below:
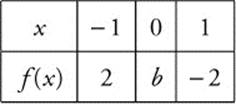
If f(x) = 0 has only one solution, r, and r < 0, then a possible value of b is
(A) 3
(B) 2
(C) 1
(D) 0
(E) − 1
19. 
![]()
(B) 3
(C) 4
![]()
(E) 2e2 − 1
20. The area of the region enclosed by the graph of ![]() and the x-axis is
and the x-axis is
(A) 36
![]()
(C) 9π
(D) 18π
(E) 36π
21. If a function f is continuous for all values of x, and a > 0 and b > 0, which of the following integrals always have the same value?
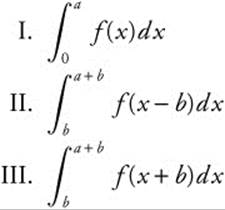
(A) I and II only
(B) I and III only
(C) II and III only
(D) I, II, and III
(E) None
22. What is the average value of the function y = 2 sin(2x) on the interval ![]() ?
?
![]()
![]()
![]()
![]()
(E) 6π
23. Given the equation ![]() , what is an equation of the tangent line to the graph at x = π?
, what is an equation of the tangent line to the graph at x = π?
(A) y = 3
(B) y = π
(C) y = π + 3
(D) y = x − π + 3
(E) y = 3(x − π) + 3
24. The position function of a moving particle on the x-axis is given as s(t) = t3 + t2 8t for 0 ≤ t ≤ 10. For what values of t is the particle moving to the right?
(A) t < − 2
(B) t > 0
![]()
![]()
![]()
25. (See Figure 1T-6.)
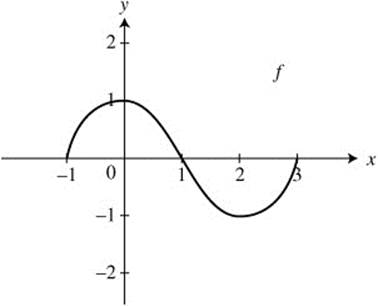
Figure 1T-6
The graph of f for 1 ≤ x ≤ 3 consists of two semicircles, as shown in Figure 1T-6.
What is the value of 
(A) 0
(B) π
(C) 2π
(D) 4π
(E) 8π
26. If  , then f′(2) is
(A) 23/2
(B) 54 − 23/2
(C) 54

(E) 135
27. If  for all positive values of k, then which of the following could be the graph of f? (See Figure 1T-7.)
28. If h′(x) = k(x) and k is a continuous function for all real values of x, then  is
is
(A) h(5) − h(− 5)
(B) 5h(5) + 5h(− 5)
(C) 5h(5) − 5h(− 5)
![]()
![]()
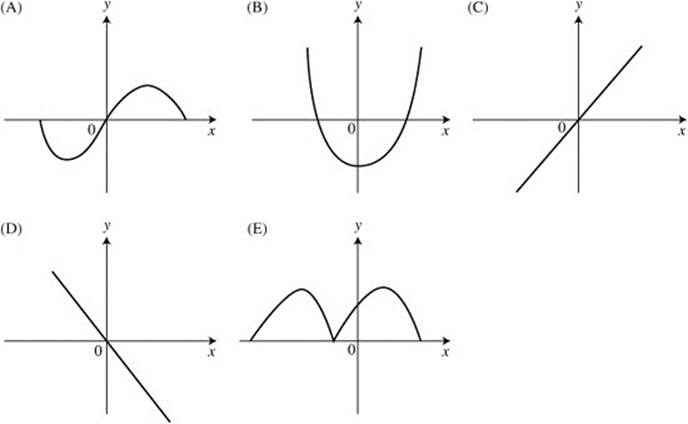
Figure 1T-7
STOP. AP Calculus AB Practice Exam 1 Section I—Part A
Section I—Part B

Directions:
Use the same answer sheet for Part A. Please note that the questions begin with number 76. This is not an error. It is done to be consistent with the numbering system of the actual AP Calculus AB Exam. All questions are given equal weight. There is no penalty for unanswered questions. Unless otherwise indicated, the domain of a function f is the set of all real numbers. If the exact numerical value does not appear among the given choices, select the best approximate value. The use of a calculator is permitted in this part of the exam.
76. If  , then f has a local maximum at x =
(A) 0
![]()
(C) π
![]()
(E) 2π
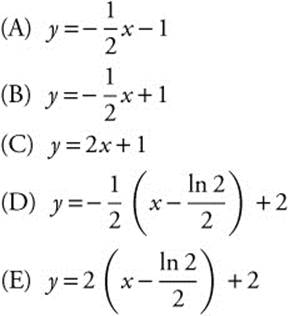
77. The equation of the normal line to the graph y = e2x at the point where ![]() is
is
78. The graph of f′, the derivative of f, is shown in Figure 1T-8. At which value of x does the graph of f have a point of inflection?
(A) 0
(B) x1
(C) x2
(D) x3
(E) x4
79. The temperature of a metal is dropping at the rate of g (t) = 10e−0.1t for 0 ≤ t ≤ 10, where g is measured in degrees in Fahrenheit and t in minutes. If the metal is initally 100°F, what is the temperature to the nearest degree
Fahrenheit after 6 minutes?
(A) 37
(B) 45
(C) 55
(D) 63
(E) 82
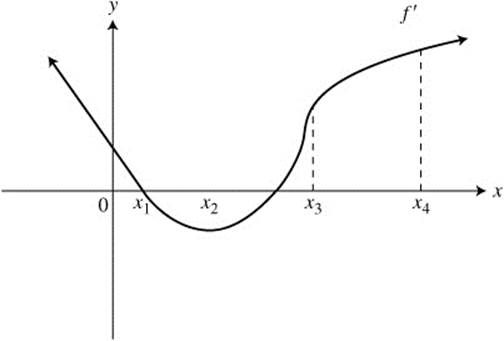
Figure 1T-8
80. What is the approximate volume of the solid obtained by revolving the region in the first quadrant enclosed by the curves y = x3 and y = sin x about the x-axis?
(A) 0.061π
(B) 0.139π
(C) 0.215π
(D) 0.225π
(E) 0.278π
81. Let f be a differentiable function on (a, b). If f has a point of inflection on (a, b), which of the following could be the graph of f″ on (a, b)? (See Figure 1T-9.)
(A) A
(B) B
(C) C
(D) D
(E) None
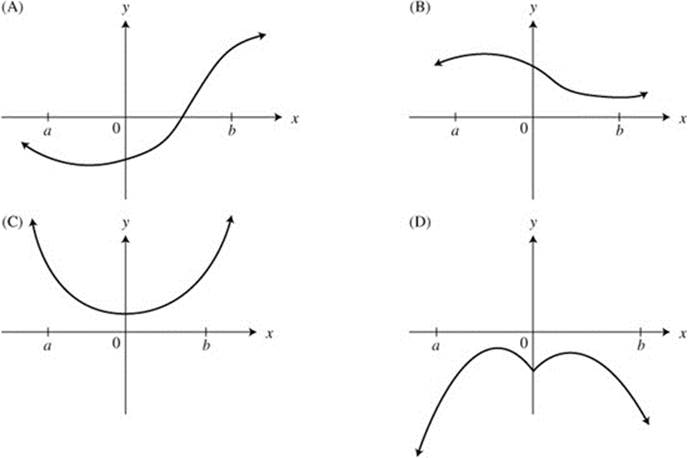
Figure 1T-9
82. The base of a solid is a region bounded by the lines y = x, y = − x, and x = 4 as shown in Figure 1T-10. What is the volume of the solid if the cross sections perpendicular to the x-axis are equilateral triangles?
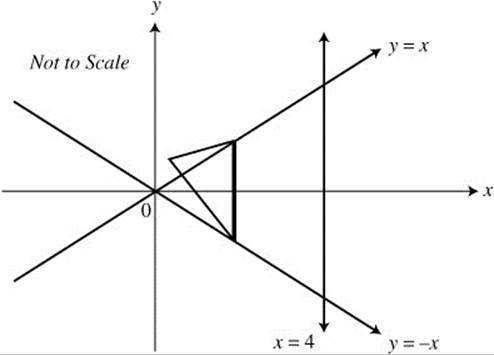
Figure 1T-10


![]()
![]()
83. Let f be a continuous function on [0, 6] and have selected values as shown below.
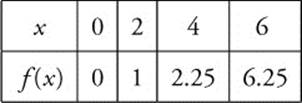
If you use the subintervals [0, 2], [2, 4], and [4, 6], what is the trapezoidal approximation of 
(A) 9.5
(B) 12.75
(C) 19
(D) 25.5
(E) 38.25
84. The amount of a certain bacteria y in a petri dish grows according to the equation ![]() , where k is a constant and t is measured in hours.
, where k is a constant and t is measured in hours.
If the amount of bacteria triples in 10 hours, then k ≈
(A) − 1.204
(B) − 0.110
(C) 0.110
(D) 1.204
(E) 0.3
85. The volume of the solid generated by revolving the region bounded by the graphs of ![]() and y = x about the y-axis is
and y = x about the y-axis is
![]()
![]()
![]()
![]()
![]()
86. How many points of inflection does the graph of ![]() have on the interval (−π, π)?
have on the interval (−π, π)?
(A) 0
(B) 1
(C) 2
(D) 3
(E) 4
87. Given f(x) = x2 ex, what is an approximate value of f (1.1), if you use a tangent line to the graph of f at x = 1?
(A) 3.534
(B) 3.635
(C) 7.055
(D) 8.155
(E) 10.244
88. The area under the curve y = sin x from x = b to x = π is 0.2. If 0 ≤ b < π, then b =
(A) − 0.927
(B) − 0.201
(C) 0.644
(D) 1.369
(E) 2.498
89. At what value(s) of x do the graphs of y = x2 and ![]() have perpendicular tangent lines?
have perpendicular tangent lines?
(A) − 1
(B) 0
![]()
(D) 1
(E) None
90. What is the approximate slope of the tangent to the curve x3 + y3 = x y at x = 1?
(A) − 2.420
(B) − 1.325
(C) − 1.014
(D) − 0.698
(E) 0.267
91. The graph of f is shown in Figure 1T-11, and  , x > a. Which of the following is a possible graph of g? (See Figure 1T-12.)
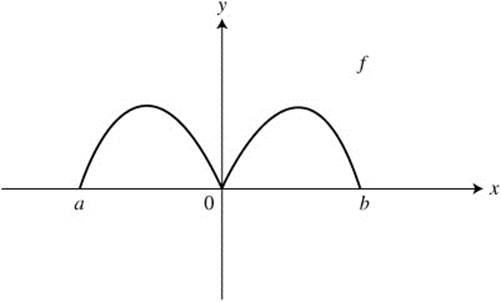
Figure 1T-11
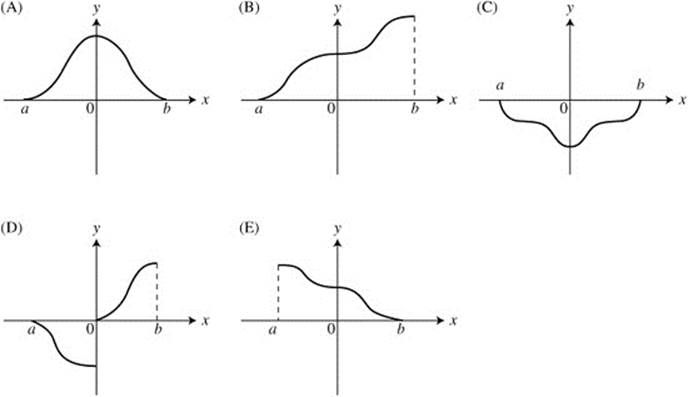
Figure 1T-12
92. If g(x) = |xex|, which of the following statements about g are true?
I. g has a relative minimum at x = 0.
II. g changes concavity at x = 0.
III. g is differentiable at x = 0.
(A) I only
(B) II only
(C) III only
(D) I and II only
(E) I and III only
STOP. AP Calculus AB Practice Exam 1 Section I—Part B
Section II—Part A

Directions:
Show all work. You may not receive any credit for correct answers without supporting work. You may use an approved calculator to help solve a problem. However, you must clearly indicate the setup of your solution using mathematical notations and not calculator syntax. Calculators may be used to find the derivative of a function at a point, compute the numerical value of a definite integral, or solve an equation. Unless otherwise indicated, you may assume the following: (a) the numeric or algebraic answers need not be simplified; (b) your answer, if expressed in approximation, should be rounded to 3 places after the decimal point; and (c) the domain of a function f is the set of all real numbers.
1. The slope of a function at any point (x, y) is  The point (0, 2 ln 2) is on the graph
(A) Write an equation of the tangent line to the graph of f at x = 0.
(B) Use the tangent line in part (A) to approximate f (0.1) to the nearest thousandth.
(C) Solve the differential equation ![]() with the initial condition f(0) = 2 ln2.
with the initial condition f(0) = 2 ln2.
(D) Use the solution in part (C) and find f (0.1) to the nearest thousandth.
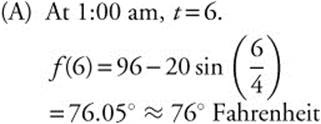
2. The temperature in a greenhouse from 7:00 p.m. to 7:00 a.m. is given by ![]() , where f(t) is measured in Fahrenheit, and t is the number of hours since 7:00 p.m.
, where f(t) is measured in Fahrenheit, and t is the number of hours since 7:00 p.m.
(A) What is the temperature of the greenhouse at 1:00 a.m. to the nearest degree Fahrenheit?
(B) Find the average temperature between 7:00 p.m. and 7:00 a.m. to the nearest tenth of a degree Fahrenheit.
(C) When the temperature of the greenhouse drops below 80°F, a heating system will automatically be turned on to maintain the temperature at a minimum of 80°F. At what value of t to the nearest tenth is the heating system turned on?
(D) The cost of heating the greenhouse is $0.25 per hour for each degree. What is the total cost to the nearest dollar to heat the greenhouse from 7:00 p.m. and 7:00 a.m.?
STOP. AP Calculus AB Practice Exam 1 Section II—Part A
Section II—Part B

Directions:
The use of a calculator is not permitted in this part of the exam. When you have finished this part of the exam, you may return to the problems in Part A of Section II and continue to work on them. However, you may not use a calculator. You should show all work. You may not receive any credit for correct answers without supporting work. Unless otherwise indicated, the numeric or algebraic answers need not be simplified, and the domain of a function fis the set of all real numbers.
3. A particle is moving on a straight line. The velocity of the particle for 0 ≤ t ≤ 30 is shown in the table below for selected values of t.

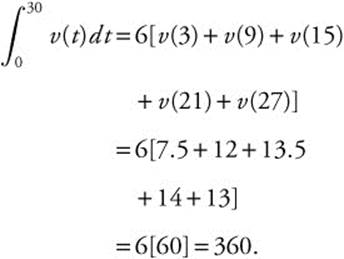
(A) Using MRAM (Midpoint Rectangular Approximation Method) with five rectangles, find the approximate value of 
(B) Using the result in part (A), find the average velocity over the interval 0 ≤ t ≤ 30.
(C) Find the average acceleration over the interval 0 ≤ t ≤ 30.
(D) Find the approximate acceleration at t = 6.
(E) During what intervals of time is the acceleration negative?
4. (See Figure 1T-13.)
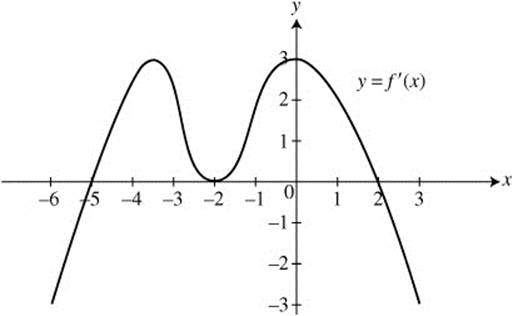
Figure 1T-13
The graph of f′, the derivative of a function f, for 6 ≤ x ≤ 3 is shown in Figure 1T-13.
(A) At what value(s) of x does f have a relative maximum value? Justify your answer.
(B) At what value(s) of x does f have a relative minimum value? Justify your answer.
(C) At what value(s) of x does the function have a point of inflection? Justify your answer.
(D) If f (− 5) = 2, draw a possible sketch of f on − 6 < x < 3.
5. Given the equation y2 − x + 2y − 3 = 0:
(A) Find ![]() .
.
(B) Write an equation of the line tangent to the graph of the equation at the point (0, − 3).
(C) Write an equation of the line normal to the graph of the equation at the point (0, − 3).
(D) The line ![]() is tangent to the graph at point P. Find the coordinates of point P.
is tangent to the graph at point P. Find the coordinates of point P.
6. Let R be the region enclosed by the graph of y = x2 and the line y = 4.
(A) Find the area of region R.
(B) If the line x = a divides region R into two regions of equal area, find a.
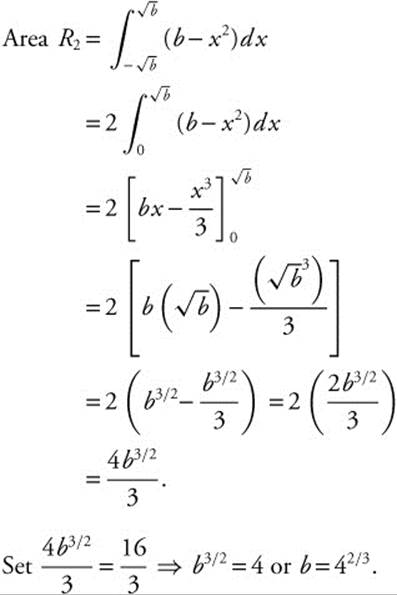
(C) If the line y = b divides the region R into two regions of equal area, find b.
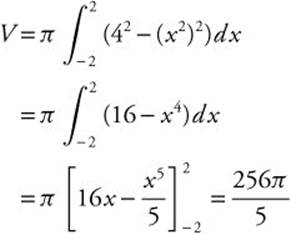
(D) If region R is revolved about the x-axis, find the volume of the resulting solid.
STOP. AP Calculus AB Practice Exam 1 Section II—Part B
Answers to AB Practice Exam 1—Section I
Part A
1. C
2. C
3. C
4. E
5. D
6. A
7. C
8. C
9. D
10. E
11. C
12. C
13. A
14. C
15. B
16. E
17. C
18. E
19. A
20. B
21. A
22. C
23. A
24. E
25. A
26. C
27. B
28. E
Part B
76. D
77. B
78. C
79. C
80. B
81. A
82. C
83. B
84. C
85. A
86. C
87. A
88. E
89. D
90. C
91. B
92. D
Answers to AB Practice Exam 1—Section II
Part A
1. ![]()
(B) 1.436
(C) y = ln(ex + 1) + ln 2
(D) 1.438
2. (A) 76
(B) 82.7
(C) 3.7 ≤ t ≤ 8.9
(D) $3
Part B
3. (A) 360 (3 pts.)
(B) 12 m/sec (1 pt.)
(C) 0.4 m/sec2 (2 pts.)
(D) 0.75 m/sec2 (1 pt.)
(E) 18 < t < 30 (2 pts.)
4. (A) x = 2 (2pts.)
(B) x = −5 (2pts.)
(C) x = −4, x = −2 and x = 0 (2pts.)
(D) See solution. (3 pts.)
5. ![]()
![]()
(C) y = 4x −3 (2pts.)
(D) (0, 1) (2 pts.)
6. ![]()
(B) a = 0 (1pt.)
(C) b = 42/3 (2 pts.)
![]()
Solutions to AB Practice Exam 1—Section I
Section I—Part A
1. The correct answer is (C).

2. The correct answer is (C).

3. The correct answer is (C).

Surface Area = 4π r2 = 4π(2)2 = 16π.
4. The correct answer is (E).
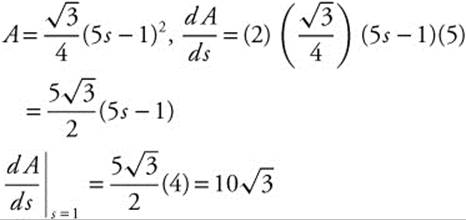
5. The correct answer is (D).

Since the two, one-sided limits are the same, ![]() .
.
6. The correct answer is (A).
(See Figure 1TS-1.)
The only graph that satisfies the behavior of f is (A).
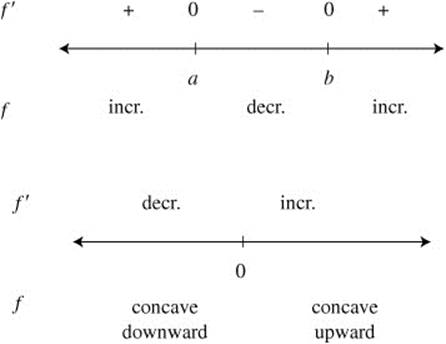
Figure 1TS-1
7. The correct answer is (C).
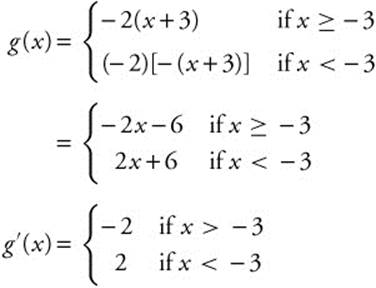
Thus, ![]()
8. The correct answer is (C).
The definition of f′(x) is f′(x)
![]()
Thus,
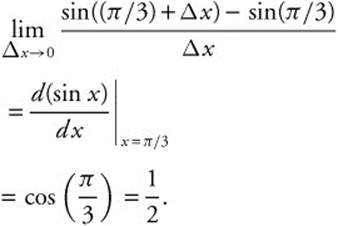
9. The correct answer is (D).
Since
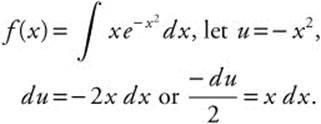
Thus,
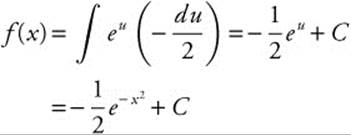
and
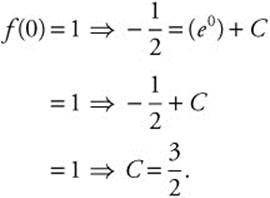
Therefore, ![]()
![]()
10. The correct answer is (E).
g (x) = 3 [tan(2x)]2;
g′(x) = 6 [tan(2x)] sec2(2x)2
= 12 tan(2x) sec2(2x);

11. The correct answer is (C).
I. f′(0) ≠ 0 since the tangent to f(x) at x = 0 is not parallel to the x-axis.
II. f has an absolute maximum at x = a.
III. f′′ is less than 0 on (0, b) since f is concave downward.
Thus, only statements II and III are true.
12. The correct answer is (C).
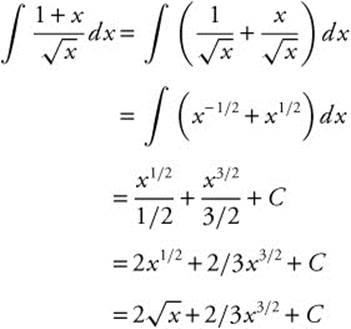
13. The correct answer is (A).
I. f (′ 1) = 0
II. Since f is increasing, f′(− 1) > 0.
III. Since f is concave upward, f′′(− 1) > 0.
Thus, f (− 1) has the smallest value.
14. The correct answer is (C).
Since
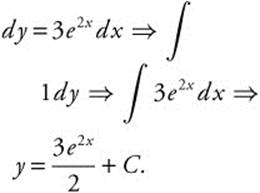
At x = 0,

Therefore, ![]() .
.
15. The correct answer is (B).
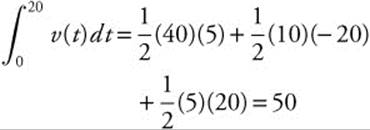
16. The correct answer is (E).
![]() and a(t) = t − 1 and a′(t) = 1.
and a(t) = t − 1 and a′(t) = 1.
Set a(t) = 0 ⇒ t = 1. Thus, v(t) has a relative minimum at t = 1 and ![]() . Since it is the only relative extremum, it is an absolute minimum. And, since v(t) is continuous on the closed interval [0, 4], thus v(t) has an absolute maximum at the endpoints v(0) = 1 and v(4) = 8 − 4 + 1 = 5.
. Since it is the only relative extremum, it is an absolute minimum. And, since v(t) is continuous on the closed interval [0, 4], thus v(t) has an absolute maximum at the endpoints v(0) = 1 and v(4) = 8 − 4 + 1 = 5.
Therefore, the maximum velocity of the particle on [1, 4] is 5.
17. The correct answer is (C).
Since y = |2x| is symmetrical with respect to the y-axis,
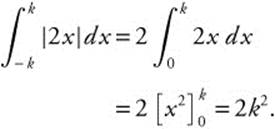
Set 2k2 = 18 ⇒ k2 = 9 ⇒ k = ± 3. Since k > 0, k = 3.
18. The correct answer is (E).
(See Figure 1TS-2.)
If b = 0, then 0 is a root and thus, r = 0.
If b = 1, 2, or 3, then the graph of f must cross the x-axis which implies there is another root.
Thus, b = −1.
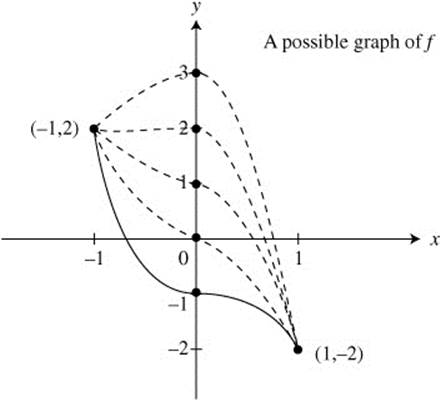
Figure 1TS-2
19. The correct answer is (A).
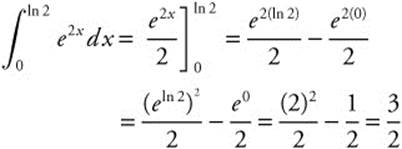
20. The correct answer is (B).
The graph of ![]() is a semicircle above the x-axis, the endpoints of which are (− 3, 0) and (3, 0). Thus, the radius of the circle is
is a semicircle above the x-axis, the endpoints of which are (− 3, 0) and (3, 0). Thus, the radius of the circle is ![]() .
.
21. The correct answer is (A).
(See Figure 1TS-3.)
The graphs f(x − b) and f(x + b) are the same as the graph of f(x) shifted b units to the right and left, respectively. Looking at Figure 1TS-3, only I and II have the same value.
22. The correct answer is (C).
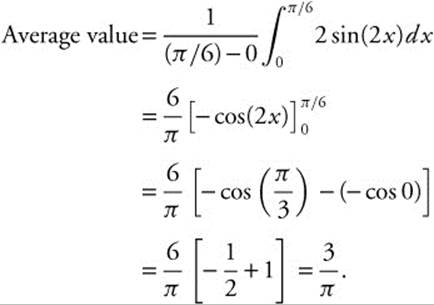

Figure 1TS-3
23. The correct answer is (A).
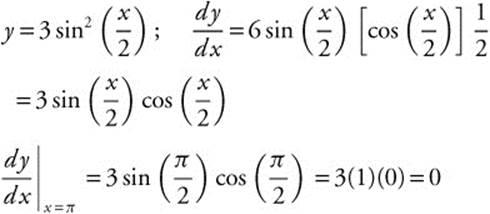
At x = π, ![]() .
.
Equation of tangent at x = π; y = 3.
24. The correct answer is (E).
s(t) = t3 + t2 − 8t; v(t) = 3t2 + 2t − 8
Set
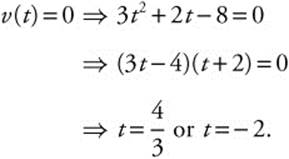
Since 0 ≤ t ≤ 10, t = −2 is not in the domain.
If ![]() , v(t) > 0 ⇒ the particle is moving to the right.
, v(t) > 0 ⇒ the particle is moving to the right.
25. The correct answer is (A).
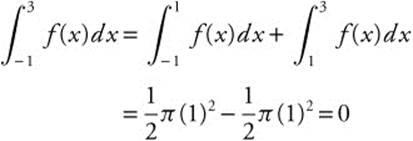
26. The correct answer is (C).
f′(x) = x (x 3 + 1)3/2; f′(2) = 2(23 + 1)3/2
= 2(9)3/2 = 54
27. The correct answer is (B).
 is an even function, i.e., f(x) = f (− x).
The graph in (B) is the only even function.
28. The correct answer is (E).
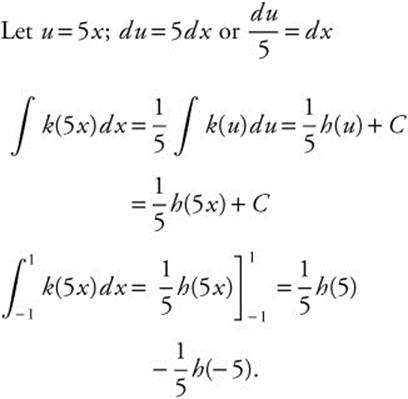
Section I—Part B
76. The correct answer is (D).

Let f′(x) = 0 ⇒ − cos x = 0 ⇒ x = π/2 or 3π/2. (See Figure 1TS-4.)
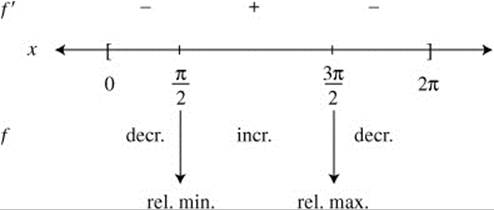
Figure 1TS-4
Thus f has a local maximum at ![]() .
.
77. The correct answer is (B).
y = e2x; ![]()
Set

At

78. The correct answer is (C).
(See Figure 1TS-5.)
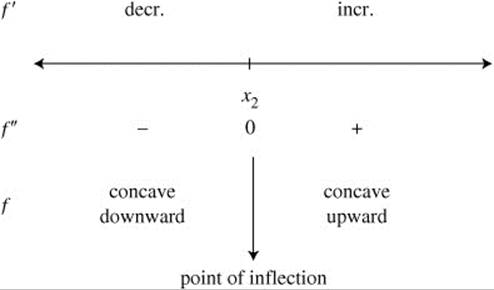
Figure 1TS-5
The graph of f has a point of inflection at x = x2.
79. The correct answer is (C).

Using your calculator, you obtain:
Temperature of metal = 100 − 45.1188
= 54.8812 ≈ 55°F.
80. The correct answer is (B).
(See Figure 1TS-6.)
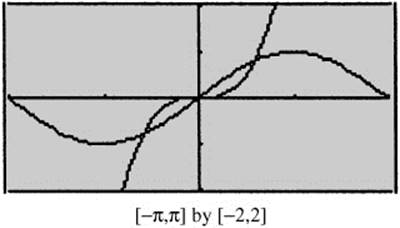
Figure 1TS-6
Using the [Intersection] function on your calculator, you obtain the points of intersection: (0, 0) and (0.929, 0.801).

81. The correct answer is (A).
A point of inflection ⇒ the graph of f changes its concavity ⇒ f″ changes signs. Thus, the graph in (A) is the only one that goes from below the x-axis (negative) to above the x-axis (positive).
82. The correct answer is (C).

Using your calculator, you have:

83. The correct answer is (B).

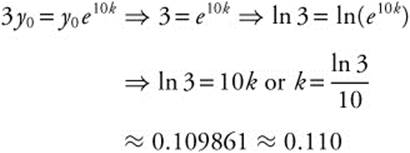
84. The correct answer is (C).
![]()
Triple in 10 hours ⇒ y = 3y0 at t = 10.
85. The correct answer is (A).
(See Figure 1TS-7.)
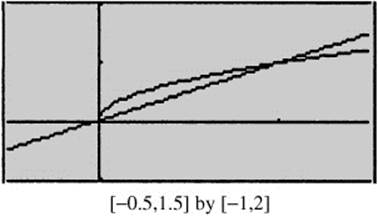
Figure 1TS-7
Points of intersection: (0, 0) and (1, 1).

Using your calculator, you obtain:
![]()
86. The correct answer is (C).
(See Figure 1TS-8.)
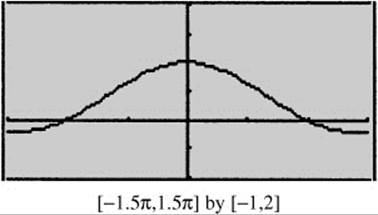
Figure 1TS-8
Using the [Inflection] function on your calculator, you obtain x = −2.08 and x = 2.08. Thus, there are two points of inflection on (− π, π).
87. The correct answer is (A).
f(x) = x2 ex
Using your calculator, you obtain f (1) ≈ 2.7183 and f′(1) ≈ 8.15485.
Equation of tangent line at x = 1:
y − 2.7183 = 8.15485(x − 1)
y = 8.15485(x − 1) + 2.7183
f (0.01) ≈ 8.15485(1.1 − 1) + 2.7183
≈ 3.534.
88. The correct answer is (E).
(See Figure 1TS-9).
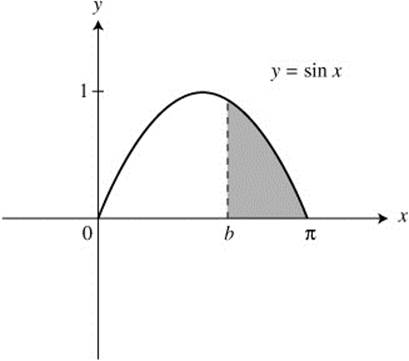
Figure 1TS-9
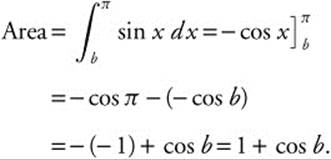
Set 1 + cos b = 0.2 ⇒ cos b = − 0.8 ⇒ b = cos−1(− 0.8) ⇒ b ≈ 2.498.
89. The correct answer is (D).
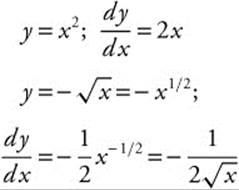
Perpendicular tangent lines ⇒ slopes are negative reciprocals.
Thus, 
![]()
90. The correct answer is (C).
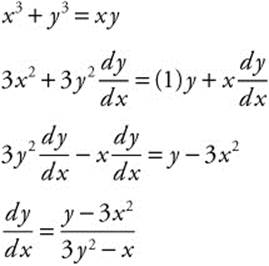
At x = 1, x3 + y3 = x y becomes 1 + y3 = y
⇒ y3 − y + 1 = 0.
Using your calculator, you obtain: y ≈ − 1.325
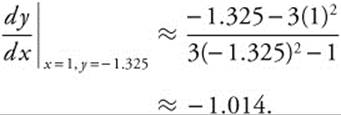
91. The correct answer is (B).

(See Figure 1TS-10.)

Figure 1TS-10
The graph in (B) is the only one that satisfies the behavior of g.
92. The correct answer is (D).
(See Figure 1TS-11.)
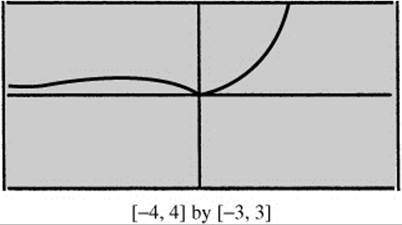
Figure 1TS-11
At x = 0, the graph of g (x) shows: (1) a relative minimum; (2) a change of concavity; (3) a cusp (i.e., not differentiable at x = 0). Thus, only statements I and II are true.
Solutions to AB Practice Exam 1—Section II
Section II—Part A
1.
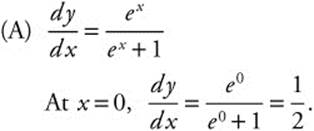
Equation of tangent line at x = 0:
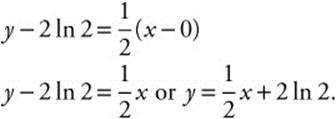

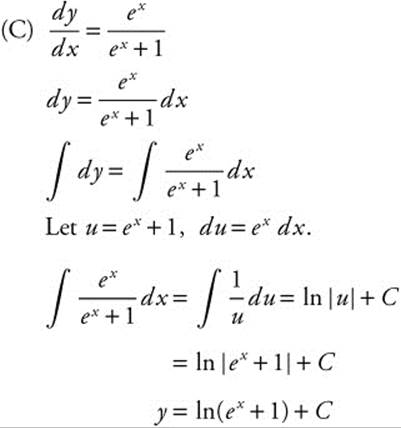
The point (0, 2 ln 2) is on the graph of f.
2 ln2= ln(e0 + 1) + C
2 ln2= ln 2 + C ⇒ C = ln 2
y = ln(ex + 1) + ln 2
2.
(B) Average temperature

Using your calculator, you have:

(C) Let ![]() and y2 = 80.
and y2 = 80.
Using the [Intersection] function of your calculator, you obtain
x = 3.70 ≈ 3.7 or x = 8.85 ≈ 8.9.
Thus, heating system is turned on when 3.7 ⇒ t ⇒ 8.9.
(See Figure 1TS-12.)
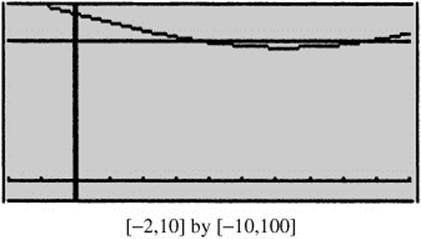
Figure 1TS-12
(D) Total cost
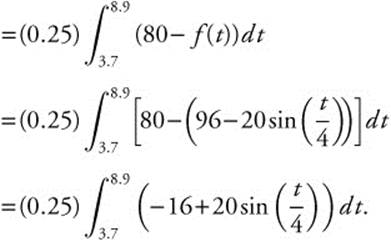
Using your calculator, you have:
= (0.25)(13.629) = 3.407
≈ 3 dollars.
Section II—Part B
3. (A) Midpoints of 5 subintervals of equal length are t = 3, 9, 15, 21, and 27. The length of each subinterval is ![]() .
.
Thus,
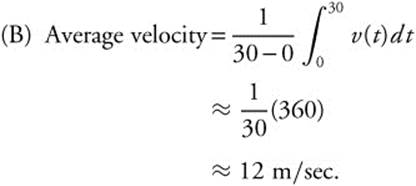

(D) Approximate acceleration at t = 6
![]()
(E) Looking at the velocity in the table, you see that the velocity decreases from t = 18 to t = 30. Thus, the acceleration is negative for 18 < t < 30.
4. (A) (See Figure 1TS-13.)
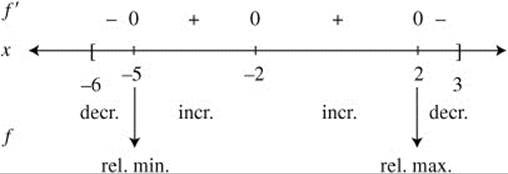
Figure 1TS-13
Since f increases on (−5, 2) and decreases on (2, 3), it has a relative maximum at x = 2.
(B) Since f decreases on (− 6, − 5) and increases on (− 5, 2), it has a relative minimum at x = − 5.
(C) (See Figure 1TS-14.)
A change of concavity occurs at x = − 4, − 2, and 0, and since f′ exists at these x-values, f has a point of inflection at x = − 4, x = − 2, and x = 0.
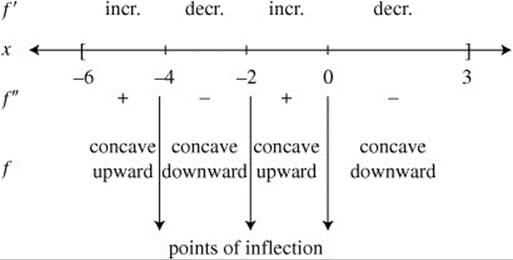
Figure 1TS-14
(D) (See Figure 1TS-15.)
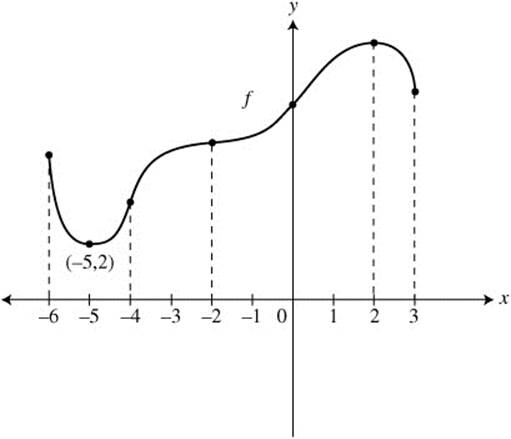
Figure 1TS-15
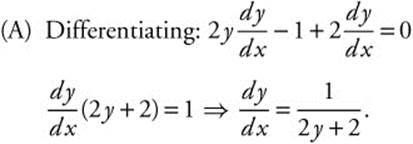
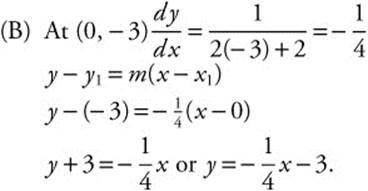
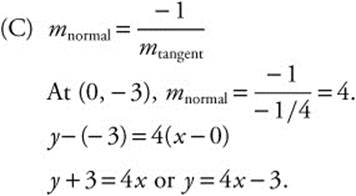
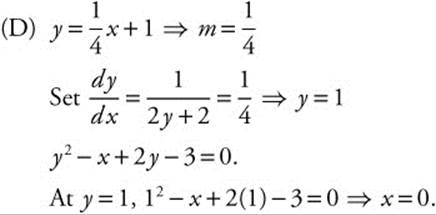
Thus, point P is (0, 1).
6. (See Figure 1TS-16.)
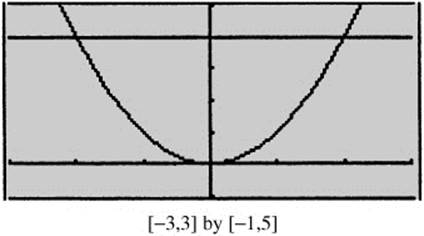
Figure 1TS-16
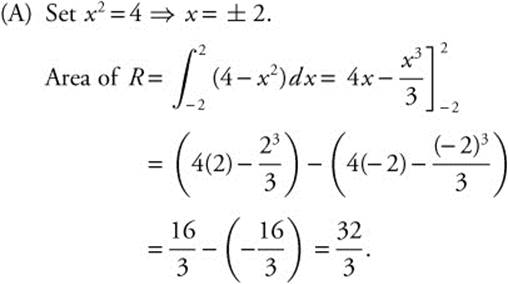
(B) Since y = x2 is an even function, x = 0 divides R into two regions of equal area.
Thus, a = 0.
(C) (See Figure 1TS-17.)
![]()
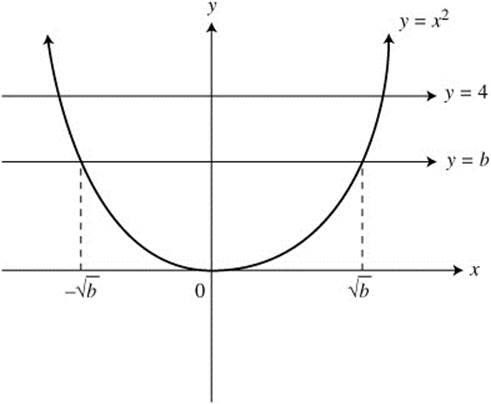
Figure 1TS-17
(D) Washer Method
Scoring Sheet for BC Practice Exam 1
