5 Steps to a 5: AP Physics 2: Algebra-Based 2024 - Jacobs Greg 2023
STEP 4 Review the Knowledge You Need to Score High
10 Thermodynamics and Gases
IN THIS CHAPTER
Summary: Energy transfer in gases can do measurable work on large objects. Thermodynamics is the study of heat energy and how it gets transferred. It’s different from the other topics in this book because the systems focused on are, for the most part, molecular. Since molecules and gases are at the heart of thermodynamics, this chapter includes a lot of material introducing them.

Key Ideas
![]() The behavior of molecules gives rise to the thermal behavior of matter.
The behavior of molecules gives rise to the thermal behavior of matter.
![]() Internal energy is the energy possessed by a substance due to the vibration of molecules. A substance’s internal energy depends on its temperature.
Internal energy is the energy possessed by a substance due to the vibration of molecules. A substance’s internal energy depends on its temperature.
![]() Heat is a transfer of thermal energy.
Heat is a transfer of thermal energy.
![]() Heat is transferred by conduction, convection, and radiation.
Heat is transferred by conduction, convection, and radiation.
![]() When an object’s temperature increases, it expands.
When an object’s temperature increases, it expands.
![]() The ideal gas law connects four important thermodynamics variables: the number of gas molecules, gas pressure, temperature, and volume.
The ideal gas law connects four important thermodynamics variables: the number of gas molecules, gas pressure, temperature, and volume.
![]() Kinetic theory explains how the random motion of many individual molecules in a gas leads to measurable properties such as temperature.
Kinetic theory explains how the random motion of many individual molecules in a gas leads to measurable properties such as temperature.
![]() The first law of thermodynamics is a statement of conservation of energy. It is usually applied when a gas’s state is represented on a pressure vs. volume (PV) diagram. From a PV diagram:
The first law of thermodynamics is a statement of conservation of energy. It is usually applied when a gas’s state is represented on a pressure vs. volume (PV) diagram. From a PV diagram:
(a) Internal energy can be determined using the ideal gas law and PV values from the diagram’s axes.
(b) Work done on or by the gas can be determined from the area under the graph.
(c) Heat added or removed from the gas can NOT be determined directly from the diagram, but rather only from the first law of thermodynamics.
![]() Absolute zero is where all molecular vibrations stop and a gas would have no pressure or volume.
Absolute zero is where all molecular vibrations stop and a gas would have no pressure or volume.
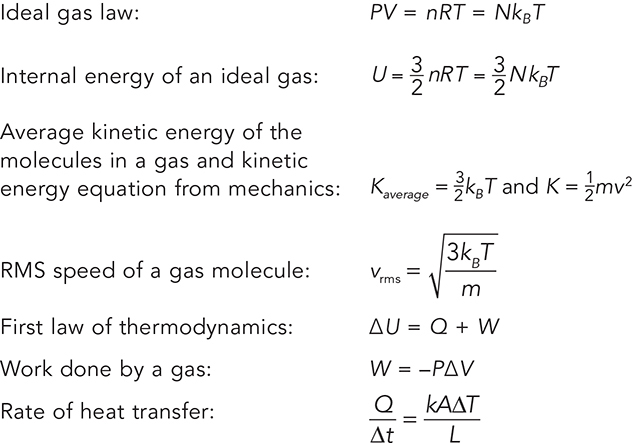
Relevant Equations
Start Small—Atomic Behavior That Produces Thermal Results
Put on your nano-glasses again and peer into the stuff that makes up matter. In Chapter 9, we saw that atoms are in constant motion and their collisions with surfaces give rise to pressure. Let’s take a closer look at atomic motion. Atoms are in motion vibrating around nonstop. This motion is completely random. Some atoms are moving very fast and some are moving slowly—some to the right, some to the left. And now that you blinked, they have collided with each other and changed their motion. It’s constant motion, constantly changing all the time. What can we gather from all this chaos? Quite a bit actually:
• The temperature of the object tells us the speed of the vibrations. Atoms in hot objects, as a whole, vibrate faster. Atoms in cold objects, on average, vibrate slower. In fact, the temperature of an object is a direct measure of the average kinetic energy of the atoms: Kaverage for atoms ∝ T.
• In general, objects get bigger when they are hotter because the atoms are vibrating faster and take up a bit more space. Objects tend to shrink when they become colder. (There are exceptions, like 0°C water and ice, but we will leave that explanation to your college chemistry teacher.)
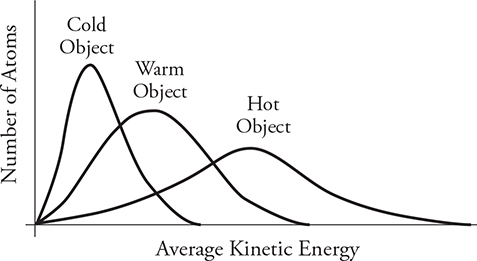
• The motion of atoms is random but has a distinct pattern. The figure above shows the kinetic energy distribution of atoms in an object when it is cold, warm, and hot. (If you are also taking a statistics class right now, you will see that these look similar to “normal distribution curves.”) The vertical axis shows the number of atoms while the horizontal axis shows the kinetic energy. Look at the “cold” curve. Most of the atoms have a slow speed and thus a low kinetic energy. A few atoms are moving kind of fast and a few are moving very slowly, but most are in the middle. This is typical of all the curves. If we warm up the object, its curve will shift to the right because the atoms are gaining kinetic energy overall. The peak of the curve will also shift down because the number of atoms in the object is the same. They are just spread over a wider array of kinetic energies now. When we get the object hot, the curve continues to spread out to the right. The area under each graph should be the same because it’s the same object with the same number of atoms, just at different temperatures. Notice something interesting: a few of the “cold” atoms have more kinetic energy than some of the atoms in the “hot” object. But, on average, the “hot” atoms have more kinetic energy and are moving faster than the “cold” atoms.
• This random motion distribution of atoms is why thermal energy always moves from hot to cold. Molecules in a hot object tend to collide and transfer more energy to the molecules in a cold object because they are moving faster (conservation of momentum). Is it possible for a “cold” molecule to collide and transfer energy to a “hot” molecule? Sure! But on average it is much more likely for energy to transfer from “hot” to “cold” (see the figure below), just like it is much more likely for a speeding car to transfer energy to a slower moving car in a collision than the other way around.

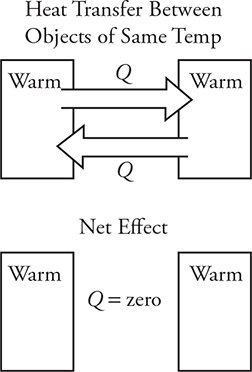
• When does this thermal energy transfer between objects stop? In reality the heat transfer between objects never really stops. Hot objects transfer lots of heat to cold objects. But remember that “cold” objects have a few fast-moving molecules that can transfer heat to the “hot” object. Overall, the net heat transfer is always from hot to cold. Once the two objects reach the same temperature, the average molecular motion is the same for both. So, the objects transfer heat back and forth between each other at equal rates. (See the figure below.) When two objects have the same temperature, they are in thermal equilibrium and the net heat transfer between them is zero.
Now that we have a basic understanding of the nanobehavior of matter and how it influences the macrobehavior of what we see around us, let’s take a closer look at this behavior on a larger scale.
Heat, Temperature, and Power
Heat, represented by the variable Q, is a type of energy that can be transferred from one body to another. As you might expect, heat is measured in joules, because it is a form of energy. Notice that all energy quantities (KE, PE, work) have units of joules. Heat is no different.
Be careful with phraseology here. Energy must be transferred in order to be called heat. So, heat can be gained or lost, but not possessed. It is incorrect to say, “a gas has 3000 J of heat.” Instead we would say “the gas has 3000 J of internal energy.”
Internal Energy: The sum of the energies of all of the molecules in a substance.
Internal energy, represented by the variable U, is also measured in joules, again because it is a form of energy.
Temperature: Related to the average kinetic energy per molecule of a substance.
Temperature is measured in kelvins or degrees Celsius. There is no such thing as “a degree kelvin”; it’s just “a kelvin.” To convert from kelvins to degrees Celsius or vice versa, use the following formula:
![]()
So, if room temperature is about 23°C, then room temperature is also about 296 K.
It is important to note that two bodies that have the same temperature do not necessarily contain the same amount of internal energy. For example, let’s say you have a huge hunk of metal at 20°C and a tiny speck of the same type of metal, also at 20°C. The huge hunk contains a lot more internal energy—it has a lot more molecules moving around—than the tiny speck. By the same logic, you could have two items with very different temperatures that contain exactly the same amount of internal energy.
Power: Work per time
Power is measured in joules/second, or watts:
![]()
Power is not an idea limited to thermodynamics. In fact, we often talk about power in the study of mechanics.
Heat Transfer
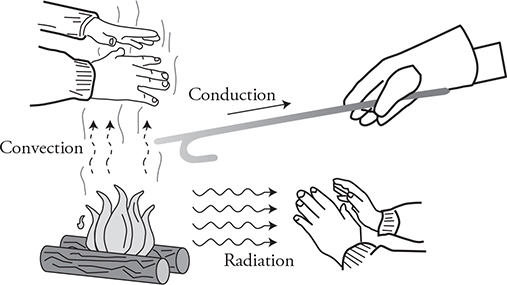
There are three physical methods for heat to transfer: conduction, convection, and radiation.
Conduction: Have you ever noticed that some materials feel colder than others even though they have been sitting in the same room and are at the same temperature? For example, you could have a block of wood and a block of metal sitting on a table in your home. If you picked up the wood, it wouldn’t feel particularly warm or cold, but the metal feels cool to the touch. Well, the reason the metal feels colder than the wood is that it is a better conductor of heat than the wood. It draws heat away from your hand at a faster rate than the wood, making it feel colder.
Conduction is the physical transfer of the atomic vibration energy from atom to atom through an object from the hot end to the colder end. Whenever two objects with different temperatures touch each other, heat will transfer from the hotter object to the colder one through atomic collisions until the objects reach the same temperature, or equilibrium. There are a couple of properties that can affect the rate of heat transfer:
• The thermal conductivity, k, of the material. For example, metals tend to conduct heat better and will have a high thermal conductivity compared to nonmetals.
• The difference in temperatures between the cold and hot objects, ΔT. A greater difference will produce a larger rate of heat transfer.
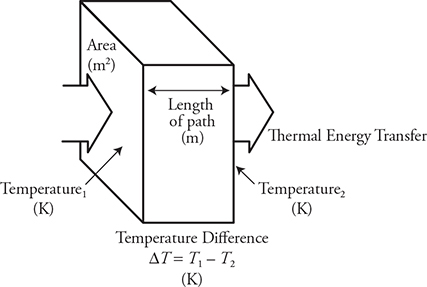
• The cross-sectional area of the material the heat is being transferred along, A—the larger the cross-sectional area of contact, the greater the rate of heat transfer.
• The length, L, of the material the heat is being transferred through—a longer length, the lower the rate of heat transfer.
![]()
![]() is the rate of heat transfer in joules per second, or watts.
is the rate of heat transfer in joules per second, or watts.
Convection is the transfer of thermal energy from one place to another through fluid flow. Remember that hotter objects grow in size because the atoms are moving faster. This affects density; thus when a fluid is hot, it is less dense and will naturally rise.
Radiation is the transfer of energy through electromagnetic waves. It turns out that the vibration of charged particles like protons and electrons create electromagnetic waves (EM waves) that carry energy away from the object. Thus, anything with vibrating molecules is radiating EM waves—including you! This is how infrared vision goggles help you see in the dark. We will talk more about EM waves in Chapter 12.
Kinetic Theory of Gases
We have already looked at how the nano-world affects objects in general. Let’s review and see how atoms influence gases in particular.
Kinetic theory makes several sweeping assumptions about the behavior of molecules in a gas. These assumptions are used to make predictions about the macroscopic behavior of the gas. Don’t memorize these assumptions. Rather, picture a bunch of randomly bouncing molecules in your mind, and see how these assumptions do actually describe molecular behavior.
• Molecules move in continuous, random motion.
• There are an exceedingly large number of molecules in any container of gas.
• The separation between individual molecules is large.
• Molecules do not act on one another at a distance; that is, they do not exert electrical or gravitational forces on other molecules.
• All collisions between molecules, or between a molecule and the walls of a container, are elastic (i.e., kinetic energy is not lost in these collisions).

What do you need to know about kinetic theory? You need to understand the above assumptions, and the two important results of kinetic theory. These are derived using Newtonian mechanics and the assumptions. Don’t worry for now about the derivation; just learn the equations and what they mean:
1. The relationship between the internal energy of a gas and its temperature is
![]()
This equation allows you to find the temperature of a gas given its internal energy, or vice versa.
2. The average kinetic energy of a gas is directly related to the temperature of the gas with the temperature in Kelvin:
![]()
Remember that kinetic energy is:
![]()
Putting this together we get:
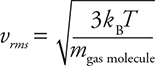
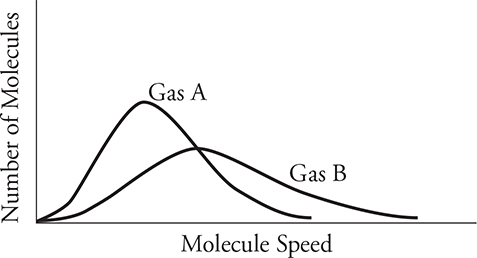
This means that, for the same temperature, gases of different masses will have the same average kinetic energy but different average velocities. Gases with a smaller molecular mass will travel faster at the same temperature than heavier gas molecules.
The next figure shows the molecule speed distributions of two gases. If the two gases have the same temperature, what can you deduce about the two gases? Since they have the same temperature, they must have different masses. Gas A is a more massive molecule.
Ideal Gas Law
This is one that you may remember from chemistry class:
![]()
However, you are probably going to use a different set of units from what you used in chemistry. In physics:
• P is the pressure in pascals. (Remember, a pascal represents a force of 1 newton spread over an area of 1 meter squared.)
• V is the volume of the gas in cubic meters (m3).
• n is the number of moles of gas.
• R is the ideal gas constant (R = 8.31 J/mol·K).
• T is the temperature of the gas in Kelvin (K).
This same relationship can be written as:
![]()
where:
• N is the number of molecules.
• kB is Boltzmann’s constant. (It is equal to the ideal gas constant, R, divided by Avogadro’s number, kB = 1.38 × 10—23 J/K.)
Be careful about your units. For volume, remember:
• 1 m3 = 1000 liters = 1 × 106 cm3
• 
where NA = 6.02 × 10²³ molecules/mole
Keep in mind there is a nice shortcut if you have a constant number of moles of gas and you are changing the volume, temperature, or pressure of that gas:
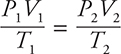
Here’s a sample problem.
The rigid frame of a dirigible holds 5000 m3 of hydrogen. On a warm 20°C day, the hydrogen is at atmospheric pressure. What is the pressure of the hydrogen if the temperature drops to 0°C?
The best way to approach an ideal gas problem is to ask: “What is constant?” In this case, we have a rigid container, meaning that volume of the hydrogen cannot change. Also, unless there’s a hole in the dirigible somewhere, the number of molecules N must stay constant. So the only variables that change are pressure and temperature.
Start by putting the constants on the right-hand side of the ideal gas equation:

Because the right side doesn’t change, we know that the pressure divided by the temperature always stays the same for this dirigible:
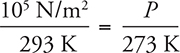
Here atmospheric pressure, as given on the constant sheet, is plugged in (note that temperature must always be in units of kelvins in this equation). Now just solve for P. The answer is 93,000 N/m2, or just a bit less than normal atmospheric pressure.
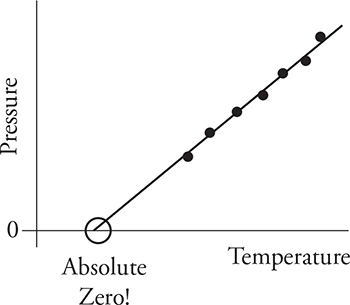
Now let’s take gases to the extreme. Notice how pressure is directly related to the temperature: PV = nRT. If we put a sample of gas in a sealed container so the volume won’t change and then cool the gas in the freezer, what happens to the pressure? It goes down. When you plot pressure as a function of temperature, you get the graph shown below. Notice how the pressure keeps going down with temperature, but it can go only so low. The lowest pressure you can get is zero. The temperature where this occurs is absolute zero. This is when the motion of every molecule in the object ceases. No motion. No kinetic energy. Thus the temperature is zero. This same graph can be made by keeping pressure constant and plotting volume as a function of temperature; the result is the same. Zero volume for the gas will occur at absolute zero.
First Law of Thermodynamics
Before you start this section, be sure you understand the difference between heat and internal energy, as described several pages ago. Furthermore, remember that mechanical work is done whenever a force is applied through a distance.
The first law of thermodynamics is simply a statement of conservation of energy.
![]()
U is the internal energy of the gas in question. Q is the heat added to the gas, and W is the work done on the gas when the gas is compressed.
The signs of each term in the first law are extremely important. If heat is added to the gas, Q is positive, and if heat is taken from the gas, Q is negative. If the gas’s internal energy (and, thus, its temperature) goes up, then ΔU is positive; if the gas’s temperature goes down, then ΔU is negative.
The sign of W is more difficult to conceptualize. Positive W represents work done on a gas. However, if a gas’s volume expands, then work was not done on the gas, work was done by the gas. In the case of work done by a gas, W is given a negative sign.
Here’s a sample problem.
A gas is kept in a cylinder that can be compressed by pushing down on a piston. You add 2500 J of heat to the system, and then you push the piston 1.0 m down with a constant force of 1800 N. What is the change in the gas’s internal energy?
Define the variables in the first law, being careful of signs: Here Q = +2500 J. We’re pushing the piston down; therefore, work is done on the gas, and W is positive. We remember that work = force × distance; so, the work done on the gas here is 1800 N·1 m, or +1800 J. Now plug this into the first law of thermodynamics: the answer is +4300 J.
PV Diagrams
Imagine a gas in a cylinder with a movable piston on top, as shown below.

When the gas expands, the piston moves up, and work is done by the gas. When the piston compresses, work is done on the gas. The point of a heat engine is to add heat to a gas, making the gas expand—in other words, using heat to do some work by moving the piston up.
To visualize this process mathematically, we use a graph of pressure vs. volume, called a PV diagram. On a PV diagram, the x-axis shows the volume of the gas, and the y-axis shows the pressure of the gas at a particular volume.
Don’t be afraid of PV diagrams. Once you learn your way around them, they are really quite simple. Let’s practice.
Isothermals and How to Find T and ΔU on a PV Diagram Using: PV = nRT and ![]()
How do we find temperature on a PV diagram?
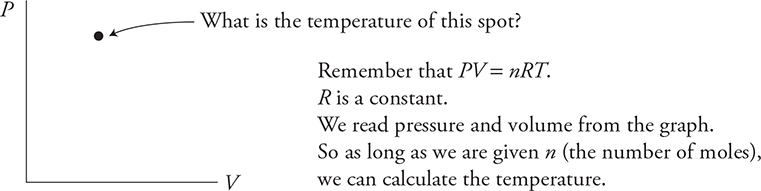
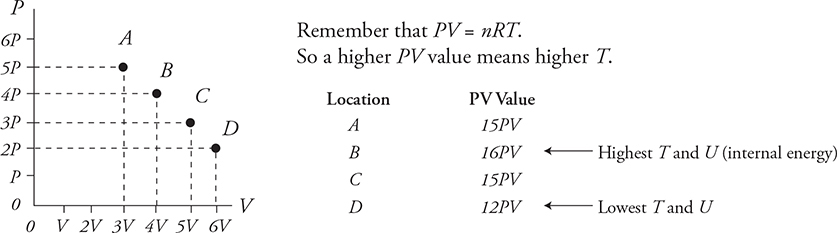
Which of these locations has the highest temperature? At which point is the internal energy highest for the gas?
Which path would you take on this PV diagram to get warmer or colder?
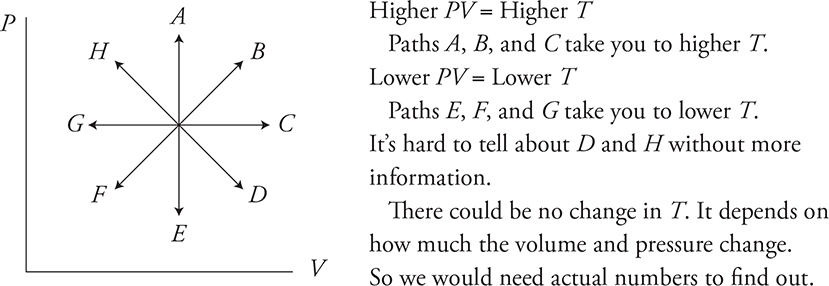
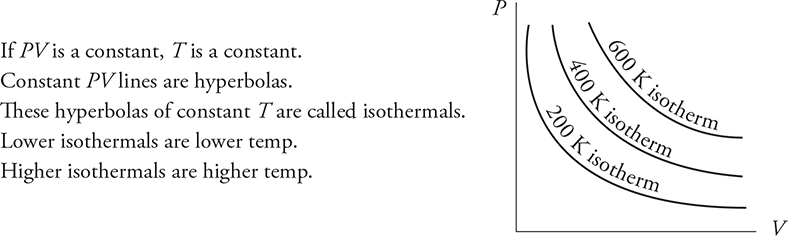
Every point that has the same PV value has the same temperature. These are called isothermal lines.
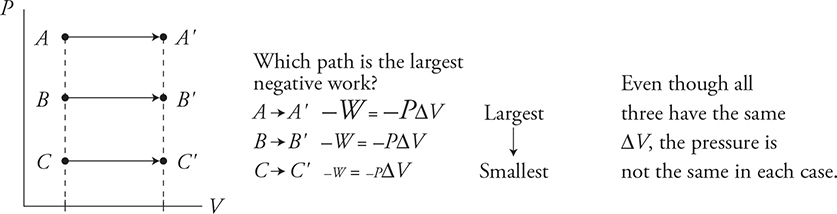
How to Find Work on a PV Diagram Using Wgas = —PΔV
Movement to the right is negative work.
An expanding gas moves the environment thus transferring energy from itself to the environment.
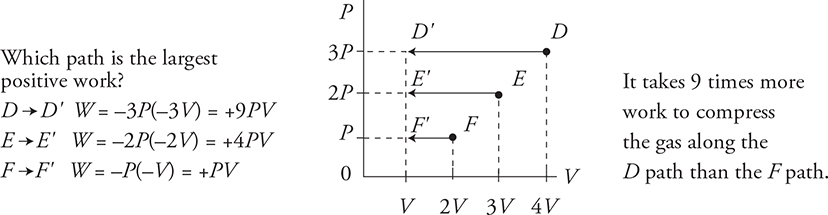
Movement to the left is positive work.
A gas compressed by an outside force receives energy from the outside environment as a consequence.
What happens when you move up or down on the PV diagram?
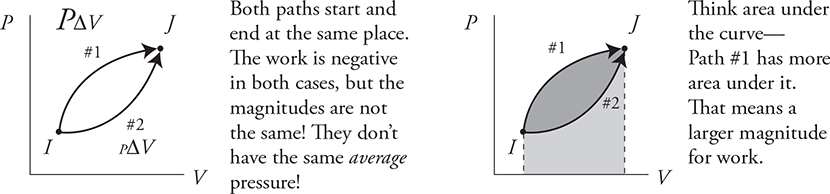
The area under the graph equals the magnitude of the work.
Paths #1 and #2 both have the same starting point and the same ending point, but different amounts of work.
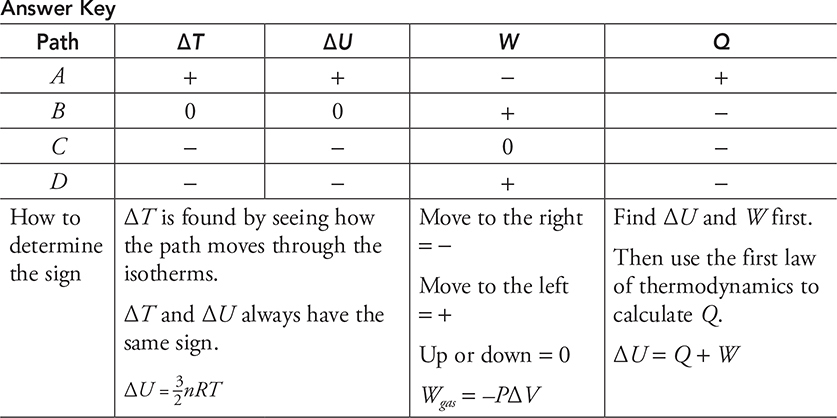
How to Find Heat (Q) on a PV Diagram Using ΔU = Q + W
How do we find heat (Q) from a PV diagram? Well . . . we don’t. Not directly, anyway. We use the first law of thermodynamics: ΔU = Q + W.
Here is the procedure:
1. We either find W and ΔU from the PV diagram or they are given values in a problem.
2. We plug these values into ΔU = Q + W and calculate Q.
That’s it!
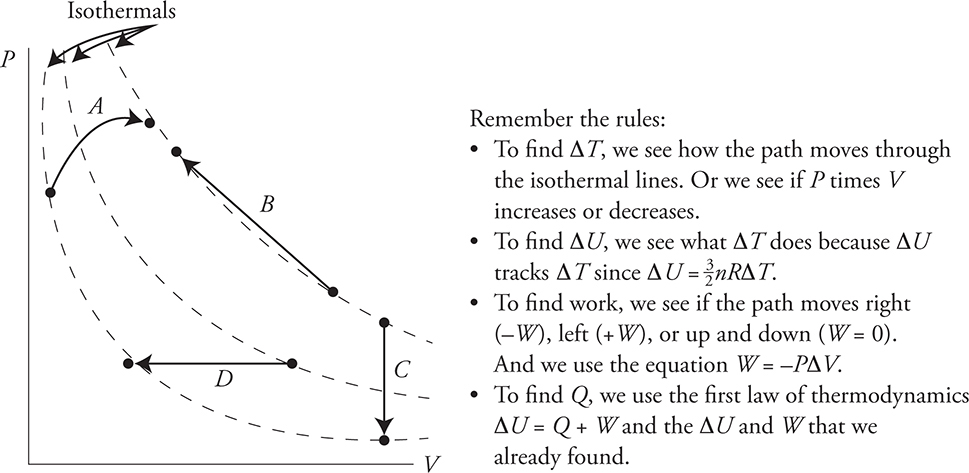
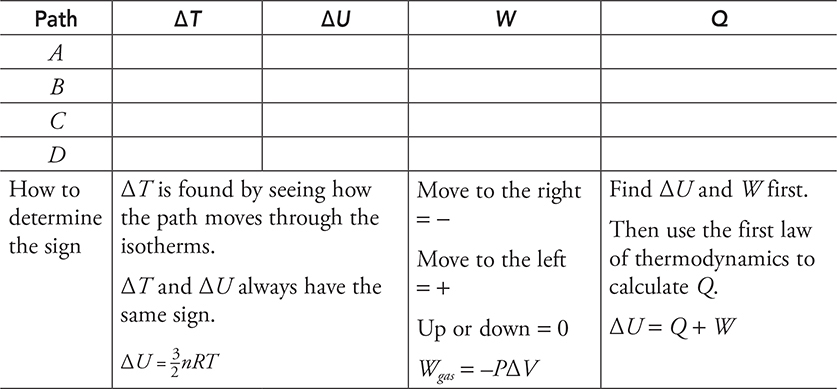
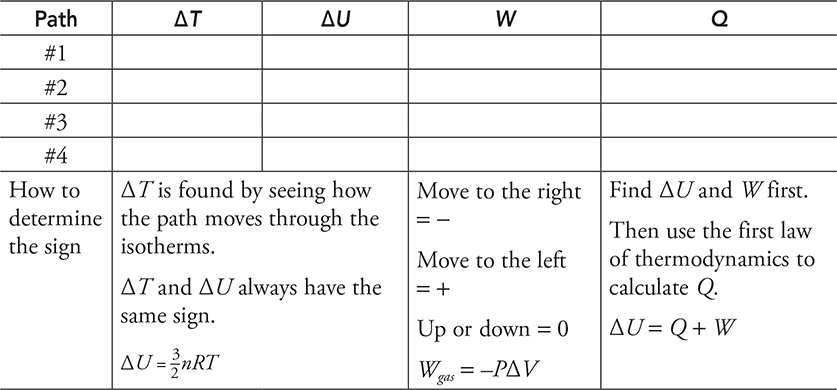
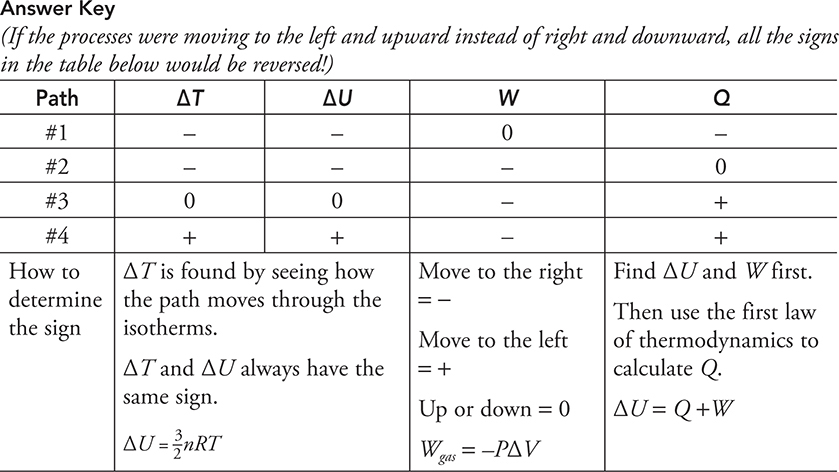
Here is a practice problem with no numbers. For each path in the next diagram, determine if the value is positive, negative, or zero and fill in the table with a + , −, or 0.
Round and Round We Go: Cycles
A cycle is a path on a PV diagram that starts and ends at the same spot. Here are some cycles. Note that each cycle starts at point A and ends at point A. Also, cycle #1 is sometimes referred to as cycle ABCDA.
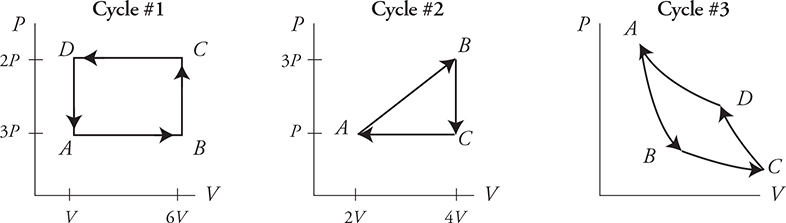
Let’s apply what we have learned:
• Temperature depends on the PV location. Since we start and end at the same spot ΔTcycle = 0.
• Since ΔU and ΔT are related, when ΔTcycle = 0, ΔUcycle = 0.
• That means ΔU drops out of the first law of thermodynamics and the equation becomes Q = —W !
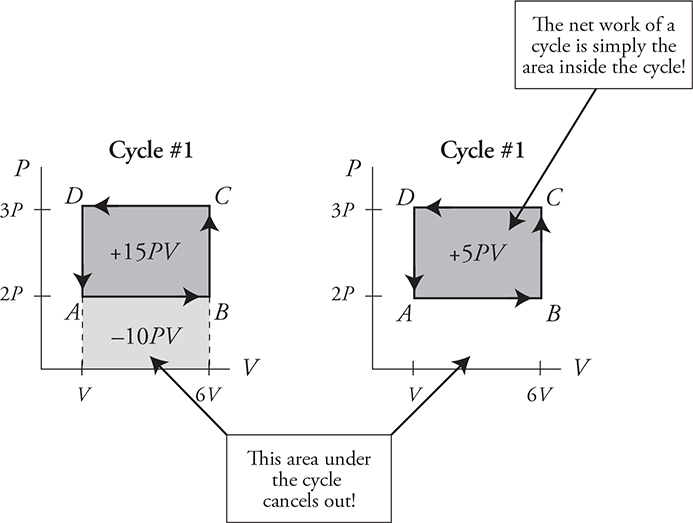
Now look at cycle #1: WAB is negative, WBC and WDA are both zero, and WCD is positive. Note that the positive work of WCD is larger than the negative work of WAB. Thus the net work of cycle #1 is positive! Remember that work = the area under the graph. Look at cycle #1 again. The area under path CD is more than the area under the path AB. Note that the positive and negative areas under the cycle cancel out, leaving only the area inside the cycle. The net work of a cycle = the area inside the cycle.
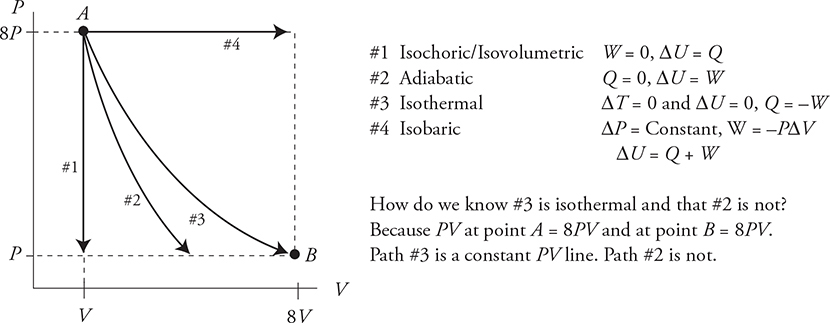
Four Special Processes (Paths) on a PV Diagram
1. Constant Pressure—Isobaric
Wgas = —PΔV is easy to calculate since P = constant. These processes move right and left on a PV diagram.
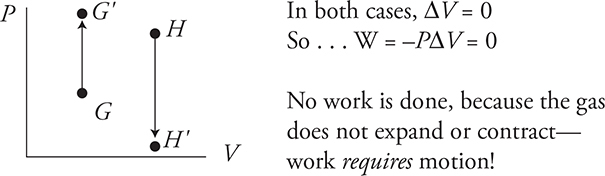
2. Constant Volume—Isochoric/Isovolumetric
W = 0 because ΔV = 0 thus ΔU = Q. These processes move up and down on a PV diagram.
3. Constant Temperature—Isothermal
ΔT = 0; therefore, ΔU = 0 and Q = —W. These processes move along the hyperbolic constant PV lines.
4. No Heat Transfer Between the System and the Environment—Adiabatic
Q = 0 thus ΔU = W. This is a curved path similar to an isothermal but steeper.
What do they look like on the PV diagram? (Note that each of the processes shown next could move in the opposite direction! They just happen to be drawn moving to the right and downward for this example.)
Fill in the table below with a +, −, or 0 to show what is happening to each variable for each of the four special processes as shown above.
Entropy
Entropy is a measure of disorder. A neat, organized room has low entropy . . . the same room after your three-year-old brother plays “tornado!” in it has higher entropy.
There are quantitative measures of entropy, but these are not important for the AP exam. What you do need to know is that entropy relates directly to the second law of thermodynamics. In fact, we can state the second law of thermodynamics as follows.
The entropy of a system cannot decrease unless work is done on that system.
This means that the universe moves from order to disorder, not the other way around. For example: A ball of putty can fall from a height and splat on the floor, converting potential energy to kinetic energy and then to heat—the ball warms up a bit. Now, it is not against the laws of conservation of energy for the putty to convert some of that heat back into kinetic energy and fly back up to where it started from. But does this ever happen? Um, no. The molecules in the putty after hitting the ground were put in a more disordered state. The second law of thermodynamics does not allow the putty’s molecules to become more ordered without work being done on the system.
Or, a glass can fall off a shelf and break. But in order to put the glass back together—to decrease the glass’s entropy—someone has to do work.
If heat flows into a system, the molecules will vibrate around more causing an entropy rise. When heat flows out of a system, the molecules become more ordered and entropy decreases. For example: a refrigerator does work to transfer thermal energy from the food you place inside and deposits this thermal energy into the kitchen. The entropy of the food decreases while the entropy of the kitchen increases.
❯ Practice Problems
Multiple Choice
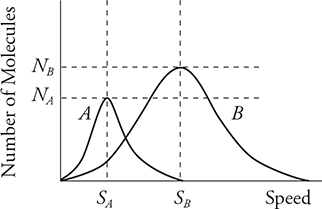
1. The graph above shows the distribution of speeds for two samples of nitrogen gas, each enclosed in separate sealed containers. Sample A has 1 mole of nitrogen molecules and is at a low initial temperature. Sample B has 3 moles of nitrogen molecules and is at a higher initial temperature. (Horizontal and vertical lines NA, NB, SA, and SB are shown for reference to indicate the initial locations of the peak for each graph.) The two samples are put into thermal contact so that heat can flow between the two containers but they are insulated from the surroundings so that no heat is lost. Which of the following graphs depicts a possible speed distribution of the two gases after they have reached equilibrium?
A. 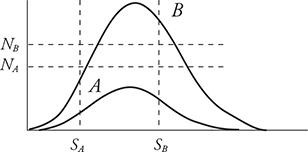
B. 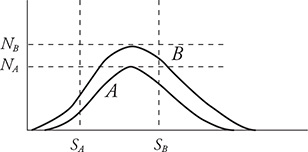
C. 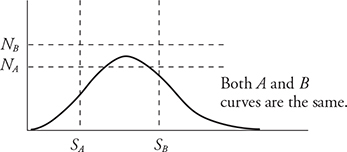
D. 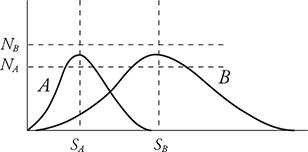
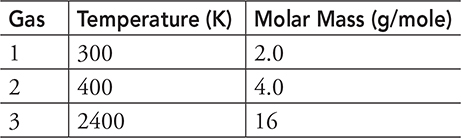
2. Three gas samples with the same number of moles of gas and the same pressure are placed in different temperature environments. Scientists record the molar mass and temperatures of the gases in the table above. What is the correct ranking of the density ρ of the gas samples?
(A) ρ1 > ρ2 > ρ3
(B) ρ1 = ρ3 > ρ2
(C) ρ2 > ρ1 = ρ3
(D) ρ3 > ρ2 > ρ1
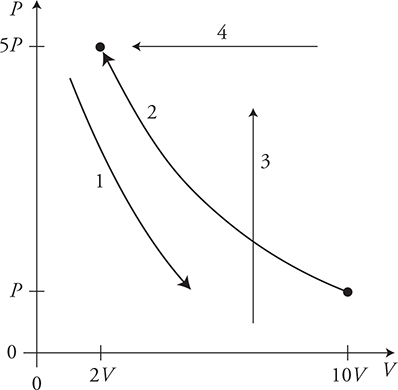
Questions 3 through 5 refer to the following material.
A gas, beginning at point O on the graph, can be taken along four paths to different ending conditions.
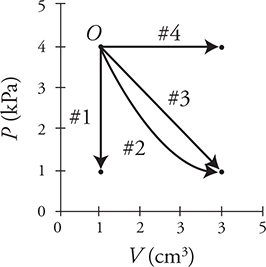
3. Which of the following correctly ranks the paths for work done by the gas?
(A) W4 > W3 > W2 > W1
(B) W4 > W3 = W2 > W1
(C) W4 = W3 = W2 > W1
(D) W4 = W1 > W3 = W2
4. Along which of the paths will the gas absorb the most heat?
(A) 1
(B) 2
(C) 3
(D) 4
5. A gas, beginning at point O on the graph, can be taken along four paths to various ending conditions.
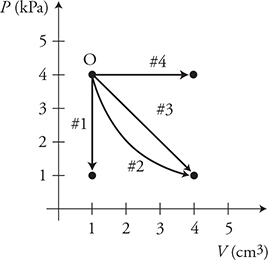
Which of the following quantities are the same for processes 2 and 3? (Select two answers.)
(A) Q
(B) ΔT
(C) ΔU
(D) W
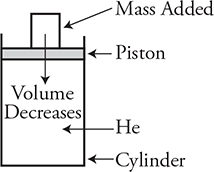
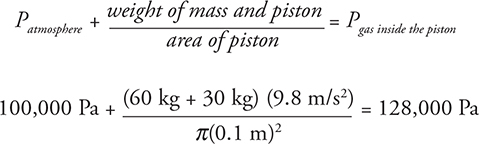
6. A cylinder with a movable piston contains 0.41 mole of helium gas. The piston is open to the atmosphere on the top and has a mass of 30 kg and a radius of 0.1 m. The gas and cylinder are in equilibrium with the atmosphere, which has a temperature of 290 K and pressure of 1.00 × 10⁵ Pa. The initial volume of the helium inside the cylinder is 0.0090 m3 when a 60-kg mass is placed on top of the piston, which compresses the gas to a smaller volume as seen in the figure above. What is the final pressure of the helium gas?
(A) 2.81 × 10⁴ Pa
(B) 1.28 × 10⁵ Pa
(C) 3.00 × 10⁵ Pa
(D) It is not possible to calculate the new pressure without knowing the final temperature and volume of the gas
7. A gas is enclosed in a metal container with a movable piston on top. Heat is added to the gas by placing a candle flame in contact with the container’s bottom. Which of the following is true about the temperature of the gas?
(A) The temperature must go up if the piston remains stationary.
(B) The temperature must go up if the piston is pulled out dramatically.
(C) The temperature must go up no matter what happens to the piston.
(D) The temperature must go down if the piston is compressed dramatically.
8. A car sits outside on a warm sunny day. The car has leather seats, but the owner of the car has covered the driver’s seat with a cotton beach towel. The windows of the car are closed. The sun is at an angle so that it shines directly on the driver’s seat but not the passenger’s seat. After the car has been in the sun for several hours, the owner notices that when she touches the cotton-covered driver’s seat it does not feel as hot as the passenger’s seat, which was not in direct sunlight. Which of the following are correct statements about the two seats? (Select two answers.)
(A) The cotton-covered seat has a higher temperature than the leather seat due to the radiation it has absorbed from the sun.
(B) Cotton conducts heat at a slower rate, making it feel cooler to the owner.
(C) Leather is a better conductor of heat and has absorbed more heat energy from the air in the car, giving it a higher temperature than the cotton-covered seat.
(D) Warm air rises, causing convection currents that take heat away from the cotton-covered seat, making it cooler than the leather seat.
9. Air is made up primarily of nitrogen and oxygen. In an enclosed room with a constant temperature, which of the following statements is correct concerning the nitrogen and oxygen gases?
(A) The nitrogen gas molecules have a higher average kinetic energy than the oxygen gas molecules.
(B) The nitrogen gas molecules have the same average kinetic energy as the oxygen gas molecules.
(C) The nitrogen gas molecules have a lower average kinetic energy than the oxygen gas molecules.
(D) More information is necessary to compare the average kinetic energies of the two gases.
10. Air is made up primarily of nitrogen and oxygen. In an enclosed room with a constant temperature, which of the following statements is correct concerning the nitrogen and oxygen gases?
(A) The nitrogen gas molecules have a higher velocity than the oxygen gas molecules.
(B) The nitrogen gas molecules have the same velocity as the oxygen gas molecules.
(C) The nitrogen gas molecules have a lower velocity than the oxygen gas molecules.
(D) It is impossible to compare the velocity of the two gases without knowing the temperature of the air and the percentage of nitrogen and oxygen in the room.
Free Response
11. A small container of gas undergoes a thermodynamic cycle. The gas begins at room temperature. First, the gas expands isobarically until its volume has doubled. Second, the gas expands adiabatically. Third, the gas is cooled isobarically; finally, the gas is compressed adiabatically until it returns to its original state.
(A) The initial state of the gas is indicated on the PV diagram below. Sketch this process on the graph.
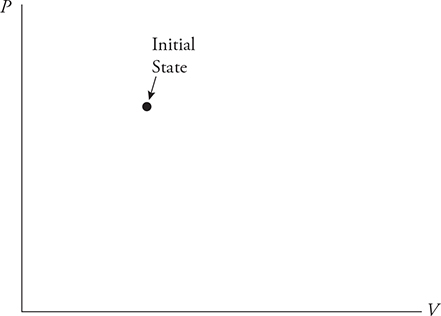
(B) Is the temperature of the gas greater right before or right after the adiabatic expansion? Justify your answer.
(C) Is heat added to or removed from the gas in one cycle?
12. Use the microscopic motion of atoms to explain:
(A) How gases exert pressure on a surface.
(B) Why gas pressure is always perpendicular to the surface with which the gas is in contact.
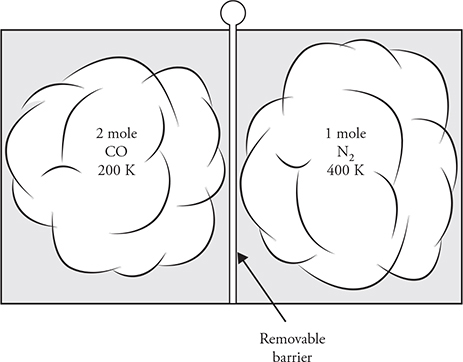
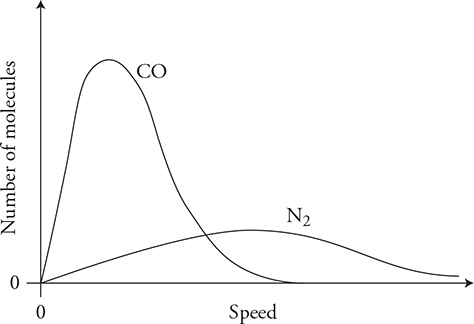
13. Carbon monoxide gas with a molecular mass of 28.0 kg/kmol and an initial temperature of 200 K is confined to the left side of a sealed container. Diatomic nitrogen gas with a molecular mass of 28.0 kg/kmol and an initial temperature of 400 K is confined to the right side of the sealed container, as shown in the figure above. Separating the gases is a removable barrier. When the barrier is removed, the two gases mix.
(A) Describe the temperature changes in the two gases.
(B) Describe any movement of thermal energy over a long period of time. Explain the microscopic process that determines this process.
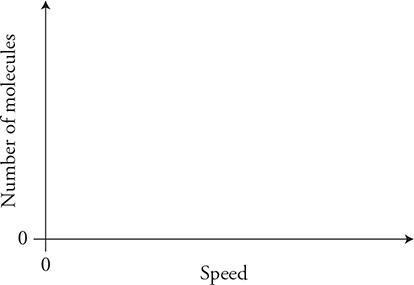
(C) Sketch the initial molecular speed distributions of the two gases on the axis. Label each gas. Explain any differences in the speed distribution of the two gases.

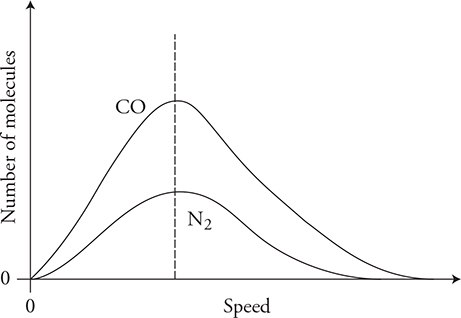
(D) Sketch the final molecular speed distributions of the two gases on the axis. Label each gas. Explain the changes in the graph from the initial condition. Also explain any differences in the speed distributions of the two gases.
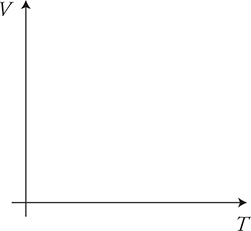
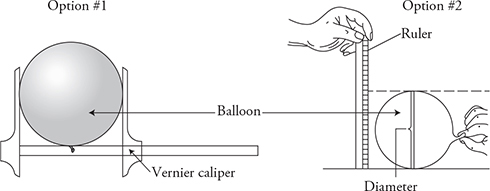
14. A physicist is designing an experiment to determine the relationship between the volume of a gas and the temperature of a gas.
(A) List the items the physicist could use to perform this investigation.
(B) Sketch a simple diagram of the investigation. Make sure to label all items used in the sketch and label any measurements that will be made.
(C) Outline the experimental procedure the physicist could use to gather the necessary data. Indicate the measurements to be taken and how the measurement will be used to obtain the data needed. Make sure your outline contains sufficient detail so that another scientist could follow the procedure and verify the results.
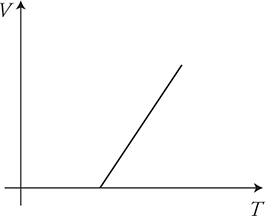
(D) Explain how data from this experiment could be used to determine the value of absolute zero.
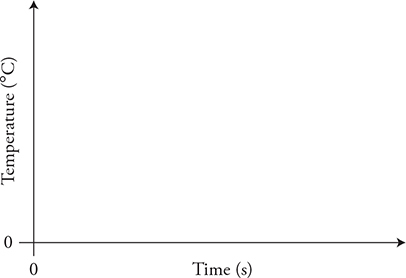
(E) On the axis, sketch the line or curve that you predict will represent the relationship between volume and temperature as shown in the data gathered in this experiment.
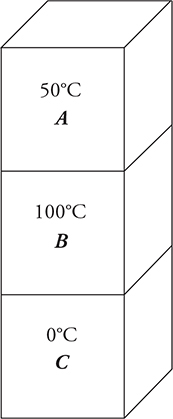
15. Three identical blocks of differing temperatures are stacked on top of one another and insulated from the environment, as shown in the figure above.
(A) Plot the temperature of the blocks versus time. Label each line and indicate all important temperatures on the graph.
(B) Discuss any changes in entropy for block C. Explain your answer at the microscopic level.
(C) Discuss the entropy of the system consisting of all three blocks from initial to final state. Justify your answer.
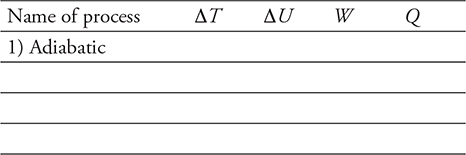
16. A gas is taken through the four processes shown in the figure. For each path, identify the name of the process and determine if the values of ΔT, ΔU, W, and Q are positive, negative, or zero and fill in the table with a +, −, or 0. (The table is begun: Process #1 is adiabatic.) Explain your reasoning.
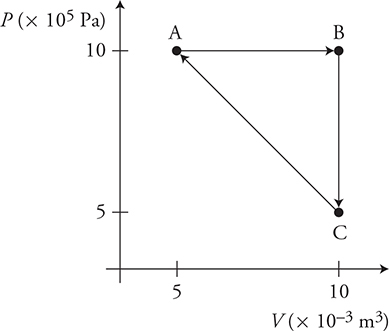
17. Two moles of a gas is taken through the thermodynamic process ABCA, as shown in the figure above.
(A) Rank the work in the steps of the process from most positive to most negative. Justify your reasoning.
(B) Rank the change in temperature of the gas for each step in the process from most positive to most negative. Justify your reasoning.
(C) Rank the thermal energies of the points A, B, and C from greatest to least. Justify your reasoning.
(D) Calculate the temperature of point B.
(E) Calculate the change in temperature for the entire cycle ABCA.
(F) Calculate the work done in process C→A.
(G) Calculate the heat flow for process C→A.
❯ Solutions to Practice Problems
1. (A) At thermal equilibrium, the two gases will have the same temperature and average molecular kinetic energies. Both containers have the same gas, nitrogen; therefore, the molecular mass is the same and the average molecular speeds must also be the same at equilibrium. Container B has more molecules, so its peak must be higher than that of A. The number of molecules of each gas remains the same. Therefore, the areas under the graphs must remain the same. Thus, curve A must decrease in height as it moves to a higher temperature. Curve B must increase in height as it moves to a lower temperature.
2. (C) Density ![]() . The mass is given, molar mass times the number of moles, but we still need the volume. Using the ideal gas law (PV = nRT), we know that the pressure and the number of molecules are constant, which means that volume is proportional to temperature: V ∝ T. Therefore, density is proportional to mass over temperature:
. The mass is given, molar mass times the number of moles, but we still need the volume. Using the ideal gas law (PV = nRT), we know that the pressure and the number of molecules are constant, which means that volume is proportional to temperature: V ∝ T. Therefore, density is proportional to mass over temperature: ![]() . So, taking the molar mass and dividing by the temperature will give the relative density of the three samples!
. So, taking the molar mass and dividing by the temperature will give the relative density of the three samples!
3. (A) Work equals the pressure times the change in volume. Paths 2, 3, and 4 have the same change in volume, but path 4 has the greatest pressure. Path 1 has no change in volume. Work also equals the area under the graph. Path 4 has the largest area. Path 1 has no area.
4. (D) The first law of thermodynamics (ΔU = Q + Wdone by the gas) can be rewritten as: Q = ΔU — Wdone by the gas. Remember that ΔU is directly related to the temperature of the gas. Thus the gas will absorb the most heat, Q, when its temperature goes up the most and when the gas does the most work. Both of these situations occur for path 4.
5. (B) and (C) Both processes end at the same PV value. Thus the temperature and thermal energy change for both processes are the same: ΔU = nRΔT.
6. (B) The final pressure of the helium will equal the pressure of the atmosphere above the cylinder plus the additional pressure created by the combined weight of the mass and piston divided by the area of the piston.
7. (A) Use the first law of thermodynamics, ΔU = Q + W. The candle adds heat to the gas, so Q is positive. Internal energy is directly related to temperature, so if ΔU is positive, then temperature goes up (and vice versa). Here we can be sure that ΔU is positive if the work done on the gas is either positive or zero. The only possible answer is A. In case B, the work done on the gas is negative because the gas expands. (Note that just because we add heat to a gas does NOT mean that temperature automatically goes up!) We have to take into account the work done on or by the gas.
8. (A) and (B) Both seats will absorb heat from the warm air in the car and after several hours would be in thermal equilibrium with the air. However, the driver’s seat is in direct sunlight and will also absorb additional radiation from the sun, making it hotter. The reason it feels cooler to the driver is that cotton has a lower thermal conductivity than leather, so less heat per second transfers to the driver from the cotton-covered seat. Convection will indeed take heat away from the driver’s seat but cannot cool it to a temperature below the air temperature inside the car. Therefore, it can’t cool below the temperature of the passenger’s seat.
9. (B) Gases with the same temperature will have the same average molecular kinetic energy: 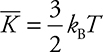 .
.
10. (A) 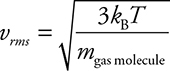 . Nitrogen is lighter than oxygen. Since the molecular velocity is inversely proportional to the mass of the gas molecules, the nitrogen in the air will have a higher overall speed.
11. (A) 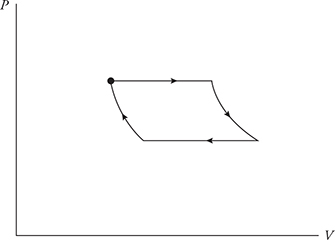
(B) The temperature is greater right before the expansion. By definition, in an adiabatic process, no heat is added or removed. But because the gas expanded, work was done by the gas, meaning the W term in the first law of thermodynamics is negative. Since ΔU = Q + W, Q = 0 and W is negative; ΔU is negative as well. Internal energy is directly related to temperature. Therefore, because internal energy decreases, so does temperature.
(C) In a full cycle, the gas begins and ends at the same state. So the total change in internal energy is zero. Now consider the total work done on or by the gas. When the gas expands in the first and second processes, there’s more area under the graph than when the gas compresses in the second and third processes. So, the gas does more work expanding than compressing; the net work is thus done by the gas, and is negative. To get no change in internal energy, the Q term in the first law of thermodynamics must be positive; heat must be added to the gas.
12. (A) Gas atoms collide with and rebound off of a surface, imparting a tiny impulse on the surface. The sum of many billions of atoms constantly colliding with the surface imparts a constant force over the area of the surface. This creates a constant gas pressure on the surface.
(B) The motion of the atoms in a gas is random. Thus, the atoms collide with the surface in no preferred direction. In addition, when a gas atom bounces off a surface, only the atom’s momentum that is perpendicular to the surface is changed. This means the impulse between the surface and the gas atom is also perpendicular to the surface. Thus, a gas always exerts a perpendicular force on the surface with which it is in contact.
13. (A) The nitrogen temperature decreases. The temperature of the carbon monoxide increases. The two gases reach thermal equilibrium at a temperature between 200 K and 400 K, but the final temperature of the combined gas will be closer to 200 K because there are more “cold” CO molecules than “hot” N2 molecules.
(B) Thermal energy will flow from the hotter nitrogen gas to the colder carbon monoxide. On a macroscopic scale, heat always flows from hot to cold. This is due to the microscopic behavior of faster moving “hot” molecules colliding with, and transferring energy/momentum to, slower moving “cold” molecules.
(C) The carbon monoxide distribution will be shifted to the left of the nitrogen because it has a lower temperature and lower average kinetic energy. The CO peak must be higher than that of nitrogen because there are more molecules of CO, and all the molecules are bunched in a smaller speed distribution. The area under the CO curve should be twice as large as the area under the N2 curve because there are twice as many molecules.
(D) The two gases have the same molecular mass; therefore, they will have the same shaped distribution with the same peak speed. The carbon monoxide distribution should have a peak lower than its initial condition because the gas is now spread out over a wider speed distribution. However, the CO peak must still be higher than the N2 peak because there are more molecules of CO. The nitrogen speed distribution should be higher than its initial value. The area under the CO curve should be twice as large as the area under the N2 curve because there are twice as many molecules.
14. There are several different ways to perform this experiment. Here is one example.
(A) Equipment: balloon, ruler or large Vernier calipers, thermometer, incubator or oven, refrigerator, and freezer.
(B)
(C) Procedure:
1. Inflate a round balloon. Allow it to come to room temperature.
2. Measure the diameter of the balloon using a large Vernier caliper or a ruler. It is helpful to take a picture of the balloon next to the ruler and use the picture to determine the diameter of the balloon. Note: This measurement must be done quickly as the air temperature inside the balloon, and size of the balloon, change quickly when handled.
3. Repeat this process with hot air inside an incubator or oven and cold air inside a refrigerator/freezer. Be sure to allow time for the air in the balloon to come to thermal equilibrium with the external environment in each case.
4. Use the diameter measurement to estimate the volume of the balloon.
(D) Extrapolate the data to a zero volume. The temperature at V = 0 will be our experimental value for absolute zero.
(E) The graph should be linear. The x-intercept will be our experimental prediction for absolute zero.
15. (A) Key features of the graph:

• All the blocks are identical and will reach equilibrium at the central temperature of 50°C.
• The temperature of block C continuously rises to equilibrium.
• Block A gains energy from block B, making block A initially rise above the equilibrium temperature of 50°C.
• Block B loses energy to both blocks, taking it below the temperature of block A. Block A then begins returning energy to block B. The sample solution shows that the temperature of block B drops below 50°C. This may or may not occur. The critical feature of the graph is that the temperature of block B drops below that of block A but remains above that of block C.
(B) The entropy rises as heat flows into block C. This expands the velocity and kinetic energy profile of the atoms. This, in turn, increases the overall disorder of the block as there are more thermal microstates for the atoms to occupy.
(C) This is an irreversible process. Therefore, the entropy of the system increases.
16.
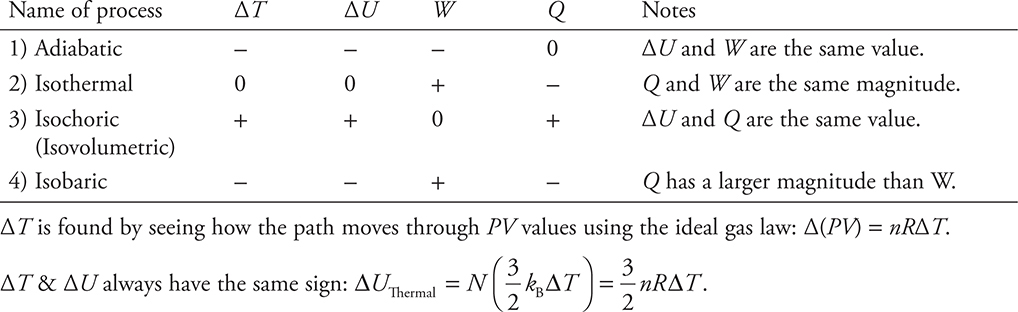
Moving to the right is negative work. Moving to the left is positive work. Moving up or down the volume does not change and the work is zero: W = −PΔV.
After finding ΔU and W, use the First Law of Thermodynamics to calculate Q: ΔU = Q + W.
17. (A) W = −PΔV therefore, WCA > WBC = 0 > WAB
(B) Δ(PV) = nRΔT therefore, ΔTAB > ΔTCA = 0 > ΔTBC
(C) 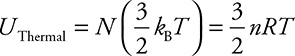 therefore, UB > UA = UC
(D) 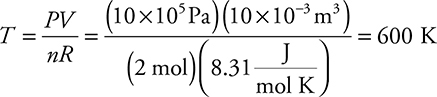
(E) The process returns to the original state: ΔT = 0.
(F) Work is the area under the path: 3750 J.
(G) Since ΔUCA = 0, Q = −W = −3750 J.
❯ Rapid Review
• Heat is a form of energy that can be transferred from one body to another. The internal energy of an object is the sum of the energies of all the molecules that make up that object. An object’s temperature is directly related to average kinetic energy per molecule of the object.
• Heat is the transfer of thermal energy. This transfer occurs through conduction, convection, and electromagnetic radiation.
• The molecules inside an object are in constant random motion.
• Objects with the same temperature are in thermal equilibrium. The net heat transfer between them is zero.
• Two bodies with the same temperature do not necessarily have the same internal energy, and vice versa.
• When objects are heated, they expand.
• The pressure and volume of an ideal gas are related by the ideal gas law. The law can either be written as PV = nRT, or PV = NkBT.
• The first law of thermodynamics states that the change in a gas’s internal energy equals the heat added to the gas plus the work done on the gas.
• PV diagrams illustrate the relationship between a gas’s pressure and volume as it undergoes a process. Four types of processes a gas can undergo are (1) isothermal [temperature stays constant]; (2) adiabatic [no heat is transferred to or from the gas]; (3) isobaric [pressure stays constant]; and (4) isochoric [volume stays constant].
• Heat flows naturally from a hot object to a cold object through collisions of the molecules.
• Entropy is a measure of disorder. The entropy of a system cannot decrease unless work is done on that system.