Organic Chemistry: Concepts and Applications - Headley Allan D. 2020
Spectroscopy Revisited, A More Detailed Examination
13.5 Mass Spectrometry
Mass spectrometry does not involve the use of energy from the electromagnetic spectrum to excite molecules and is a destructive method that comes about from the bombardment of electrons into a molecule. The result is that the molecule is destroyed, but in a consistent and often predictable manner so that the information can be used to assist in the determination of the structure of an unknown compound. When electrons collide into a molecule, the electrons typically knock out bonding electrons to create a charged species and based on the charge, the relative mass of each ion can be determined, hence giving an idea of the molecular mass of an unknown compound. Shown below is an example that involves the electronic bombardment of a simple molecule, methane, as shown in Reaction (13-4).
(13-4)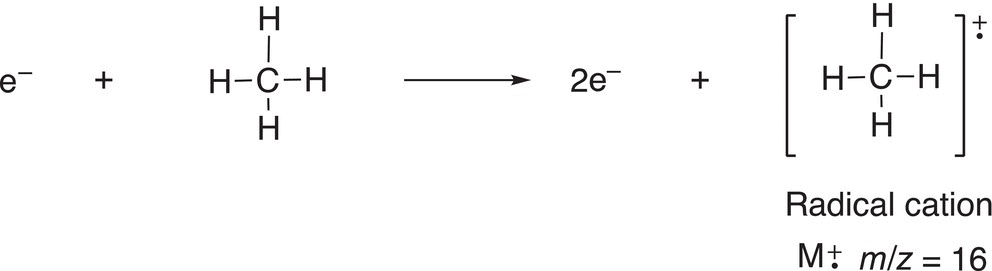
The radical cation can be considered as the molecule, but with one of its bonding electrons removed, which results in a radical (since it lacks just one electron). Also, since it lacks an electron, it is also considered positive (cation); hence, called a radical cation. This species that results from the loss of only an election is called the molecular ion. The molecular ion is not stable and will undergo fragmentation to form other radicals and cations. Another example, which involves the bombardment of electron into ethane, is shown in Reaction (13-5).
(13-5)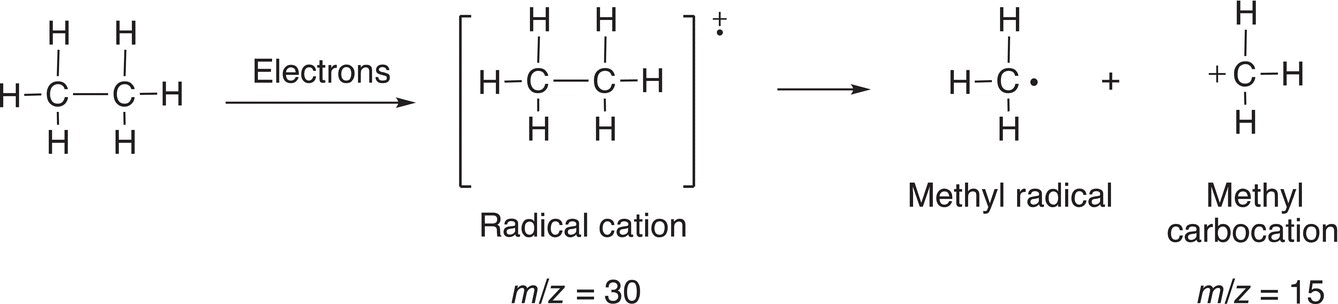
The mass spectrometer is designed to detect the relative mass-to-charge ratio of the different species generated from the bombardment of molecules with electrons. The schematics showing the components of the mass spectrometer is shown in Figure 13.14.
As shown in the schematics of the instrument, the sample is vaporized typically under reduced pressure as shown at the left of the diagram. The sample is then ionized by a beam of electrons, which typically is generated by heating an element, which is connected to electrodes. The ions are then separated based on their mass-to-charge ratio. The mass-to-charge of the ions are determined and recorded as a spectrum. Another type instrument uses electrospray ionization, instead of electron impact. Electrospray ionization is a non-destructive way of getting the molecules into the gas-phase. This method is commonly used to analyze organic molecules especially those with acidic and basic functional groups because they naturally form charged molecules that can be measured by MS as intact molecules. An example of one such instrument is shown in Figure 13.15.

Figure 13.14 Schematics showing the components of the electron impact mass spectrometer.
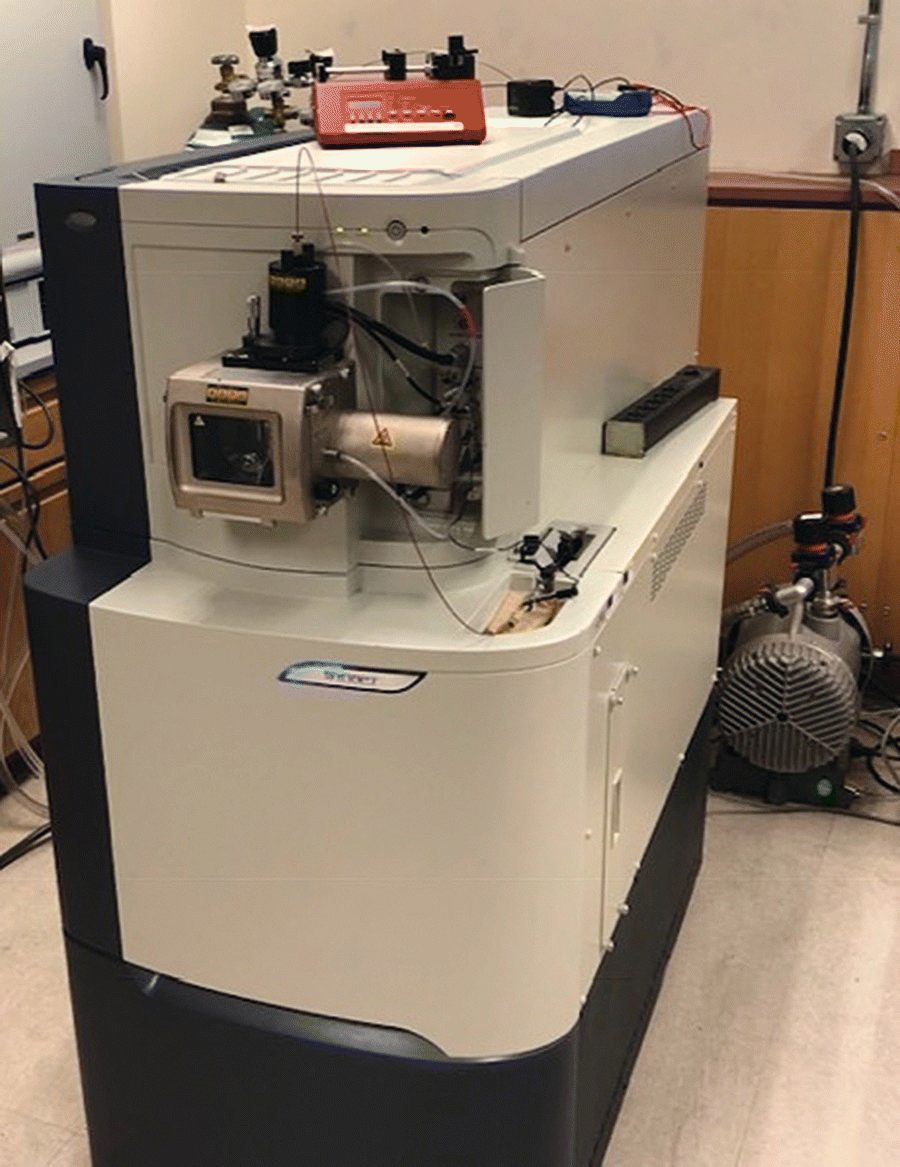
Figure 13.15 Electrospray ionization mass spectrometer.
Thus, for the mass spectrum of ethane, one would see essentially the signals for the molecular ion peak (m/z = 30) and another peak at m/z = 15. There is also another signal at M-1 for the loss of a hydrogen atom from the molecular ion fragment, another fragmentation pattern is shown in Reaction (13-6).
(13-6)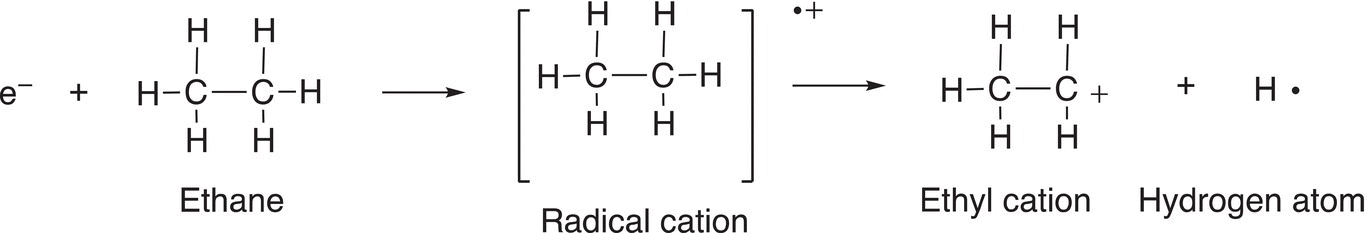
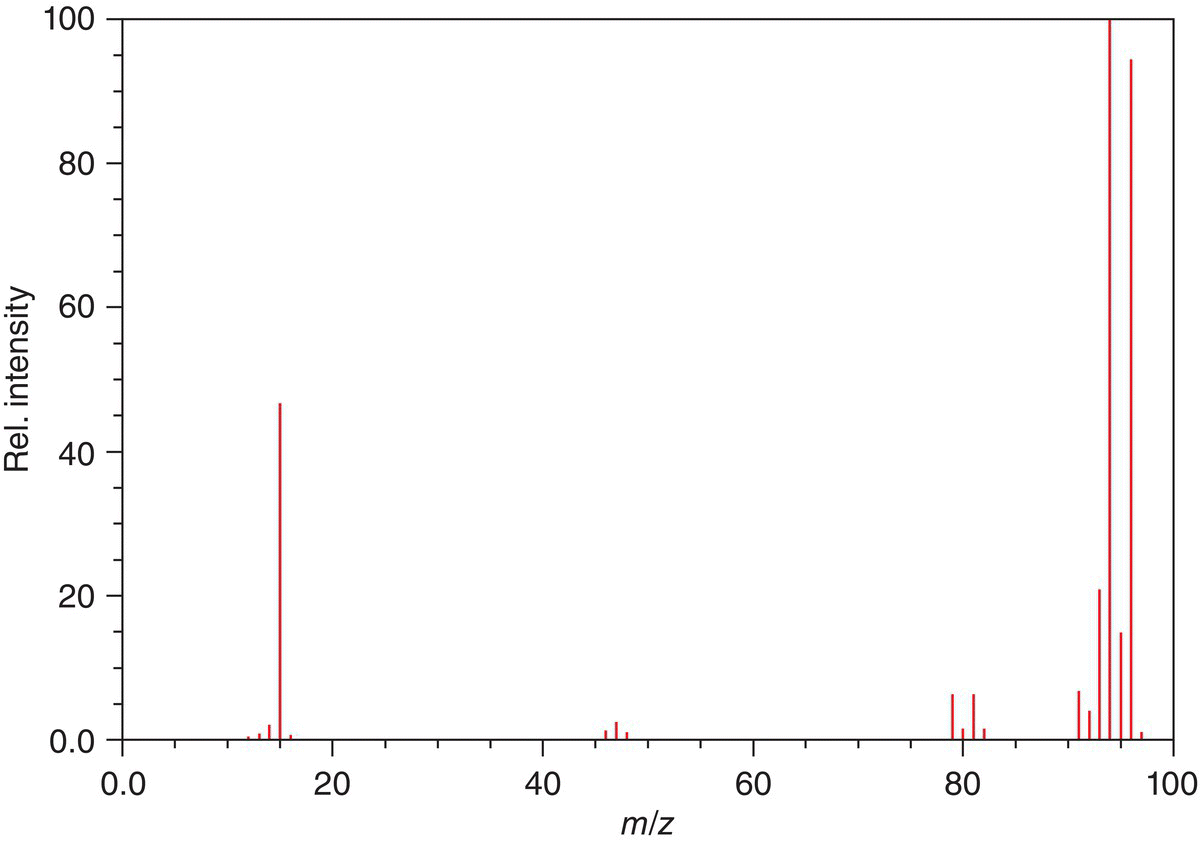
Figure 13.16 Electron ionization mass spectrum of methylbromide (CH3Br).
Source: with permission from NIST.
The mass spectrum for methylbromide (CH3Br) is shown in Figure 13.16. We know from the periodic table that the molecular weight of methylbromide is 95 g mol−1, which means that the molecular ion peak should be m/z = 95. There are two other peaks and much larger peaks, however, at m/z = 94 and m/z = 96. These peaks come about due to the presence of two isotopes of bromine which represent an isotope of 81Br, which exists in natural abundance 49.31%, compared to 79Br, which is 50.69%, these percentages that they occur in natural abundance are also reflected in the intensities of these peaks. Note that there is a peak at m/z = 15, which represents the methyl cation or radical. There is also another pair of signals around m/z = 80, which reflects the isotopes of bromine.
Figure 13.17 shows the mass spectrum for 2,4-dimethylpentane. Note that there is a very small peak at m/z = 86, which is the one mass unit greater than the major peaks. This peak is called the M + 1 peak and represents a mixture of isotopes of carbon. You will remember from general chemistry that the natural abundance of the isotopes of carbon are 12C, 13C, and 14C. The percentage of 14C is extremely small and the M + 1 comes mainly from the 13C that is present naturally in any sample of organic compound. As we saw in the above example, compounds that have a greater natural abundance of different isotopes, such as bromine, the ratio of those signals reflects the percentage that exists in natural abundance.
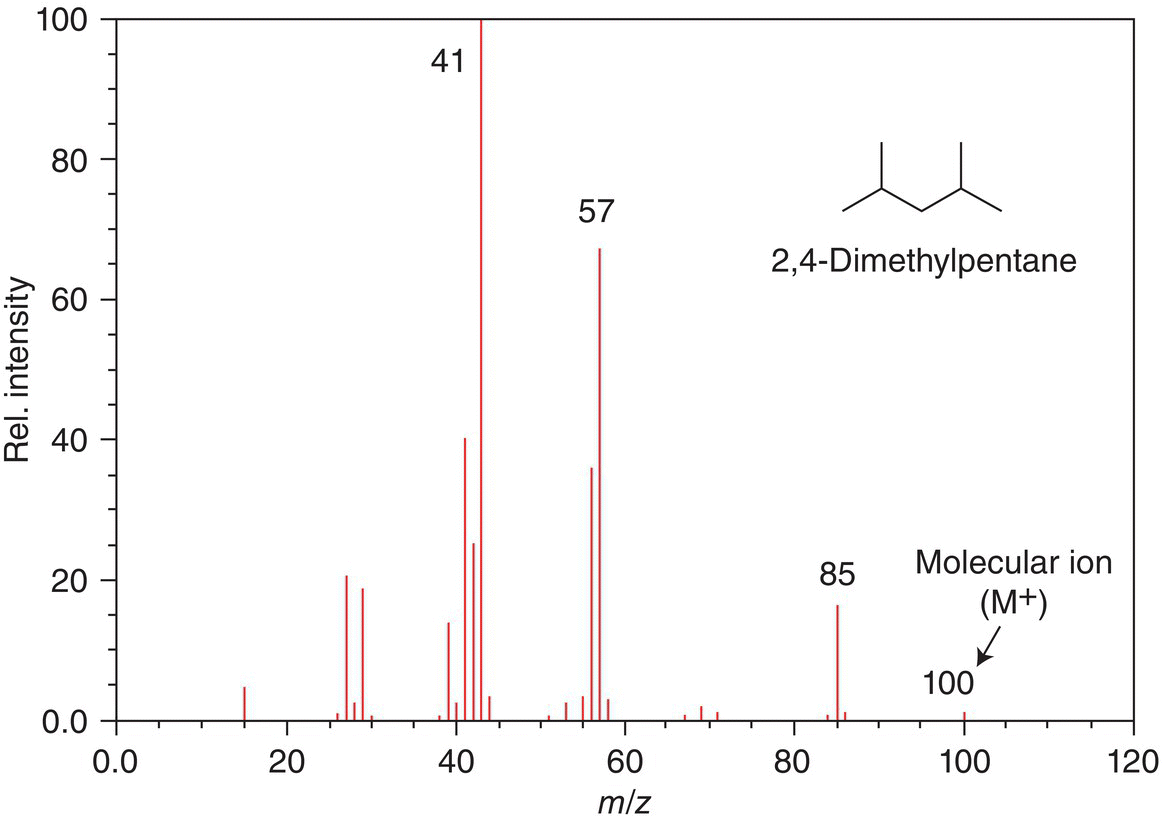
Figure 13.17 Electron ionization mass spectrum of 2,4-dimethylpentane.
Source: with permission from NIST.
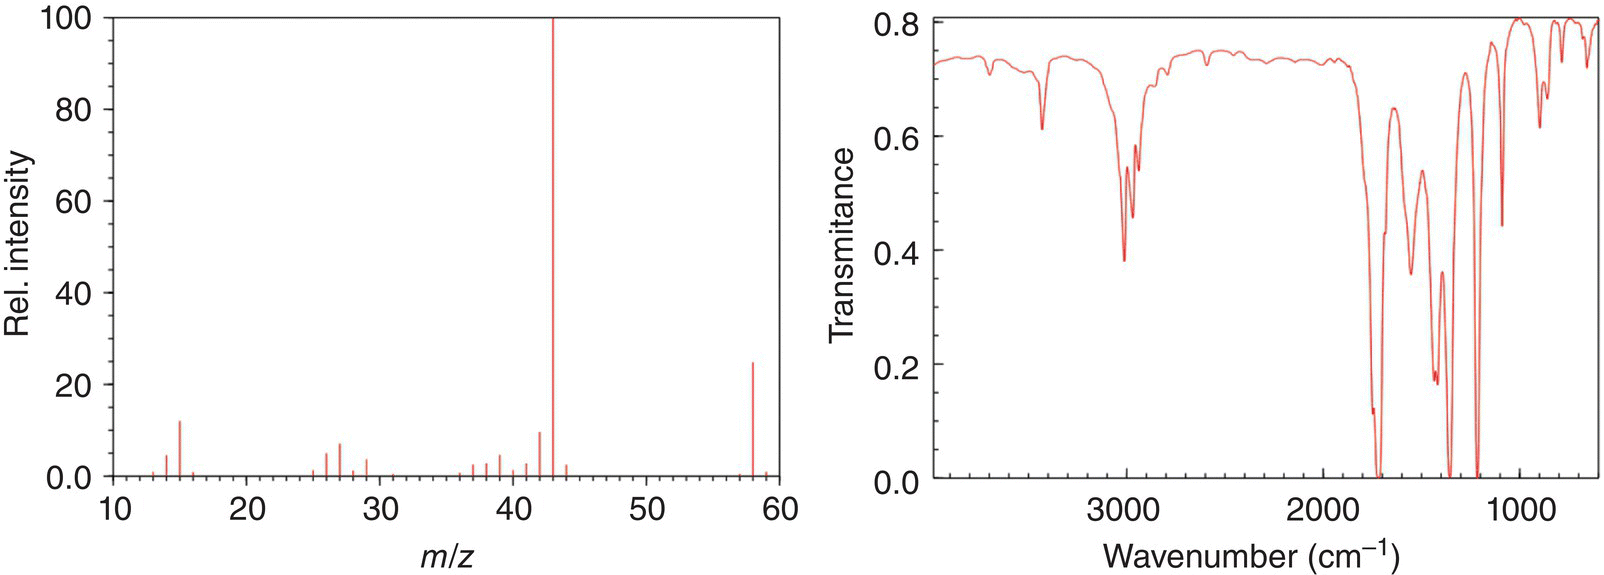
Problem 13.3
The mass spectrum and IR spectrum for an unknown compound are shown below, what is the likely structure of this unknown compound? The molecular formula of the unknown compound is C3H6O.