Process Technology: An Introduction - Haan A.B. 2015
3 Principles of chemical reaction engineering
3.5 Conversion, selectivtity, and yield
3.5.1 The degree of conversion
The degree of conversion is a dimensionless variable that represents the extent to which the reaction has proceeded. It is defined as the amount of reactant that has reacted divided by the initial amount of reactant that was present. For a constant volume bimolecular elementary reaction,
![]()
(3.12)
the degree of conversion for reactant A at a given time is now calculated from the initial amount of A present at time = 0, NA,O, and the amount of A that is still present at time = t, NA,t:
![]()
(3.13)
When the volume of reaction, VR, can be considered constant, the degree of conversion relates directly to the concentration by
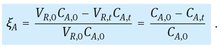
(3.14)
3.5.2 Selectivity and yield
In most industrial chemical operations we meet with the phenomenon that from a reactant A or reactants A and B, not only desired products like P and Q, but also undesired products like X and Y, are formed. Therefore the concepts of selectivity and yield have been introduced in chemical reaction engineering. Both concepts are of utmost importance for the final economic results of an entire chemical operation.
Since the reactants in a reactor are meant to be converted into the desired product to the maximum extent, it is not sufficient to obtain a reasonably high degree of conversion: this should be accompanied by a high selectivity of the reaction. The selectivity, σ, is defined as the ratio of the amount of a desired product P obtained and the amount of a key reactant A converted. When these amounts are expressed in molar units and the stoichiometry of the reaction equation is taken into account, the selectivity ranges between 0 and 1. For the bimolecular elementary reaction, the selectivity of converting reactant A in product P is given by
![]()
(3.15)
Analogous to the degree of conversion, the selectivity can be related directly to the concentrations when the reaction volume, VR, can be considered constant:
![]()
(3.16)
Ultimately, the merits of a complex reaction operation are closely related to the amount of desired product obtained with respect to the amount of key reactant A fed to the reactor. This ratio is called the product yield, ηP, which is calculated by multiplying the selectivity and the degree of conversion:
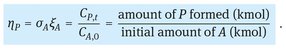
(3.17)
The yield can likewise vary between 0 and 1. It is high when both the selectivity and the relative degree of conversion are high, but it is low when either one of them is small. They apply equally well to simpler reactor systems as to systems with feed and/or discharge distribution, provided that more general definitions of conversion are used in the latter case.
3.5.3 Multiple reactions
In most industrial chemical operations several undesired by-products are formed simultaneously next to the desired product. For these multiple reaction systems the chosen reactor type and operating conditions are extremely important, because they may have a tremendous effect on the ratio of the products and by-products formed. Although high conversion rates result in smaller reactors and thus in lower investment costs, the yield of the desired products is often more important for overall plant economics. Higher yields result in lower raw material costs per unit of the desired product and thus in lower operating expenses for raw materials and disposal of waste products. Higher yields and selectivities indirectly also influence the investment costs for the separation of the reactor products and the disposal units.
Since multiple reactions are so varied in type and seem to have so little in common, we may despair of finding general guiding principles for design. Fortunately this is not the case, because all multiple reactions can be considered to be combinations of two primary types: parallel reactions and series reactions.
3.5.3.1 Parallel reactions
An example of a parallel reaction system is the decomposition of reactant A by either one of two paths as encountered in the steam cracking of naphtha:
![]()
(3.18)
![]()
(3.19)
with the corresponding rate equations in case of a first order reaction:
![]()
(3.20)
![]()
(3.21)
The selectivity for the formation of the desired product P from reactant A at any time and place in a reactor can now be calculated from
![]()
(3.22)
Interestingly enough, the selectivity for two parallel first-order reactions does not depend on whether the reaction is carried out in a batch, tubular, or continuous tank reactor. The ratio of P and S obtained is completely determined by the ratio of the reaction rate constants k1 and k2. It can only be influenced by temperature when both reaction paths have a difference in activation energy:
![]()
(3.23)
3.5.3.2 Reactions in series
In practice it is often encountered that the formed product reacts further to undesired by-products. Typical examples are oxidation, partial hydrogenation, and chlorination reactions. Drawing conclusions about the optimal reactor choice and operating conditions for reactions in series is in general more complex than for parallel reactions. For a series of two first-order reactions where the formed product P reacts further to the unwanted product S one gets
![]()
(3.24)
with the corresponding rate equations
![]()
(3.25)
![]()
(3.26)
![]()
(3.27)
Introducing these reaction rates provides us with an equation for selectivity of product P formation that has become a function of concentration:
![]()
(3.28)
Calculation of the actual selectivity at a given time or place in a reactor is now only possible from the reactant and products concentration profiles as derived from the reactor mass balance equations. The general form of these concentration profiles is illustrated in Fig. 3.5. From these concentration profiles it is directly seen that the selectivity approaches zero at long residence times, and that an optimum exists between conversion and yield.
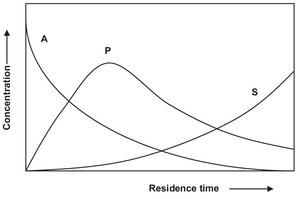
Fig. 3.5: Concentration profile for two first-order reactions in series as a function of the residence time in a reactor.
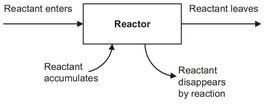
Fig. 3.6: Schematic representation of the material balance for a reactor.